SaaS Metrics and KPIs Every Company Should Track
The SaaS metrics and KPIs that actually predict growth
Most SaaS founders don’t fail because they picked the wrong metric. They fail because they’re tracking twenty metrics and can’t tell which three actually explain what’s happening to the business. Website traffic looks healthy, signups are steady, and the company is still running out of cash, because nobody connected those numbers to the ones that actually determine whether the business survives: how much it costs to win a customer, how long that customer sticks around, and whether the company is burning cash faster than it’s earning it back.
A subscription business doesn’t get paid once. It gets paid in small increments over a relationship that might last months or years, so the usual sales metrics (units sold, revenue booked) don’t tell you much on their own. You need metrics built for recurring revenue specifically. Below is the working set most finance teams and SaaS CFOs rely on, organized by what question each one actually answers.
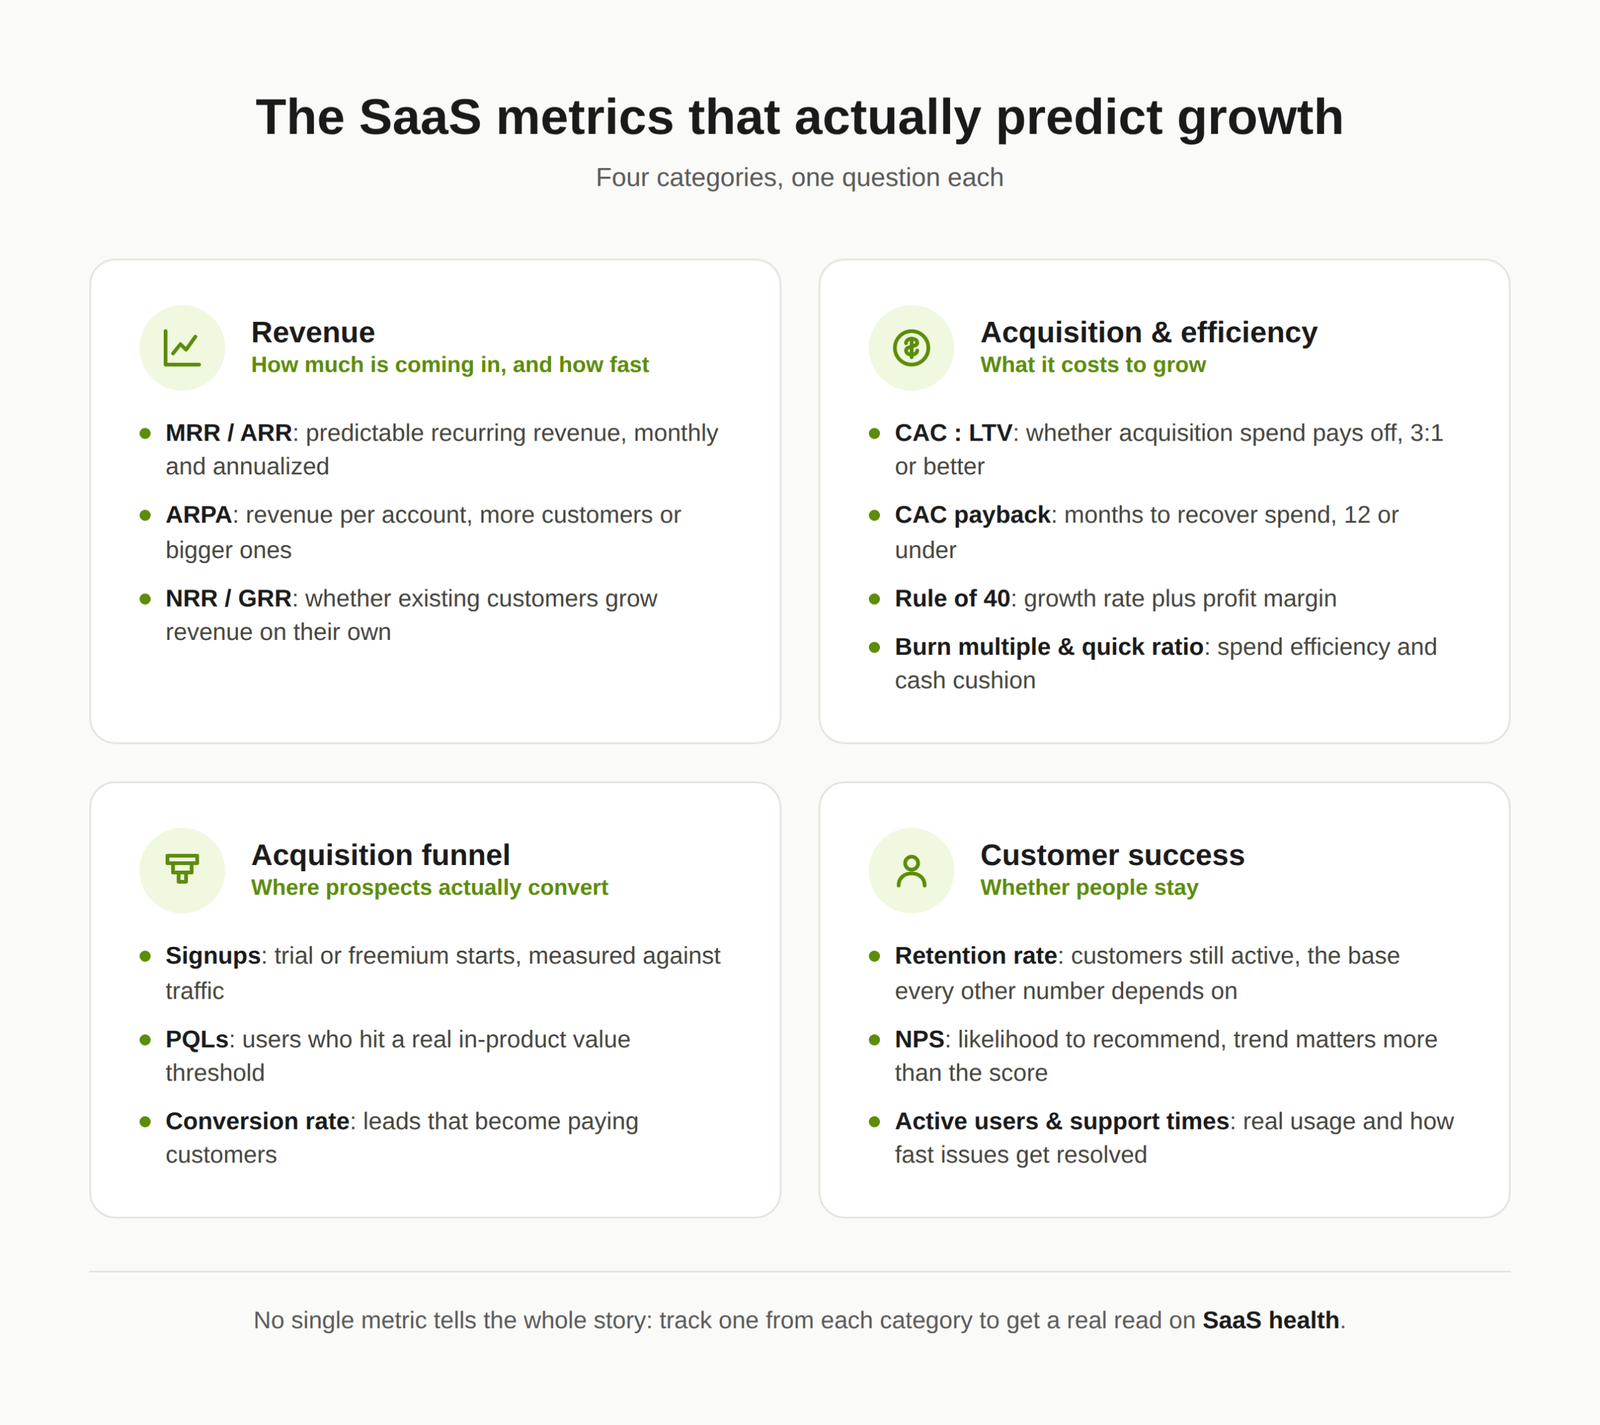
Revenue metrics: how much money is coming in, and how fast
Monthly recurring revenue (MRR) is the predictable revenue your subscriptions generate each month, excluding one-time fees and free trials. It’s calculated as total customers multiplied by average revenue per customer per month. If you have 100 customers paying $200 a month, your MRR is $20,000. Break it into new MRR and churned MRR separately: if churned MRR is bigger than new MRR, you’re shrinking even if the top-line number still looks flat.
Annual recurring revenue (ARR) is MRR multiplied by 12. It’s the number investors and boards actually care about, because it strips out monthly noise and shows the underlying trajectory. MostSaaS financial models build their entire revenue forecast off an MRR bridge rather than ARR directly, since ARR hides the month-to-month movement that actually explains why revenue changed.
Average revenue per account (ARPA) is your recurring revenue divided by your total number of customers. It’s easy to overlook because MRR already implies it, but tracking ARPA on its own tells you something MRR can’t: whether growth is coming from more customers, bigger customers, or both. A rising ARPA alongside flat customer count usually means upsells and plan upgrades are doing the work, which is a very different growth story than one driven purely by new logos.
Churn rate comes in two forms, and conflating them hides real problems. Logo churn is the percentage of customers who cancel in a given period. Revenue churn is the percentage of recurring revenue lost to those cancellations and downgrades. A company can have low logo churn and still be in trouble if the customers leaving are the large accounts, which is exactly why revenue churn needs to be tracked separately from logo churn rather than assumed to move together.
Net revenue retention (NRR) measures how existing customers’ revenue changes over time, accounting for upgrades, downgrades, and cancellations. Gross revenue retention (GRR) does the same thing but excludes upsells, showing pure retention without the boost from expansion. NRR above 100% means your existing customer base is growing revenue on its own, before you sign a single new customer. That’s the single number most SaaS investors look at first.
Acquisition and efficiency metrics: what it costs to grow
Customer acquisition cost (CAC) is total sales and marketing spend divided by the number of new customers acquired in that period. On its own it tells you little. It only becomes useful next to customer lifetime value.
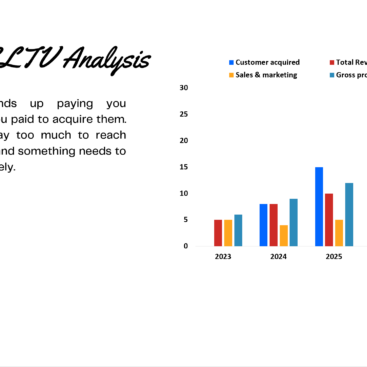
Customer lifetime value (LTV) estimates the total revenue a customer generates before they churn, calculated as average monthly revenue per customer divided by the churn rate, or as monthly revenue multiplied by expected customer lifespan in months. The rule most SaaS operators use: LTV should be at least three times CAC. A 3:1 ratio or better generally signals a sustainable acquisition model. Below that, growth is being bought at a price the business can’t recover fast enough.
CAC payback period measures how many months it takes for a customer’s revenue to cover the cost of acquiring them. The industry benchmark is 12 months or under. Strong SaaS companies get this down to five or six. A payback period stretching past a year usually means acquisition spend is outrunning what the business can actually finance.
Rule of 40 adds your revenue growth rate to your profit margin. A company growing 30% year over year while losing 5% scores 25, which signals growth isn’t yet paying for itself. A company growing 20% with a 20% margin scores exactly 40. This metric matters because it lets an unprofitable, fast-growing company and a profitable, slower one both look reasonable, as long as the combined number clears the bar.
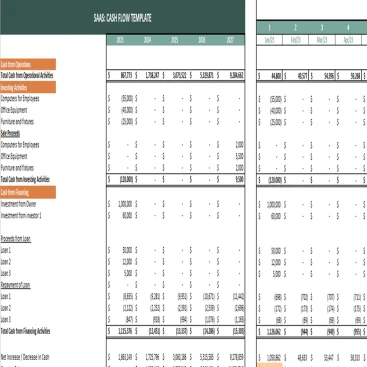
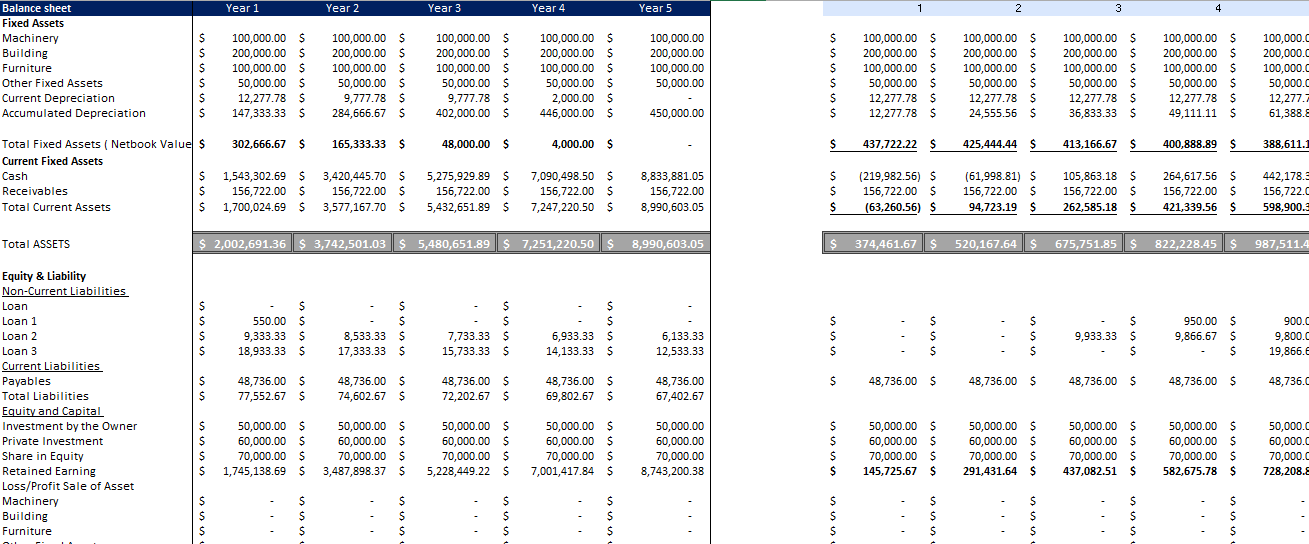
Burn multiple is net cash burned divided by net new ARR. Below 1x is considered excellent, meaning the company is generating more new recurring revenue than it’s spending to get there. Above 2x tends to raise real questions about whether the growth is sustainable. A related check worth pulling from finance rather than sales is the quick ratio: current assets minus inventory, divided by current liabilities. It’s a general corporate finance measure, not a SaaS-specific one, but it tells you how much liquid cushion the business has if burn runs hotter than planned, which matters as much as the growth metrics when you’re deciding how aggressively to spend.
Oak’scash flow analysis work with SaaS clients usually starts by lining up burn multiple against the quick ratio, because a company can look efficient on paper and still run out of runway if its liquid assets are thinner than its burn rate assumes.
Acquisition funnel metrics: where prospects actually convert
Signups measure how many prospects start a trial or freemium plan. On their own they don’t mean much. Divide signups by website visitors to get a signup rate, and compare that against your traffic to see whether the funnel is actually working.
Product-qualified leads (PQLs) are trial or freemium users who’ve hit a specific in-product usage threshold that signals they’ve experienced real value, not just signed up. PQLs convert at a meaningfully higher rate than leads qualified on content downloads or email opens, because they’re based on actual product behavior rather than intent signals.
Conversion rate to customer is the percentage of leads, whatever their source, that become paying customers. It tells you how well the whole funnel, not just one channel, is turning interest into revenue. When Oak worked through aSaaS case study involving a company with strong top-line sales growth but recurring losses, the funnel numbers looked fine in isolation. The problem only showed up once conversion rate was checked against CAC and payback period together.
Customer success metrics: whether people stay
Customer retention rate is the percentage of customers still active at the end of a period, excluding anyone who joined during that same period. It drives nearly every other number on this list: recurring revenue, LTV, and growth rate all depend on it.
Net Promoter Score (NPS) asks customers how likely they are to recommend you, on a 0 to 10 scale. Subtract the percentage of detractors (0-6) from the percentage of promoters (9-10) to get your score. The average NPS for SaaS and B2B companies sits around 40, though the trend over time matters more than the absolute number.
Number of active users, tracked as daily or monthly active users, shows how many people are actually using the product, not just how many signed up. Watch the ratio between the two: if most monthly active users never become daily active users, that’s usually a retention problem forming before it shows up in churn.
Support response and resolution time are two separate clocks. First response time is how long it takes support to reply after a ticket is opened. Resolution time is how long it takes to actually close it. Customers tolerate slower first responses more than slow resolutions, so track them separately rather than blending them into one “support speed” number.
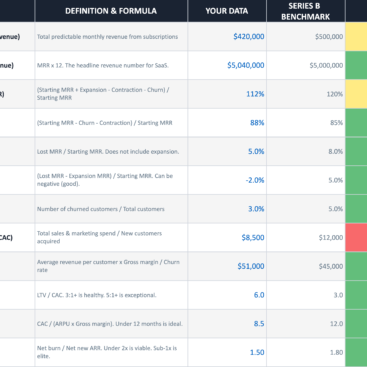
A quick reference table
| Metric | What it answers | Formula | Healthy benchmark |
| MRR / ARR | How much predictable revenue exists | Customers x average revenue per customer | Growing month over month |
| ARPA | Whether growth comes from more customers or bigger ones | MRR / total customers | Rising alongside stable or growing customer count |
| Logo churn | What share of customers you’re losing | Customers lost / customers at period start | Under 5-7% monthly for most B2B SaaS |
| Revenue churn | How much recurring revenue you’re losing | Revenue lost / revenue at period start | Lower than logo churn ideally |
| NRR | Whether existing customers grow revenue on their own | (Starting revenue + expansion – contraction – churn) / starting revenue | Above 100% |
| CAC:LTV | Whether acquisition spend pays off | LTV / CAC | 3:1 or higher |
| CAC payback | How fast you recover acquisition spend | CAC / (monthly revenue per customer x gross margin) | 12 months or under |
| Rule of 40 | Whether growth and profitability together are healthy | Revenue growth rate % + profit margin % | 40 or above |
| Quick ratio | How much liquid cushion exists against burn | (Current assets – inventory) / current liabilities | Above 1.0 |
| NPS | How likely customers are to recommend you | % promoters – % detractors | Around 40 for SaaS |
Why this matters more than most founders expect
Changing your delivery model to the cloud doesn’t make a business a SaaS business by itself. What makes it one is a revenue model built on small, recurring payments instead of one-time sales, and that model rewards different behavior than a traditional business does. A company can grow its customer count and still shrink its revenue, if the customers it’s adding pay less and leave sooner than the ones it’s losing. That’s the exact failure mode NRR and revenue churn are built to catch, and it’s invisible if you’re only watching MRR or signups in isolation.
Sales is harder in this model too. Every dollar spent on acquisition has to be earned back gradually through monthly payments rather than recovered immediately, which is why CAC payback period matters as much as CAC itself. A company that spends efficiently but recovers that spend too slowly can run out of cash even while its unit economics look fine on paper. This is where burn multiple and the quick ratio earn their place on the list: growth metrics tell you if the business is working, but they don’t tell you how much room there is to keep testing that growth if a quarter goes wrong.
Frequently Asked Questions
What’s the difference between a SaaS metric and a SaaS KPI?
A metric is any measurable data point (signups, ticket volume, page views). A KPI is a metric your leadership team has tied directly to a business outcome and set a target for. Every KPI is a metric, but not every metric is a KPI.
Which SaaS metric should a small team track first?
Start with MRR, churn rate, and CAC payback period. Together they answer the three questions that matter most early on: how much recurring revenue exists, how fast you’re losing customers, and how long it takes to recover what you spent to get them.
What’s a good CAC:LTV ratio?
3:1 is the widely used benchmark. Below that, the business is likely spending too much relative to what each customer returns. Well above 5:1 can sometimes mean the company is under-investing in growth rather than being efficient.
How is churn rate different from revenue churn?
Churn rate (logo churn) counts how many customers left. Revenue churn counts how much recurring revenue left with them. A company can lose a small number of customers and still take a large revenue hit if those customers were on high-value plans, so both numbers need tracking separately.
Does a high NPS guarantee low churn?
No. NPS reflects sentiment, not behavior, and customers can say they’d recommend a product while still canceling it over price or a better alternative. Track NPS alongside retention and churn rather than as a stand-in for either.
How often should SaaS metrics be reviewed?
Revenue and churn metrics are typically reviewed monthly, since billing cycles are usually monthly. Efficiency metrics like CAC payback and Rule of 40 are more useful reviewed quarterly, since they need enough data to smooth out short-term noise.
Conclusion
No single metric on this list tells the whole story, and that’s the point. MRR shows what’s coming in, churn and NRR show whether it’s sticking, and CAC payback and Rule of 40 show whether the growth is actually affordable. A SaaS company that tracks all four together has a real read on its health. One that tracks only the metrics that look good in a board deck usually finds out the hard way which numbers it should have been watching.
Oak Business Consultant provides fractional CFO support built specifically for SaaS companies, from metric frameworks to full financial models. If you’re setting up this kind of tracking for the first time, Oak’s SaaS financial modeling services can help turn these metrics into an actual forecast rather than a list of numbers on a dashboard.