Building an Integrated 3 Statement Model
Constructing a Comprehensive 3 Statement Model

Most financial models look impressive until someone asks you to change a single assumption. Then everything breaks. The reason? The three statements were never truly integrated in the first place.
This guide walks you through how to build a 3 statement financial model the right way, one where a change in revenue growth ripples through the income statement, reshapes the balance sheet, and updates the cash flow statement without any manual intervention. That is what makes it integrated. That is also what makes it genuinely useful.
What Is a 3 Statement Financial Model?
A 3 statement financial model is a dynamic Excel-based framework that links three core financial statements — the income statement, the balance sheet, and the cash flow statement — into one connected system. When you change an assumption in one place, the change flows through the entire model automatically.
The reason this matters so much is that these three statements do not exist in isolation in the real world. Revenue on the income statement creates receivables on the balance sheet. Net income from the income statement flows into retained earnings in equity. Cash from operations on the cash flow statement ultimately determines the ending cash balance on the balance sheet. They are one financial story told three different ways.
An integrated model captures that story. A disconnected model just tells three separate stories and hopes they line up.
Who uses a 3 statement financial model?
Investment bankers use it as the foundation for DCF valuations, LBO models, and merger analysis. FP&A teams use it for annual budgeting and rolling forecasts. Private equity professionals use it to stress-test acquisitions. Equity research analysts use it to forecast earnings. Even founders at growth-stage startups use simplified versions to understand their runway and fundraising needs.
The Three Core Financial Statements Explained
Before you build anything, you need to understand what each statement actually measures and why the linkages between them work the way they do.
The Income Statement

The income statement answers one question: was the business profitable over a given period?
It runs from revenue at the top down to net income at the bottom, passing through several important subtotals along the way. Revenue minus cost of goods sold gives you gross profit. Gross profit minus operating expenses gives you operating income (also called EBIT). Subtract interest expense and add interest income, and you get pre-tax income. After taxes, you arrive at net income.
Net income is the number that connects the income statement to both the balance sheet (where it flows into retained earnings) and the cash flow statement (where it serves as the starting point for operating cash flows). This is why you build the income statement first — everything else follows from it.
Key line items to model:
Revenue, cost of goods sold, gross profit, selling and general administrative expenses, EBITDA, depreciation and amortization, EBIT, interest expense, pre-tax income, income tax expense, net income.
The Balance Sheet

The balance sheet answers a different question: what does the company own, what does it owe, and what is left over for shareholders at a specific point in time?
It follows the fundamental accounting equation: Assets = Liabilities + Shareholders’ Equity. This equation must hold at all times. If your balance sheet does not balance, something in your model is wrong — not off by a little, but fundamentally incorrect.
Unlike the income statement, which covers a period of time, the balance sheet is a snapshot. It shows you the stock of assets and liabilities, not the flow. That distinction matters enormously when you are linking the statements together.
Key line items to model:
Assets: cash and equivalents, accounts receivable, inventory, prepaid expenses, property, plant and equipment (net of depreciation), intangibles.
Liabilities: accounts payable, accrued expenses, short-term debt, long-term debt.
Equity: common stock, additional paid-in capital, retained earnings.
Retained earnings is the account that ties directly back to the income statement. Each period, net income is added to (and dividends are subtracted from) the retained earnings balance from the prior period. This is one of the most important linkages in the model.
The Cash Flow Statement

The cash flow statement answers the third question: how did cash actually move during the period?
This is not the same as profit. A company can be highly profitable on an accrual basis and still run out of cash. The cash flow statement reconciles that gap. It takes net income as a starting point and then makes adjustments for non-cash items (like depreciation) and changes in working capital (like increases or decreases in receivables and inventory) to show how much actual cash the business generated or consumed.
The statement has three sections:
Operating activities covers the cash generated by the core business. It starts with net income, adds back non-cash charges like depreciation, and adjusts for working capital changes. An increase in accounts receivable, for example, means you recognized revenue that has not been collected yet — so it is a use of cash that reduces operating cash flow.
Investing activities captures capital expenditures and any proceeds from the sale of assets. This section connects to the PP&E balance on the balance sheet: capex increases PP&E, while depreciation reduces it.
Financing activities shows how the company raised or returned capital — debt issuances, debt repayments, equity issuances, share buybacks, and dividends paid.
The ending cash balance on the cash flow statement must equal the cash balance on the balance sheet. That reconciliation is what proves your model is integrated correctly.
How to Build a 3 Statement Financial Model: Step by Step
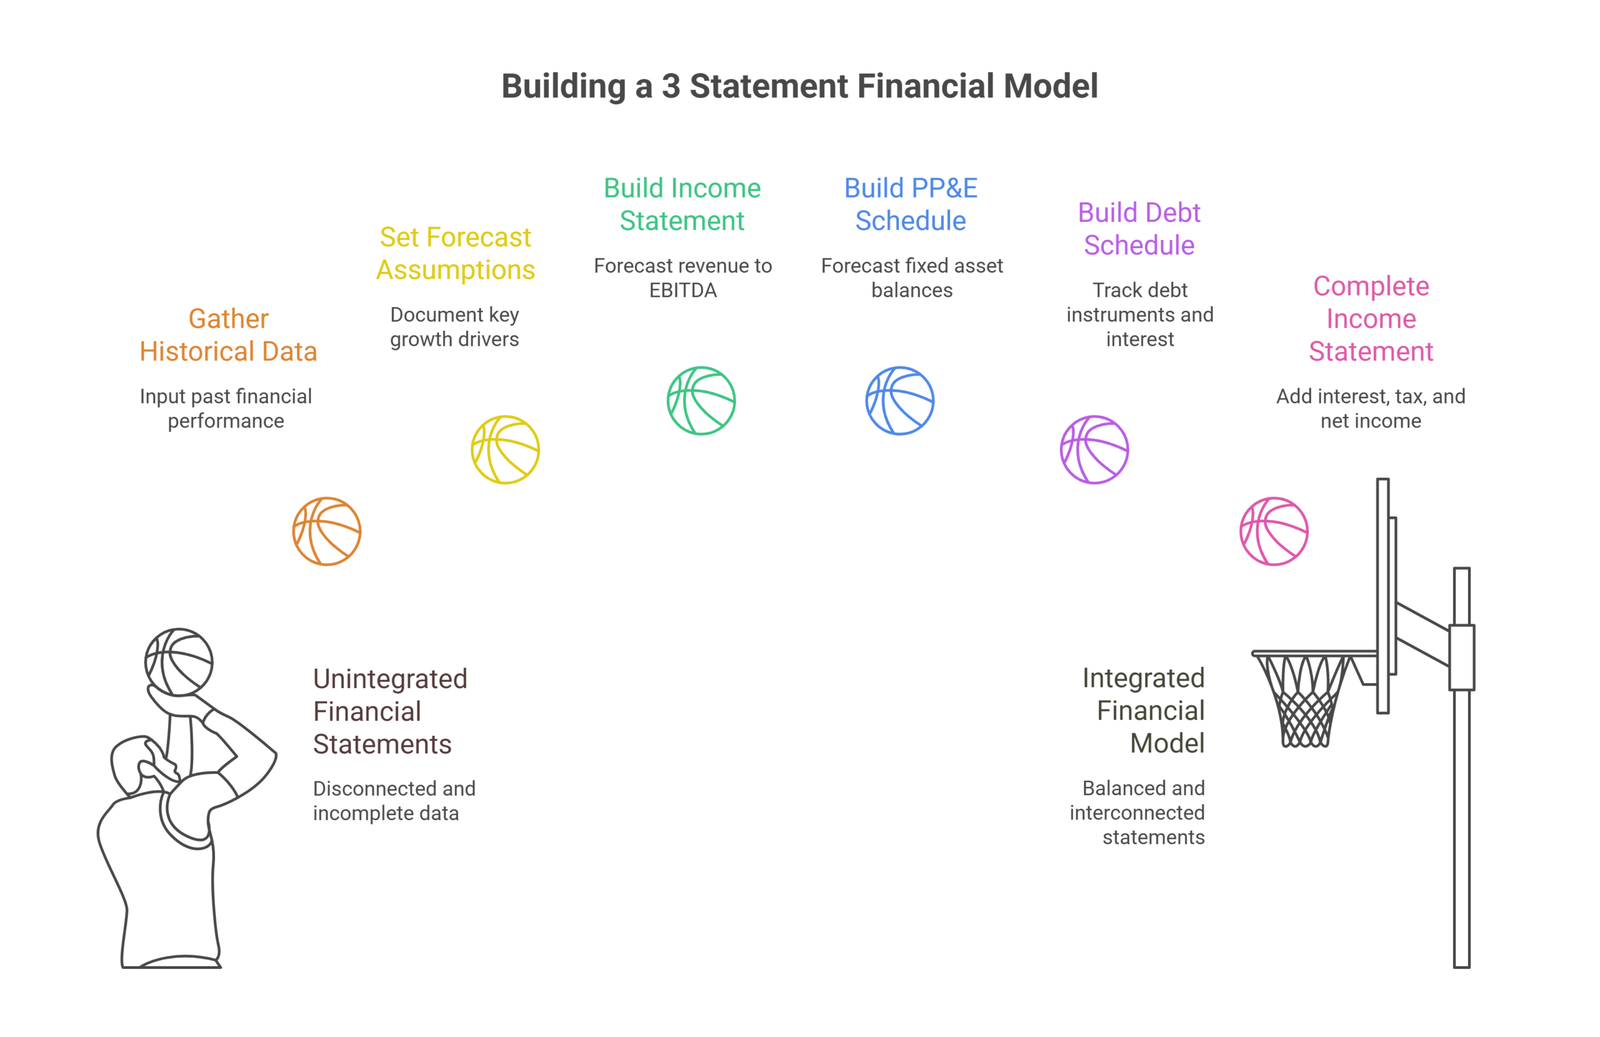
Step 1: Gather and Input Historical Financial Data
Start with at least three years of historical financials, and ideally five. For public companies, these come from SEC filings (10-Ks and 10-Qs). For private companies, you work from audited financial statements or management accounts.
Enter this data into Excel with historical years in separate columns. Use consistent formatting: blue text for hardcoded inputs, black text for formulas. Keep assumptions in a clearly labeled section, separate from the output statements. This discipline pays off every time you update the model.
Do not just copy-paste numbers blindly. Read the financial statements. Understand what drove revenue growth, why margins changed, whether there were any one-time items that should be excluded from your base case. Historical normalization is not optional — it is the foundation your entire forecast rests on.
Step 2: Set Your Forecast Assumptions
Every forecast is only as good as its assumptions, and every assumption should be documented.
For the income statement, key assumptions typically include revenue growth rate (by segment if applicable), gross margin, operating expense as a percentage of revenue, effective tax rate, and any known step changes in the cost structure.
For the balance sheet, working capital assumptions drive receivables, payables, and inventory. Express these as days: Days Sales Outstanding (DSO) for receivables, Days Payable Outstanding (DPO) for payables, and Days Inventory Outstanding (DIO) for inventory. These metrics are stable enough to project reliably and intuitive enough to stress-test.
For capital assets, you need a capex assumption (often expressed as a percentage of revenue or a fixed dollar amount) and a depreciation method. For financing, you need to know the debt schedule — existing maturities, interest rates, and any planned new borrowings.
Group all of these assumptions in one section. A well-organized assumptions page is what separates a model that can be handed to someone else from one that only the builder can use.
Step 3: Build the Income Statement Forecast
With assumptions in place, forecast the income statement from revenue down to EBITDA. Stop there for now — you cannot complete the interest expense line until you have built the debt schedule, and you cannot finalize depreciation until you have built the PP&E schedule.
This is a common sticking point for new modelers. You will come back to complete the income statement after the supporting schedules are done.
Step 4: Build the PP&E Schedule
The PP&E schedule (also called the fixed asset roll) forecasts the net property, plant, and equipment balance on the balance sheet. The logic is straightforward:
Ending PP&E = Beginning PP&E + Capital Expenditures – Depreciation
Calculate depreciation using your chosen method (straight-line is most common for a high-level model; useful life or percentage-of-revenue methods add granularity when needed). Plug the depreciation figure back into the income statement above EBIT, and carry the ending PP&E balance to the balance sheet.
Capital expenditures also flow to the investing section of the cash flow statement. This is the first live cross-statement linkage you will create.
Step 5: Build the Debt Schedule
The debt schedule tracks each debt instrument separately: opening balance, new borrowings, repayments, and closing balance. Interest expense is calculated on either the opening balance or the average balance for the period.
Once you have the closing debt balance and the interest expense figure, you can complete two things: the interest expense line on the income statement, and the long-term debt line on the balance sheet. Debt issuances and repayments also flow to the financing section of the cash flow statement.
A note on the circularity issue. If you calculate interest on the average debt balance, you introduce a circular reference into the model: interest expense affects net income, which affects the cash flow statement, which affects the cash balance, which can affect debt repayment, which affects the interest expense you started with. Excel can handle this with iterative calculations turned on, but it is worth understanding why the circularity exists before you enable that setting. Many practitioners simplify by using the opening balance for interest expense to avoid the issue entirely at the early modeling stage.
Step 6: Complete the Income Statement
Now that depreciation and interest expense are calculated from their respective schedules, reference them back into the income statement. Add the tax calculation (pre-tax income multiplied by the effective tax rate) and arrive at net income. This number will now flow to two places: the retained earnings calculation on the balance sheet and the top of the cash flow statement.
Step 7: Complete the Balance Sheet
With net income finalized, you can project the full balance sheet — except for the cash line.
Working capital items (accounts receivable, inventory, accounts payable) are calculated directly from your DSO, DIO, and DPO assumptions applied to the revenue and COGS forecasts. PP&E comes from the schedule you built in Step 4. Debt comes from the schedule in Step 5. Retained earnings is the prior period balance plus net income minus any dividends.
The cash line gets filled in last, once the cash flow statement is complete. Leave it as a placeholder for now.
Step 8: Build the Cash Flow Statement and Reconcile Cash
The cash flow statement is largely a linking exercise at this point. You are pulling numbers that already exist in the model and organizing them into the three sections:
Operating cash flow: Start with net income, add back depreciation and amortization, then adjust for changes in working capital. An increase in receivables is a use of cash (negative); an increase in payables is a source (positive). The formula for each working capital change is simply current period balance minus prior period balance.
Investing cash flow: Capital expenditures, pulled directly from the PP&E schedule. Any asset sales or acquisitions go here as well.
Financing cash flow: Net debt issuances and repayments from the debt schedule, equity issuances, share repurchases, dividends paid.
Sum all three sections, add the result to the prior period ending cash balance, and you have the current period ending cash balance. This number goes directly onto the balance sheet — replacing the placeholder you left in Step 7.
If the balance sheet now balances with this cash figure in place, your model is integrated correctly. If it does not, you have an error somewhere in the working capital linkages or the retained earnings roll. A simple check cell (assets minus liabilities minus equity, which should equal zero) will confirm whether you are balanced.
The Key Linkages That Make the Model Work
Understanding these connections is what separates someone who can follow instructions to build a model from someone who can diagnose and fix one.
Net income flows from the income statement to retained earnings on the balance sheet and to the top of the operating section on the cash flow statement. This is the primary connection between all three statements.
Depreciation is a non-cash charge on the income statement that gets added back in the operating section of the cash flow statement. It also drives the PP&E balance down on the balance sheet each period.
Capital expenditures appear as investing outflows on the cash flow statement and increase (or sustain) the PP&E balance on the balance sheet.
Debt changes affect both the financing section of the cash flow statement and the debt balance on the balance sheet. Interest expense from those debt balances flows back to the income statement.
Working capital changes are the bridge between accrual-basis income and cash-basis income. They appear as adjustments in the operating section of the cash flow statement and are calculated as changes in balance sheet accounts.
The ending cash balance closes the loop. It is the output of the cash flow statement and the input to the balance sheet. When it balances, the model is integrated.
Things Most Guides Do Not Tell You
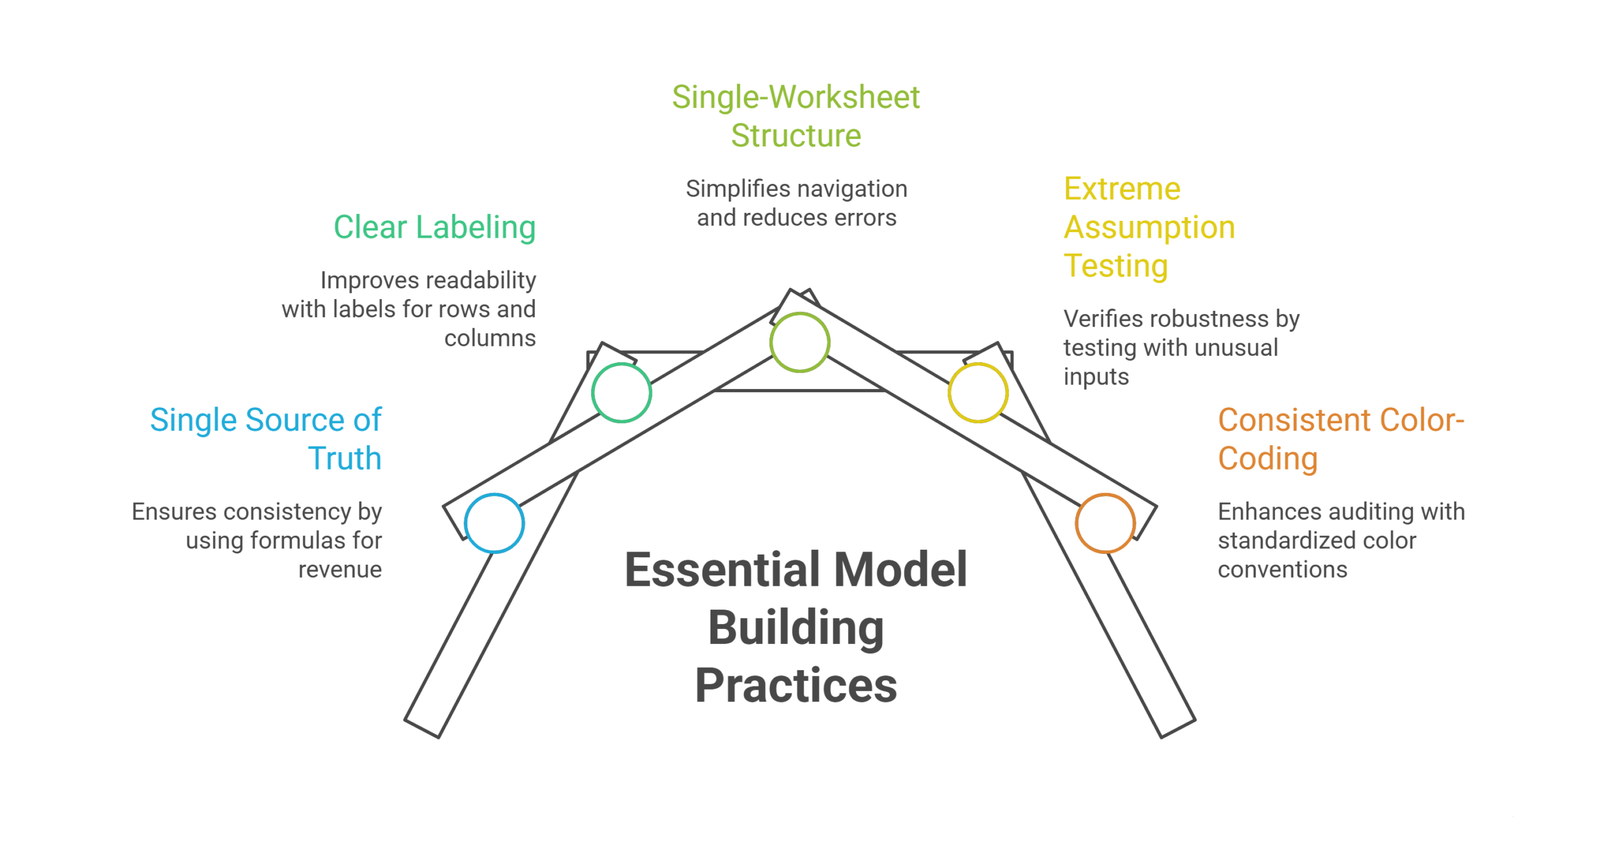
Your model should have a single source of truth for every number. If revenue appears in three different places in your spreadsheet, it should be a formula reference in two of those places and a hardcoded input in exactly one. Models that copy and paste the same number in multiple cells will eventually diverge.
Label everything. The person reviewing your model at 11pm before a board meeting is not going to ask you what “cell F47” means. Every row and column should have a clear label. Every assumption should have a note or comment explaining where it came from.
Use a single-worksheet structure when possible. It is much easier to navigate, much harder to create formula errors across sheets, and it forces you to think about layout clearly. Multi-sheet models are tempting but they multiply the opportunities for linking errors.
Test your model with extreme assumptions. Set revenue growth to negative 50%. Set margins to zero. If the model breaks or produces nonsensical outputs, something in the structure is wrong. A well-built model should be able to survive any set of inputs without producing circular errors or broken formulas.
Color-code consistently. Blue for hardcoded inputs, black for formulas, green for references to other sheets (if you have them). This convention is near-universal in professional finance and it makes auditing a model dramatically faster.
Supporting Schedules You May Also Need
Beyond the core PP&E and debt schedules, more detailed models sometimes include:
Tax schedule: Particularly important when deferred tax assets or liabilities are material, or when the company has net operating losses to carry forward.
Equity schedule: Tracks share count, share issuances, buybacks, and the equity section of the balance sheet in detail. Needed if you are modeling diluted EPS or running a DCF.
Working capital detail schedule: Breaks receivables, payables, and inventory out by business line or geography. Useful for companies with complex or seasonal working capital patterns.
Goodwill and intangibles schedule: Relevant for companies that have made acquisitions. Tracks the carrying value of intangible assets and amortization charges.
Scenario and Sensitivity Analysis
A model without scenarios is a model that only tells one story. Build in at least three: a base case, a downside, and an upside.
Scenario analysis works by toggling a set of key assumptions (revenue growth, margin structure, capex intensity) to reflect different views of the future. A clean way to implement this is with a scenario toggle cell linked to a lookup table that populates all assumption cells at once. This lets you switch between scenarios with a single input rather than changing dozens of cells by hand.
Sensitivity analysis is narrower. You pick one output (operating income, free cash flow, EPS) and observe how it changes as you vary one or two key drivers. A two-variable data table in Excel is the standard tool. Common applications: how does EBITDA change as revenue growth and gross margin vary? How does free cash flow change as capex and revenue vary?
Both types of analysis serve the same purpose: forcing you to confront the uncertainty in your assumptions honestly, rather than treating your base case as the only possible outcome.
3 Statement Model vs. DCF Model: How They Relate
A question that comes up often: what is the difference between a 3 statement model and a DCF model?
The 3 statement model is the foundation. It produces projected financial statements — particularly the free cash flow figures — that feed directly into a DCF valuation. The DCF then discounts those projected cash flows back to the present at the appropriate cost of capital to estimate intrinsic value.
You cannot build a credible DCF without first building a credible 3 statement model. Analysts who skip the three-statement work and jump straight to a DCF template are essentially plugging guesses into a formula and calling it analysis. The rigor of the 3 statement model is what gives the DCF its credibility.
The same relationship holds for LBO models (which need projected free cash flow to model debt paydown) and merger models (which need projected financials to calculate accretion/dilution).
Common Mistakes to Avoid
Hardcoding numbers inside formulas. If your formula reads = B12 * 0.32, the 0.32 is invisible and impossible to audit. Put that tax rate in an assumption cell and reference it.
Not checking that the balance sheet balances. This sounds obvious but many models are circulated with balance sheets that do not balance because the builder never verified it. Add a check cell.
Over-engineering the model. A model with 50 tabs and 200 line items that nobody can understand is not a better model. Precision should stop where it exceeds the quality of your underlying data and assumptions.
Using the same working capital days for every future year. Working capital efficiency tends to change as companies scale. Consider whether your DSO and DPO assumptions should evolve over the forecast period.
Ignoring seasonality for quarterly models. Annual models can smooth over patterns that matter a great deal in quarterly forecasting. If the business has a strong seasonal pattern, your quarterly assumptions need to reflect that.
Frequently Asked Questions
How many years should a 3 statement model cover?
For the historical period, three to five years is typical. For the forecast period, five years is standard for most corporate finance applications. Investment banking deal models sometimes extend to ten years, particularly for long-lived infrastructure or real estate assets.
Should I build the model in one worksheet or across multiple sheets?
One worksheet is strongly preferred for core financial models. Use grouping (rows and columns) to manage complexity and allow sections to be collapsed. Multi-sheet structures are acceptable for very large consolidations with many subsidiaries, but they introduce additional risk of formula errors between sheets.
How do I know if my 3 statement model is integrated correctly?
The balance sheet should balance (Assets = Liabilities + Equity) in every forecast period. The ending cash balance on the cash flow statement should match the cash balance on the balance sheet. If both are true and your retained earnings roll ties correctly to net income, your model is integrated.
What is the hardest part of building a 3 statement model?
For most people, it is the working capital linkages and understanding which direction the adjustments go on the cash flow statement. An increase in a current asset (like receivables) is a use of cash. An increase in a current liability (like payables) is a source of cash. Getting those signs right consistently is what trips people up most often.
Can I build a 3 statement model for a private company?
Yes, with two main differences. Private company financials are not publicly available, so you will need to work from management-provided statements. And private companies often lack the segment-level disclosure that public company filings contain, which can make assumptions harder to ground in data.
Conclusion
A well-built 3 statement financial model is not just a forecasting tool. It is a framework for thinking clearly about a business — how it generates revenue, where cash goes, what obligations it carries, and how much flexibility it has to invest in growth.
The technical steps matter, and this guide has covered them in detail. But the deeper skill is developing intuition for what the numbers mean. Why is operating cash flow so different from net income? What is driving that jump in receivables? Why did capex spike in year three? Those are the questions that separate a model-builder from a financial analyst. Build the model first. Then use it to ask better questions.
Need an investor-ready financial model without the headache of building it yourself? Oak Business Consultant specializes in bespoke 3-statement financial models, virtual CFO support, and strategic fundraising documentation tailored to your business. Let our experts turn your financial complexity into clarity. Contact us now to schedule your free consultation.