The 15 Most Significant Customer Success Metrics for SaaS Companies
15 customer success metrics that actually predict churn
Most SaaS teams track NPS and call it a day. Then a quarter of renewals falls through and nobody saw it coming, because a single satisfaction score can’t tell you whether your revenue base is actually growing or quietly eroding underneath a few big upsells. Real customer success measurement means tracking satisfaction, retention, revenue, and usage together, since each one exposes a different failure mode the others miss. This guide walks through the 15 metrics that matter most, the formulas behind them, and which ones deserve the most attention depending on your company’s stage.
Why satisfaction scores alone miss the real risk
A customer can rate you 9 out of 10 on a survey and still cancel next quarter. Satisfaction measures how someone feels in the moment; it says nothing about whether they’re actually using the product, whether your revenue from them is growing or shrinking, or whether the one person who championed the deal internally just changed jobs. Companies that only watch NPS get blindsided because none of the metrics that would have warned them, usage decline, contraction, a lost point of contact, ever entered the picture.
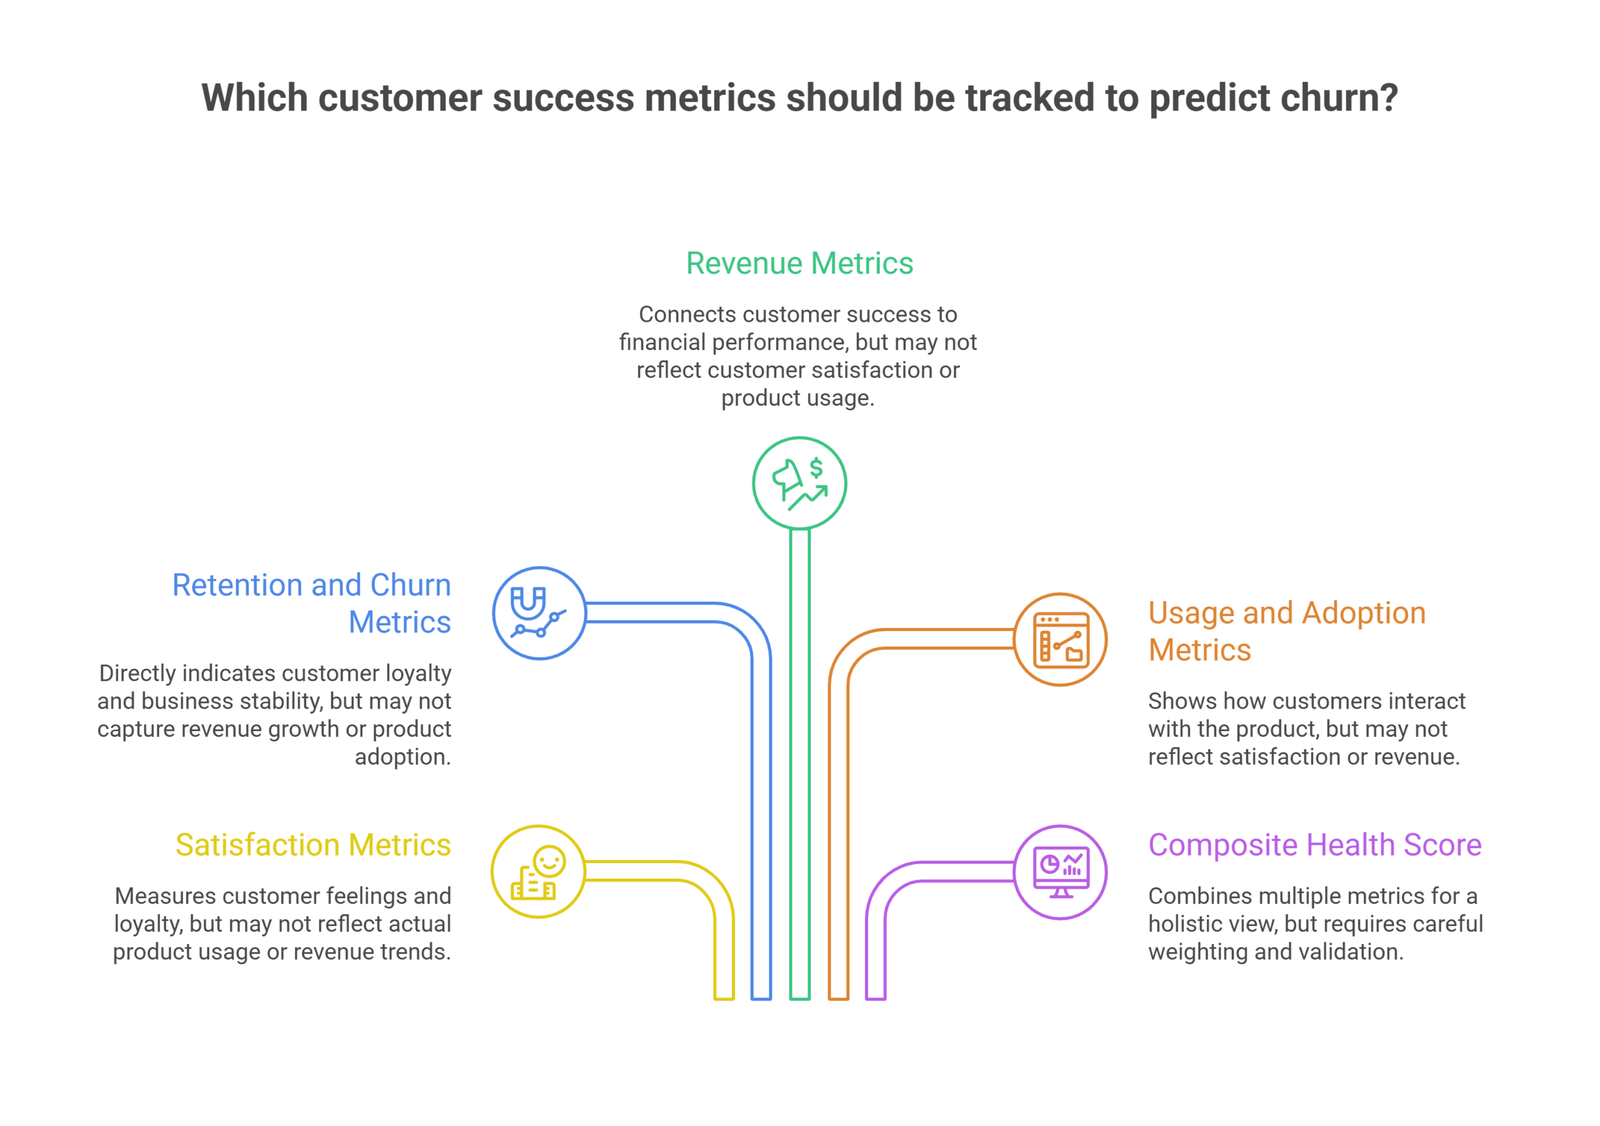
The fix isn’t more surveys. It’s tracking across four categories: satisfaction, retention and revenue, usage and adoption, and a composite health score that ties the other three together.
Satisfaction metrics
1. Net Promoter Score (NPS)
NPS measures loyalty by asking customers how likely they are to recommend you, on a scale of 0 to 10. Respondents split into Detractors (0-6), Passives (7-8), and Promoters (9-10).
Formula: NPS = % Promoters − % Detractors
Example: Survey 200 customers. 120 are Promoters (60%), 40 are Passives (20%), 40 are Detractors (20%). NPS = 60 − 20 = 40.
An NPS above 30 is solid for B2B SaaS; above 50 is excellent. The trend line matters more than any single reading, since a declining NPS often shows up a quarter or two before churn does.
2. Customer Satisfaction Score (CSAT)
CSAT captures satisfaction with a specific interaction rather than the overall relationship, typically a 1-5 rating right after a support ticket, onboarding step, or feature release.
Formula: CSAT = (Satisfied responses ÷ Total responses) × 100
Example: 150 post-onboarding responses, 120 rate it 4 or 5. CSAT = (120 ÷ 150) × 100 = 80%.
Above 75% is acceptable for SaaS; above 85% is strong. A touchpoint scoring below 70% is worth investigating on its own.
3. Customer Effort Score (CES)
CES measures how much work it takes a customer to get something done, usually rated 1-7. Research on customer loyalty consistently finds that reducing friction moves the needle more than trying to delight customers with extras.
Formula: CES = Sum of all effort scores ÷ Number of responses
Example: 100 customers rate a task-completion flow, totaling 540 points. CES = 540 ÷ 100 = 5.4 out of 7.
Scores above 5 suggest a smooth experience; below 4 signals friction worth fixing in the product or onboarding flow.
Retention and churn metrics
4. Customer churn rate
The percentage of customers who cancel or don’t renew in a given period, and the most direct read on whether you’re actually losing the business you’ve won.
Formula: Churn rate = (Customers lost ÷ Customers at start of period) × 100
Example: Start the quarter with 500 customers, lose 25. Churn rate = (25 ÷ 500) × 100 = 5%.
For B2B SaaS with annual contracts, monthly churn under 1% (roughly 10-12% annualized) is a reasonable target; top performers keep annual churn under 5%.
5. Customer retention rate
The inverse of churn: how many customers you kept over a period, independent of contract structure.
Formula: Retention rate = ((Customers at end − New customers added) ÷ Customers at start) × 100
Example: Start the month with 1,000 customers, add 100, end with 1,050. Retention rate = ((1,050 − 100) ÷ 1,000) × 100 = 95%.
Annual retention above 90% is the target for most B2B SaaS; above 95% is strong.
6. Renewal rate
Distinct from retention, renewal rate tracks the specific percentage of contracts up for renewal that actually renewed, which matters most for companies running fixed-term subscriptions rather than month-to-month plans.
Formula: Renewal rate = (Contracts renewed ÷ Contracts up for renewal) × 100
Revenue metrics your CFO should be watching too
These are the numbers that connect customer success directly to the financial statements, and where a lot of SaaS companies underinvest relative to how much they matter.
7. Net Revenue Retention (NRR)
NRR tracks how much revenue you keep from existing customers once upgrades, downgrades, and cancellations are all factored in. It’s the single number that answers whether your existing base is growing or shrinking on its own, with no new sales involved.
Formula: NRR = ((Starting MRR + Expansion − Contraction − Churn) ÷ Starting MRR) × 100
Example: Starting MRR is $100,000. Upsells add $15,000, downgrades cost $5,000, churned revenue is $8,000. NRR = (($100,000 + $15,000 − $5,000 − $8,000) ÷ $100,000) × 100 = 102%.
NRR above 100% means the business grows without a single new logo. Above 110% is strong; above 120% tends to command higher valuations in fundraising conversations.
8. Gross Revenue Retention (GRR)
GRR strips out expansion revenue entirely, showing your revenue floor if every upsell stopped tomorrow. It’s a useful reality check against NRR, since a company can post 80% GRR and 120% NRR at the same time, meaning strong upsells are masking real churn underneath.
Formula: GRR = ((Starting MRR − Contraction − Churn) ÷ Starting MRR) × 100
GRR above 90% is healthy; it can never exceed 100% by definition. When a SaaS financial model separates GRR from NRR explicitly, gaps like this show up months before they’d otherwise surface in a board deck.
9. Customer Lifetime Value (CLV)
CLV estimates total revenue a customer generates over the full relationship, and it’s the number that tells you how much you can reasonably spend to acquire and keep that customer.
Formula: CLV = Average Revenue Per Account × Gross Margin % × (1 ÷ Churn Rate)
Example: ARPA is $500/month, gross margin is 80%, monthly churn is 3%. CLV = $500 × 0.80 × (1 ÷ 0.03) = $13,333.
A CLV-to-CAC ratio of 3:1 or higher is generally considered healthy. Below that, either acquisition costs too much or customers aren’t sticking around long enough to justify it.
10. Customer retention cost (CRC)
The total cost of keeping a customer, covering CS salaries, tools, and retention programs. Companies that obsess over acquisition cost while ignoring this number often don’t realize how much they’re spending to keep accounts that generate comparatively little.
Formula: CRC = Total retention costs ÷ Number of active customers
CRC should always be a small fraction of CLV. If it isn’t, that’s a conversation for the next financial analysis review, not something to notice a year later.
Usage and adoption metrics
11. Onboarding activation rate
The share of new customers who complete the critical milestones in onboarding, whether that’s connecting an integration, inviting teammates, or hitting a usage threshold.
Formula: Activation rate = (Customers completing key milestones ÷ Total new customers) × 100
Example: 80 new accounts onboarded in Q1, 56 complete all milestones within 30 days. Activation rate = (56 ÷ 80) × 100 = 70%.
Most SaaS teams target 60-80% activation in the first 30 days. Below 50% points to a fundamental onboarding problem, not a marginal one.
12. Time to value (TTV)
How long it takes a new customer to hit their first real “this was worth it” moment.
Formula: TTV = Average time from signup to first defined value event
There’s no universal benchmark since it depends entirely on product complexity, but the direction should always trend down. A rising TTV is an early warning that onboarding, product, or support needs attention.
13. Product adoption score
A composite of feature engagement, frequency, and depth into a single number showing how fully a customer has adopted the product. Daily logins mean little if a customer only ever touches one feature; a customer using five core features weekly is far more embedded.
Formula: Weighted sum of key feature-usage indicators, scaled to a common range
The specific weighting is unique to each product. What matters is choosing indicators that actually correlate with renewal, not just general activity.
14. Point of contact (POC) churn
Tracks how often your internal champion at an account leaves or changes roles, which is one of the more underrated churn risks in B2B SaaS. The account isn’t lost because of the product; it’s lost because the person who bought in walked out the door.
Formula: POC churn rate = (Accounts with a contact change ÷ Total accounts) × 100
Example: 45 of 500 accounts had a primary contact change in Q1. POC churn rate = (45 ÷ 500) × 100 = 9%.
Track this against actual churn. If a large share of churned accounts also had POC churn, the fix is multi-threading relationships rather than concentrating adoption in one person.
The composite metric that ties it together
15. Customer health score
A weighted score combining usage, satisfaction, support activity, and revenue trends into a single 0-100 number that flags which accounts are likely to renew, expand, or churn.
Formula: Health score = weighted sum of selected inputs, scaled to 0-100
Example: Weight product usage at 30%, NPS at 20%, support tickets at 15%, login frequency at 15%, and contract growth at 20%. A customer scoring 80 on usage, 70 on NPS, 90 on support, 60 on logins, and 85 on contract growth gets: (80×0.30) + (70×0.20) + (90×0.15) + (60×0.15) + (85×0.20) = 77.5.
A health score only earns its keep if it’s validated against what actually happens. If accounts scoring “healthy” still churn at the same rate as everyone else, the weighting is wrong and needs adjusting, not the scorecard concept itself.
All 15 metrics at a glance
| Metric | What it measures | Good benchmark |
| NPS | Loyalty and advocacy | 30+ for B2B SaaS |
| CSAT | Satisfaction at a touchpoint | 75%+ |
| CES | Ease of completing a task | 5+ on a 7-point scale |
| Churn rate | Customer loss rate | Under 1% monthly (B2B) |
| Retention rate | Customers kept | 90%+ annually |
| Renewal rate | Contracts renewed vs. up for renewal | Product and segment specific |
| NRR | Revenue retained plus expansion | 110%+ |
| GRR | Revenue retained, no expansion | 90%+ |
| CLV | Total revenue per customer | 3:1 CLV:CAC or better |
| CRC | Cost to retain a customer | Small fraction of CLV |
| Onboarding activation rate | New customers hitting key milestones | 60-80% in 30 days |
| Time to value | Speed to first real value | Trending down |
| Product adoption score | Depth of feature usage | Product specific |
| POC churn | Risk from champion turnover | Tracked against actual churn |
| Health score | Composite renewal/churn predictor | Validated against outcomes |
Which metrics to prioritize by stage
Early-stage SaaS companies get the most out of onboarding activation rate, time to value, and churn rate, since the priority is proving the product delivers value fast enough to justify the price. Growth-stage companies should weight NRR, GRR, and CLV more heavily, since investors and boards increasingly judge SaaS businesses on how efficiently the existing customer base expands rather than on new logo count alone. Trying to track all 15 with equal intensity from day one usually means none of them get acted on. Pick the handful that match where the business actually is.
Frequently Asked Questions
What are the three most important customer success metrics for a SaaS company?
NRR for revenue health, churn rate for customer health, and onboarding activation rate as the leading indicator of both. NPS and health score round out a strong core set once those three are in place.
How is net revenue retention different from gross revenue retention?
GRR only counts what you kept after churn and downgrades, and it can never exceed 100%. NRR adds expansion revenue on top, so it can exceed 100% and often does for healthy SaaS businesses. A wide gap between the two means upsells are covering for churn that would otherwise be visible.
What’s a good CLV to CAC ratio?
3:1 or better is the common benchmark. Below that, a company is either spending too much to acquire customers or not retaining them long enough for the economics to work.
Should a five-person startup track all 15 of these metrics?
No. A small team should focus on churn rate, onboarding activation rate, and time to value first, since those are the earliest and most actionable signals. Revenue-retention metrics like NRR and GRR become more useful once there’s a large enough existing customer base for expansion and contraction to be meaningful.
How often should these metrics be reviewed?
Usage and satisfaction metrics benefit from monthly review. Revenue metrics like NRR and GRR are usually reviewed monthly for internal tracking and quarterly for board or investor reporting, in line with however the SaaS CFO function structures its reporting cadence.
Can these metrics predict churn before it happens?
Yes, when the leading indicators (product adoption score, time to value, CES) are tracked alongside the lagging ones (churn rate, retention rate). Leading indicators move first; lagging indicators just confirm what already happened.
Conclusion
Tracking 15 metrics in a spreadsheet is one thing. Connecting NRR, GRR, and CLV to an actual financial model that shows what they mean for runway, valuation, and fundraising is another. That’s usually where the gap sits between a CS dashboard and a number a board actually trusts.
Talk to Oak’s SaaS finance team about building the financial model behind these metrics.