

How Financial Analysis Can Benefit Your Small Business
What Is Financial Analysis?
Financial analysis is the systematic process of evaluating a company’s financial statements, performance metrics, and economic data to determine its profitability, liquidity, solvency, and overall health. It turns raw numbers into decisions.
For a small business owner, financial analysis answers the questions that keep you up at night: Is my business actually profitable? Do I have enough cash to survive the next quarter? Am I growing efficiently? Can I service a new loan?
At its core, financial analysis involves three interconnected activities:
- Collecting financial data from statements, ledgers, and operational reports
- Interpreting that data using ratios, trends, and benchmarks
- Acting on the insights to inform strategy, secure funding, and improve operations
Financial analysis is performed by two groups of stakeholders. Internal analysis is conducted by management, accountants, and CFOs who have access to detailed internal records. External analysis relies on publicly available financial statements and is used by investors, lenders, and credit agencies to assess risk before committing capital.
The depth of your analysis — short-term or long-term — depends on the question being asked. Short-term analysis examines a company’s ability to meet immediate obligations (liquidity). Long-term analysis focuses on debt repayment capacity and structural sustainability (solvency).
Why Financial Analysis Matters for Your Business
Most small businesses fail not from a lack of revenue but from a lack of financial clarity. Understanding where your money comes from, where it goes, and whether the model is sustainable is the difference between scaling deliberately and collapsing under your own growth.
Here is why financial analysis is a non-negotiable discipline for any business that wants to last:
Informed Decision-Making
Every significant business decision — pricing, headcount, expansion, procurement — carries financial consequences. Without analysis, those decisions are guesswork. With it, you can calculate break-even points, model scenarios, and move with confidence. Our guide on financial modeling explores how structured financial models transform decision-making from reactive to strategic.
Fundraising and Investor Relations
Before a bank approves a loan or an investor writes a check, they perform their own financial analysis on your business. Your numbers tell a story. A well-structured balance sheet, a clean income statement, and a growing cash flow position signal credibility. A professionally prepared business plan backed by rigorous financial analysis is often the deciding factor in whether funding is secured.
Budgeting and Forecasting
Budgeting without prior financial analysis is shooting in the dark. By examining past revenue trends, cost behavior, and seasonal patterns, you can build budgets that are grounded in reality rather than ambition. Financial analysis also enables rolling forecasts — dynamic projections that update as new data comes in, allowing businesses to adapt before problems escalate.
Risk Identification
Financial ratios and trend analysis expose vulnerabilities before they become crises. A declining current ratio signals approaching liquidity stress. A widening gap between gross and net profit margins points to rising overhead costs. Catching these signals early gives management time to act. Our Virtual CFO Services provide exactly this kind of ongoing financial surveillance for growing businesses that are not yet ready for a full-time finance executive.
Performance Benchmarking
Analyzing your numbers in isolation only tells part of the story. Comparing your ratios against industry benchmarks reveals whether you are operating efficiently relative to competitors. A net profit margin of 8% might look healthy in isolation — but if your industry average is 18%, there is a problem worth diagnosing.
The Three Core Financial Statements
All financial analysis begins with three documents. Mastering how to read them is the foundation of financial literacy for any business owner.
1. The Income Statement (Profit & Loss Statement)
The income statement records revenue and expenses over a specific period — a month, quarter, or fiscal year. It tells you whether your business is profitable.
The fundamental structure is:
Revenue − Cost of Goods Sold (COGS) = Gross Profit
Gross Profit − Operating Expenses = Operating Profit (EBIT)
EBIT− Interest and Taxes = Net Profit
When you compare income statements across multiple periods, patterns emerge: revenue growth trajectories, cost creep, shrinking margins. A company running a loss is not automatically failing — early-stage businesses often sacrifice short-term profit for growth. But if the cost of sales consistently exceeds revenue with no improvement in sight, the business model requires urgent attention.
2. The Balance Sheet (Statement of Financial Position)
The balance sheet provides a snapshot of everything your business owns and owes at a specific point in time. The governing equation is:
Assets = Liabilities + Equity
Assets are split into current assets (cash, receivables, inventory — convertible within 12 months) and non-current assets (property, equipment, intangibles). Liabilities follow the same split: current liabilities due within a year and long-term debt.
Equity — what is left after all liabilities are subtracted from assets — represents the owners’ stake in the business and accumulates retained earnings over time.
Investors and lenders study the balance sheet closely because it reveals capital structure, debt exposure, and asset quality. To understand how to structure this document for investor readiness, explore our guide on the pro forma balance sheet.
3. The Cash Flow Statement
The cash flow statement tracks the actual movement of cash into and out of the business. It is arguably the most important document for operational survival — because profitable businesses can, and regularly do, run out of cash.
The statement is divided into three sections:
Operating Activities — Cash generated from day-to-day business operations. Positive operating cash flow means the core business produces cash. Negative operating cash flow means the business is burning cash on operations and must borrow or raise equity to stay solvent.
Investing Activities — Cash spent or received from buying and selling assets. A negative investing cash flow often signals healthy reinvestment: purchasing new equipment, expanding facilities, or acquiring technology. It is only a red flag when the underlying business is not generating enough operating cash to support it.
Financing Activities — Cash flows related to debt, equity, and dividends. Taking on a new loan or issuing shares creates positive financing cash flow. Repaying debt or buying back shares creates negative cash flow from financing.
Our article on cash vs. profit breaks down exactly why a profitable business can collapse without cash — a distinction every business owner must internalize.
Types of Financial Analysis
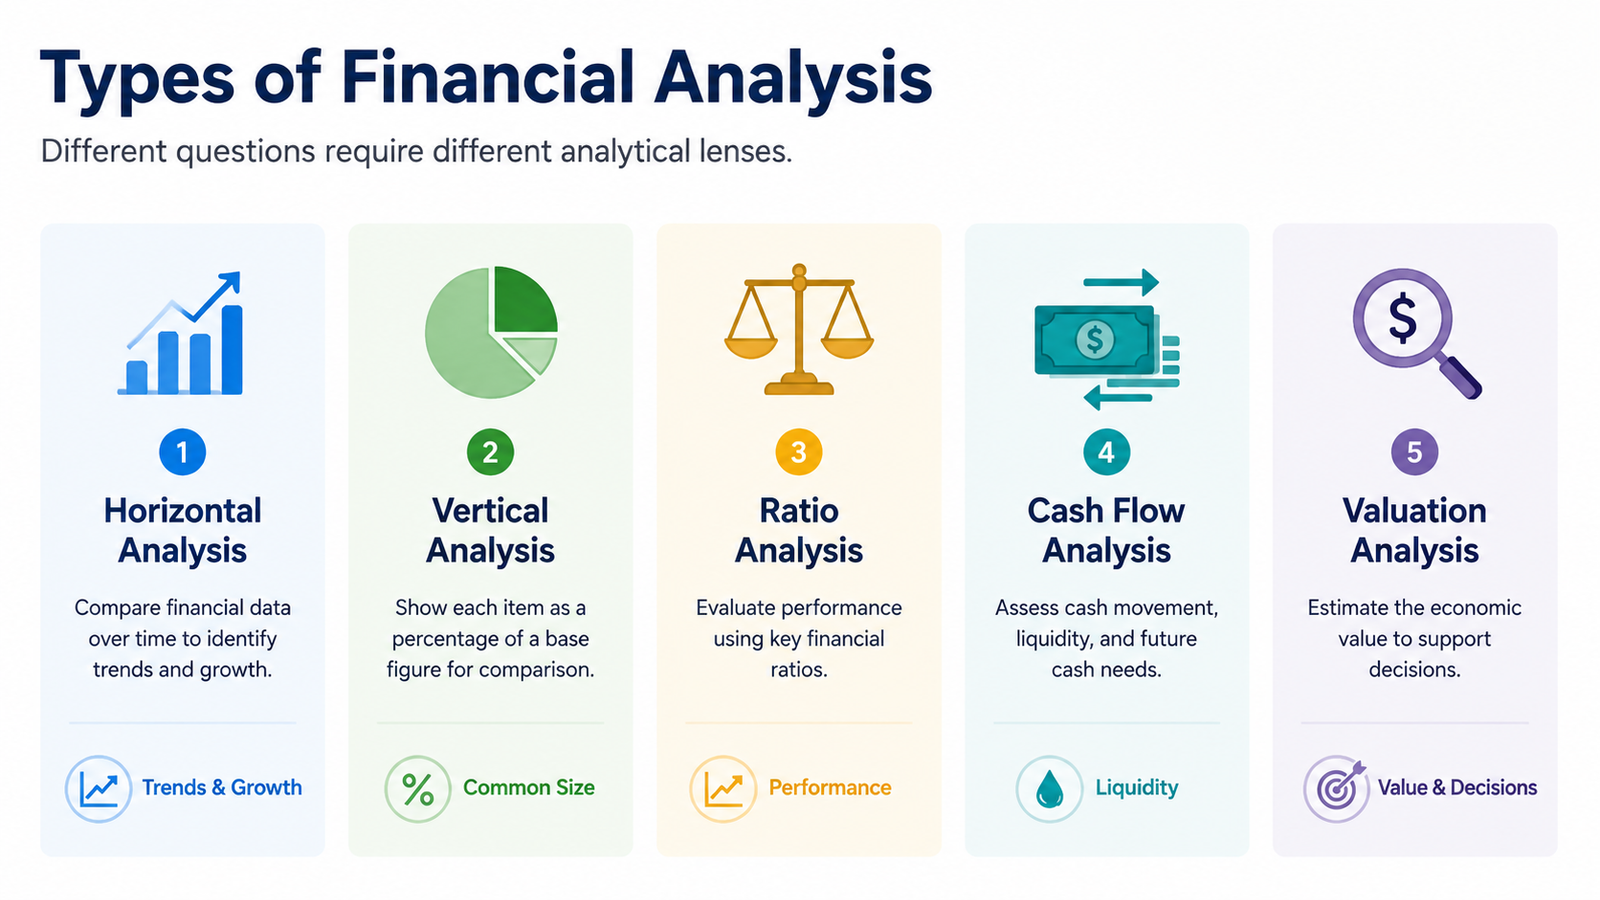
There is no single method for analyzing financial data. Different questions require different analytical lenses.
Horizontal Analysis (Trend Analysis)
Horizontal analysis compares financial data across multiple periods to identify trends and growth patterns. You calculate the percentage change in key line items — revenue, expenses, gross profit, net income — year over year.
Example: If your revenue was $500,000 in Year 1 and $620,000 in Year 2, horizontal analysis reveals a 24% growth rate. But if your operating expenses grew by 38% over the same period, the trend signals cost expansion outpacing revenue — a warning worth addressing immediately.
This method is particularly powerful for spotting inflection points: the year costs began creeping up, the period when growth stalled, or the quarter when receivables started ballooning.
Vertical Analysis (Common-Size Analysis)
Vertical analysis expresses each line item in a financial statement as a percentage of a base figure — typically total revenue for the income statement or total assets for the balance sheet. This normalizes the data, making it possible to compare businesses of wildly different sizes on equal terms.
Example: If your COGS is $300,000 and revenue is $600,000, your COGS percentage is 50%. Comparing this against an industry benchmark of 35% reveals a significant cost problem regardless of the absolute dollar amounts.
Ratio Analysis
Ratio analysis extracts relationships between different financial statement items to measure performance across four key dimensions: profitability, liquidity, solvency, and efficiency. We cover the most critical ratios in detail in the next section.
Cash Flow Analysis
Cash flow analysis examines the timing, magnitude, and sustainability of cash generation. It goes beyond the cash flow statement to model future cash requirements, stress-test liquidity positions, and identify funding gaps before they materialize.
Valuation Analysis
Valuation analysis determines what a business is worth. Methods include Discounted Cash Flow (DCF), which estimates the present value of future cash flows; comparable company analysis, which benchmarks the business against similar firms; and asset-based valuation, which values the net assets directly.
Our NPV Calculator is a practical tool for applying discounted cash flow logic to your investment decisions. For a deeper look at how NPV integrates with broader financial modeling, see our article on the importance of NPV for financial models.
Scenario and Sensitivity Analysis
Scenario analysis models multiple possible futures — base, bull, and bear cases — to understand the range of outcomes under different assumptions. Sensitivity analysis takes this further by isolating individual variables (price, volume, cost) and measuring their individual impact on outcomes.
These techniques are essential for strategic planning and investor presentations. They demonstrate that management has thought rigorously about risk and has contingency plans in place.
Descriptive, Diagnostic, Predictive, and Prescriptive Analysis
Modern financial analysis increasingly maps to a four-stage analytical framework:
| Stage | Question Answered | Example |
| Descriptive | What happened? | Revenue declined 12% in Q3 |
| Diagnostic | Why did it happen? | Customer churn spiked in the mid-market segment |
| Predictive | What will happen? | Churn will continue unless pricing is adjusted |
| Prescriptive | What should we do? | Introduce a retention discount tier for at-risk accounts |
Most traditional financial reporting stops at descriptive. Best-in-class financial analysis reaches prescriptive recommendations that directly inform business action.
Key Financial Ratios Every Business Owner Must Know
Ratios are the vocabulary of financial analysis. No single ratio tells the full story — the power comes from reading them together, tracking them over time, and comparing them against industry benchmarks.
Profitability Ratios
Gross Profit Margin
Gross Profit Margin = (Gross Profit ÷ Revenue) × 100
Measures the percentage of revenue retained after covering the direct cost of goods or services sold. A declining gross margin signals either pricing pressure or rising input costs.
Net Profit Margin
Net Profit Margin = (Net Profit ÷ Revenue) × 100
Measures what percentage of every dollar of revenue ultimately becomes profit after all expenses, interest, and taxes. This is the clearest indicator of overall operational efficiency.
Return on Equity (ROE)
ROE = (Net Income ÷ Shareholders’ Equity) × 100
Measures how effectively the business generates profit from shareholder investment. A high and growing ROE signals strong management performance.
Return on Assets (ROA)
ROA = (Net Income ÷ Total Assets) × 100
Measures how efficiently a company uses its assets to generate profit. Capital-intensive industries will naturally have lower ROA than service businesses.
Liquidity Ratios
Current Ratio
Current Ratio = Current Assets ÷ Current Liabilities
The most widely used liquidity measure. A ratio above 1.0 means the business can cover its short-term obligations. A ratio below 1.0 is a red flag. Additionally, a ratio consistently declining over time demands immediate management attention — even if the business is profitable.
Quick Ratio (Acid-Test Ratio)
Quick Ratio = (Current Assets − Inventory) ÷ Current Liabilities
A more conservative liquidity measure that excludes inventory, which may not be quickly convertible to cash. If the quick ratio is significantly lower than the current ratio, the business is heavily inventory-dependent — a risk if sales slow unexpectedly.
Cash Ratio
Cash Ratio = (Cash + Cash Equivalents) ÷ Current Liabilities
The most conservative liquidity ratio. Lenders use it to assess worst-case survival capacity.
Solvency Ratios
Debt-to-Equity Ratio
Debt-to-Equity = Total Liabilities ÷ Shareholders’ Equity
Measures the proportion of financing coming from creditors versus owners. Higher ratios indicate greater financial risk. The acceptable threshold varies by industry — capital-intensive sectors typically carry higher ratios than service businesses.
Interest Coverage Ratio
Interest Coverage = EBIT ÷ Interest Expense
Measures how comfortably the business can service its debt from operating profit. A ratio below 1.5 is a serious warning sign. Lenders typically require a minimum of 2.0x before approving credit.
Efficiency Ratios
Accounts Receivable Turnover
AR Turnover = Net Credit Sales ÷ Average Accounts Receivable
Measures how quickly the business collects payment from customers. A low ratio points to collection problems that can strangle cash flow even in a profitable business.
Inventory Turnover
Inventory Turnover = COGS ÷ Average Inventory
Measures how many times inventory is sold and replaced in a period. Low turnover signals overstocking or slowing demand. High turnover signals strong sales velocity — but also potential stockout risk.
Days Sales Outstanding (DSO)
DSO = (Accounts Receivable ÷ Revenue) × Number of Days
The average number of days it takes to collect payment after a sale. Shorter is better. A rising DSO is an early warning signal for cash flow stress. For a deeper look at the relationship between accounting and bookkeeping accuracy and these ratios, see our comparison guide.
Step-by-Step: How to Conduct a Financial Analysis
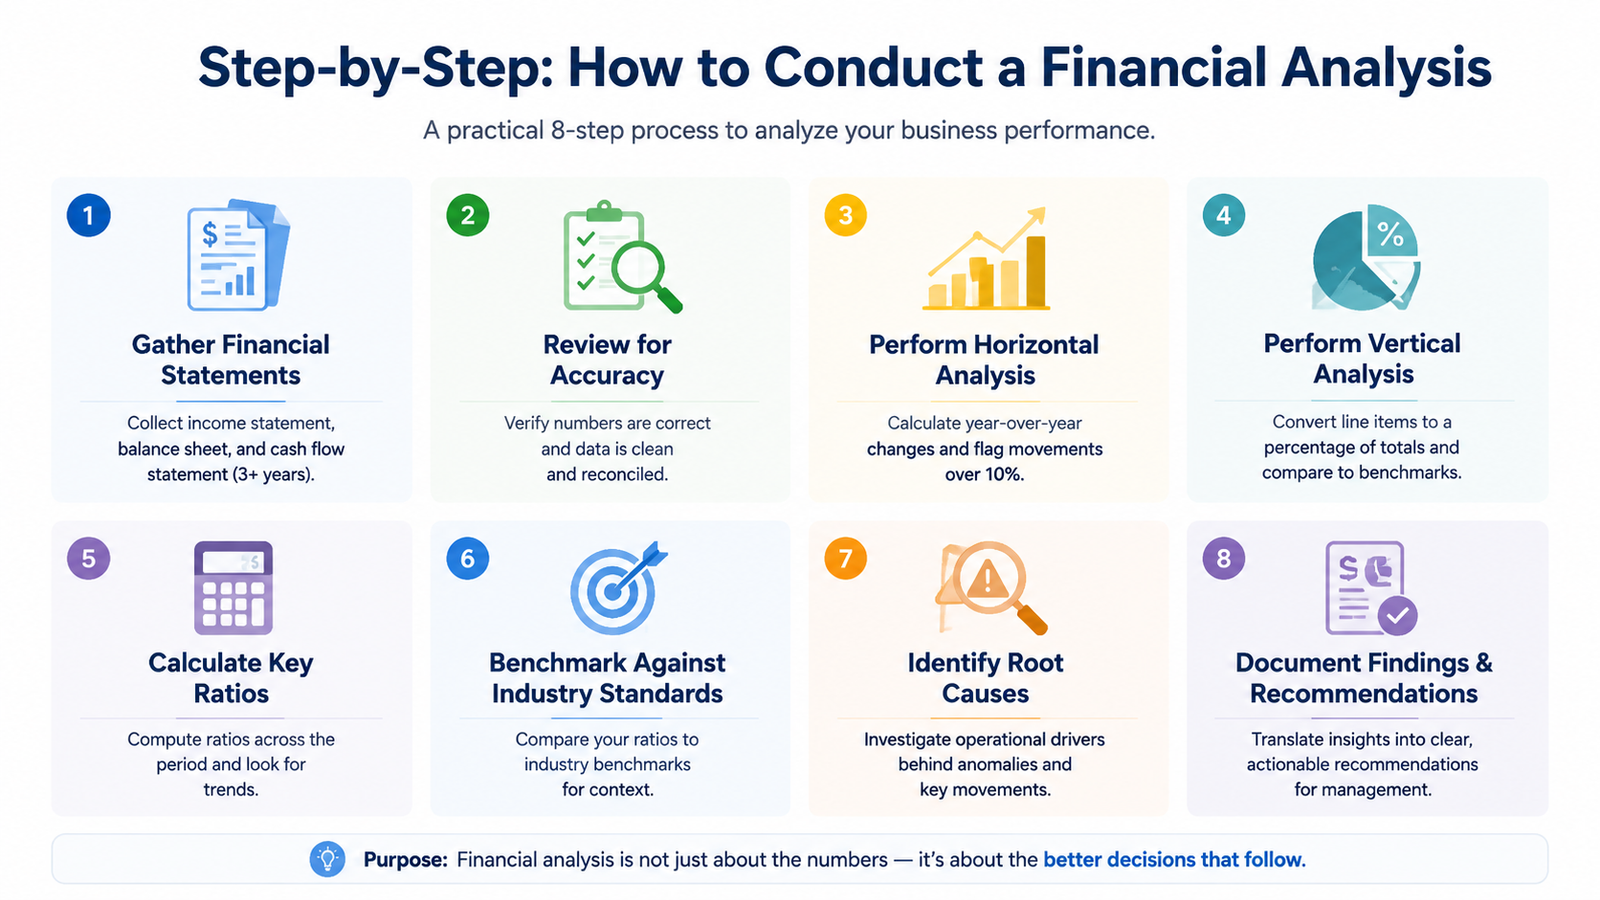
Here is the practical process for conducting a thorough financial analysis of your business:
Step 1: Gather Your Financial Statements Collect your income statement, balance sheet, and cash flow statement for at least the last three fiscal years. Ensure they have been prepared consistently — changing accounting methods mid-stream distorts trend analysis.
Step 2: Review for Accuracy Before analyzing anything, verify that the numbers are correct. Errors in the ledger produce misleading ratios. Engage your accountant or bookkeeper to confirm the underlying data is clean and reconciled.
Step 3: Perform Horizontal Analysis Calculate year-over-year percentage changes for every major line item. Flag any movement greater than 10% for investigation.
Step 4: Perform Vertical Analysis Convert each line item to a percentage of total revenue (income statement) or total assets (balance sheet). Compare against industry averages.
Step 5: Calculate Key Ratios Compute all ratios across the full period. Look for directional trends — not just point-in-time values.
Step 6: Benchmark Against Industry Standards Source industry benchmarks from relevant trade associations, central bank data, or financial databases. Your ratios are only meaningful in context.
Step 7: Identify Root Causes Where you find anomalies — a margin decline, a spiking DSO, a deteriorating current ratio — investigate the operational drivers behind the number. The ratio identifies the symptom; the business tells you the diagnosis.
Step 8: Document Findings and Recommendations Translate your analysis into clear, actionable insights for management. The purpose of financial analysis is not the analysis itself — it is the decision that follows.
Financial Analysis Tools and Technology
The tools available for financial analysis have advanced significantly. What once required a team of accountants and multiple weeks can now be accomplished in hours with the right infrastructure.
Spreadsheet Models (Excel / Google Sheets) Still the workhorse of financial analysis for most SMEs. When properly structured with a clear inputs section, driver assumptions, and linked three-statement models, spreadsheets are powerful and flexible. Our library of financial model templates provides professionally built Excel models across dozens of industries.
Accounting Software (QuickBooks, Xero, Zoho Books) Modern cloud accounting platforms automatically generate financial statements and provide basic ratio reporting. They are the essential starting point for any business that takes financial management seriously.
Business Intelligence Platforms (Power BI, Tableau) For businesses with larger data sets or more complex reporting needs, BI platforms connect to accounting systems and produce interactive dashboards that make financial trends immediately visible.
AI-Powered Analytics Artificial intelligence is reshaping financial analysis — automating routine data extraction, flagging anomalies in real time, and enabling predictive modeling at scale. For businesses processing large transaction volumes, AI tools now significantly reduce the manual workload of financial analysis while improving accuracy.
Professional Advisory Services For many small and medium businesses, the most cost-effective solution is outsourcing financial analysis to specialists. A Fractional CFO provides the expertise of a senior financial executive — including rigorous financial analysis, strategic advisory, and investor-ready reporting — at a fraction of the cost of a full-time hire.
Common Financial Analysis Mistakes — and How to Avoid Them
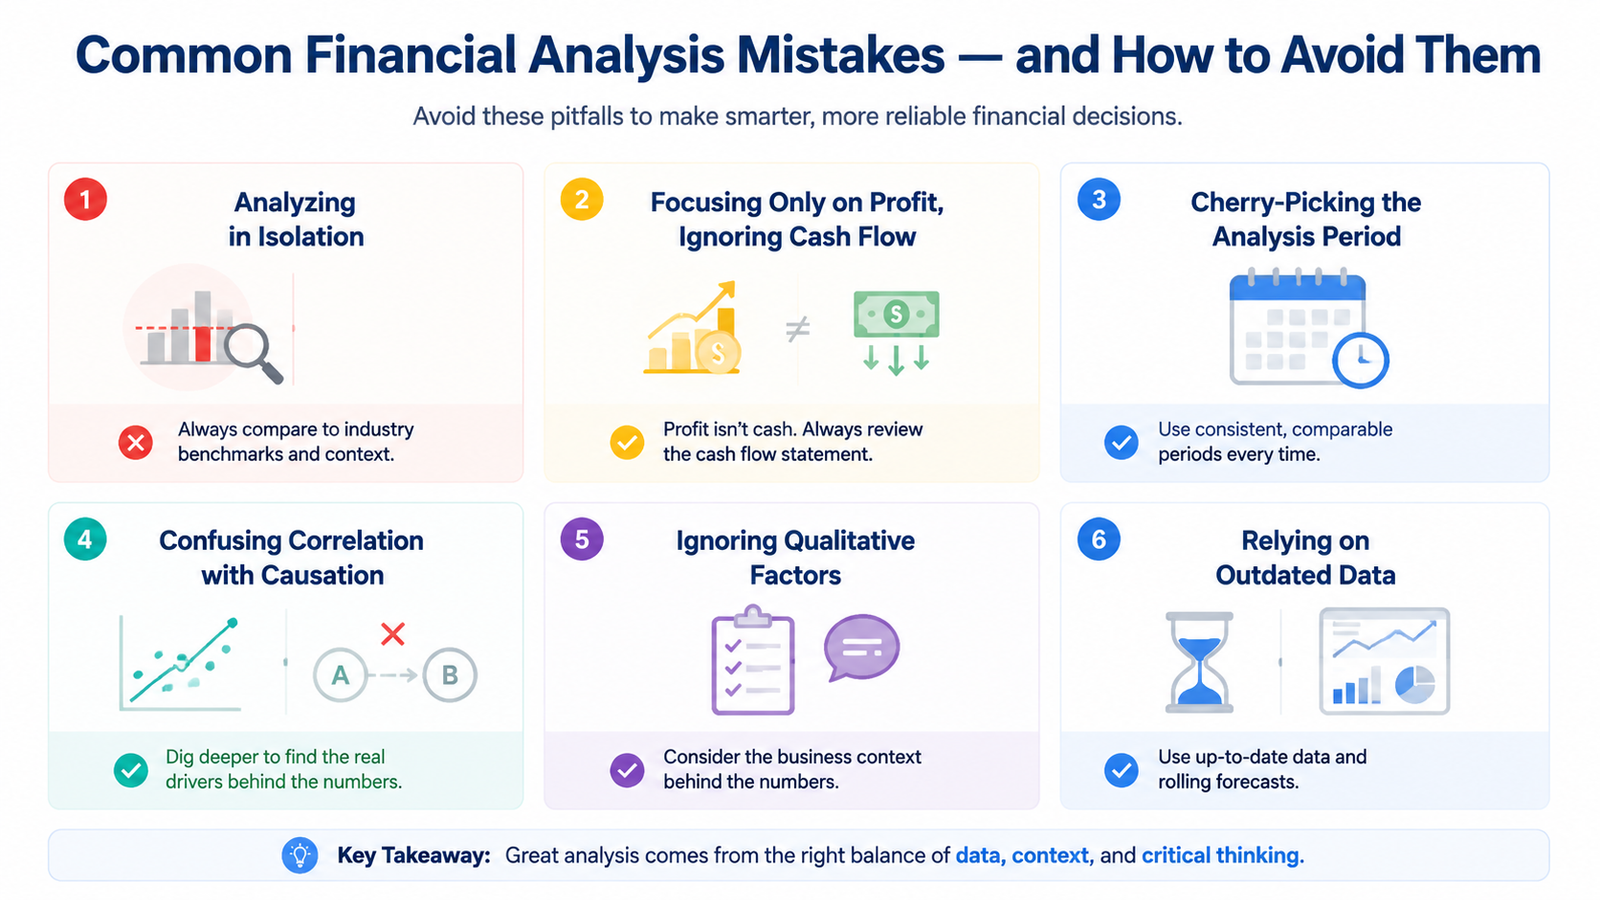
Even well-intentioned financial analysis can mislead if executed poorly. Here are the most common pitfalls:
Analyzing in Isolation A ratio without context is noise. A current ratio of 1.8 is healthy in retail but dangerously low in a construction business with long project cycles. Always benchmark against industry-specific norms.
Focusing Only on Profit, Ignoring Cash Flow Profitability and cash flow are not the same thing. A business can be highly profitable on paper while hemorrhaging cash due to slow-paying customers, high capital expenditure, or aggressive inventory buildup. The cash flow statement is not optional — it is essential. Our article on cash vs. profit explores this distinction in detail.
Cherry-Picking the Analysis Period Selecting start and end dates that make performance look better than it is misleads stakeholders and blinds management to real problems. Always use consistent, comparable periods.
Confusing Correlation with Causation Two metrics moving together does not mean one is causing the other. Root-cause analysis — understanding the operational drivers behind the numbers — is the discipline that separates expert financial analysis from data reporting.
Ignoring Qualitative Factors Numbers do not capture everything. A declining inventory ratio might look like inefficiency — but it could reflect a deliberate just-in-time supply chain strategy. Accountants and analysts must consider business context alongside quantitative data.
Relying on Outdated Data Financial analysis based on quarterly reports in a fast-moving environment is often too late to drive effective decisions. Businesses that implement monthly financial closes and rolling forecasts maintain a significant competitive advantage.
Frequently Asked Questions
How often should a small business conduct financial analysis?
At minimum, a small business should perform a full financial analysis quarterly. Businesses in high-growth phases, facing funding decisions, or operating in volatile markets benefit from monthly analysis. Annual analysis alone is insufficient for effective financial management.
Can financial analysis predict business failure?
Financial analysis cannot predict failure with certainty, but it can identify warning signs early — a declining current ratio, shrinking margins, negative operating cash flow, rising DSO — that give management time to intervene. Most business failures are preceded by months or years of deteriorating financial signals that went unnoticed or unaddressed.
What is the difference between horizontal and vertical analysis?
Horizontal analysis compares financial data across different time periods to identify trends (year-over-year change). Vertical analysis expresses each line item as a percentage of a base figure within a single period, enabling comparison across differently sized businesses or against industry benchmarks.
Do I need an accountant to conduct financial analysis?
Basic analysis can be done by a business owner with spreadsheet literacy and access to their accounting software. However, for investor-grade analysis, strategic decision-making, or fundraising preparation, professional expertise significantly improves the accuracy and credibility of the output.
What is sensitivity analysis and when is it used?
Sensitivity analysis tests how changes in key assumptions — revenue growth rate, cost of goods, interest rate — affect a financial outcome. It is most commonly used in financial modeling and investment appraisal to understand which variables have the greatest impact on profitability or valuation, and to stress-test projections before presenting them to investors or lenders.
Conclusion
Financial analysis is not a finance department luxury, it is a survival skill for every business owner. The businesses that scale deliberately, raise capital on favorable terms, and weather downturns without panic are almost always the ones that treat their numbers with the same seriousness they give their product or their customers.
The core takeaway is straightforward: your financial statements already contain the answers to most of your most pressing business questions. The income statement tells you whether your model is profitable. The balance sheet tells you whether it is structurally sound. The cash flow statement tells you whether it is survivable. Ratios and trend analysis tell you whether it is improving or deteriorating, and by how much.
None of this requires a finance degree. It requires discipline, consistency, and, when the stakes are high enough, professional support.
Whether you are running financial analysis for the first time, preparing for a funding round, or trying to understand why profits look strong but cash feels tight, the methodology in this guide gives you a starting framework. Apply it monthly. Benchmark it against your industry. Act on what it tells you.
Raw financial statements tell you what happened—but they won’t tell you how to fix your margins or clear a cash bottleneck. If your leadership team is tired of guessing the operational drivers behind a sudden cash crunch or a shrinking net profit line, let us do the heavy financial engineering. At Oak Business Consultant, we specialize in transforming disorganized ledger data into sophisticated three-statement models, diagnostic ratio deep-dives, and prescriptive growth roadmaps. Partner with our lead financial advisory team today to secure the boardroom-ready clarity and institutional oversight your business needs to scale safely. Schedule a free corporate financial analysis consultation.


