
Building a Financial Model Template
How to Build a Financial Model Template?

What Is a Financial Model Template?
A financial model template is a pre-structured spreadsheet framework designed to capture, organize, and project a company’s financial data. Rather than building a model from scratch every time, a template provides standardized layouts, predefined formulas, and a consistent structure that analysts, founders, and managers can populate with their own numbers.
Think of it as the architectural blueprint for your financial analysis. Just as a blueprint defines the structure of a building before any bricks are laid, a financial model template defines how revenue flows, how expenses are tracked, how debt is managed, and how cash moves through a business — before a single fiscal year begins.
Most templates are built in Microsoft Excel or Google Sheets. They center around a 3-statement financial model — an integrated trio of the income statement, balance sheet, and cash flow statement. When linked correctly, these three statements talk to each other: change your revenue assumption and watch the cash flow and balance sheet update in real time.
According to a 2024 survey by InsightSoftware, 78% of financial planners reported significant improvements in forecasting accuracy after switching from ad-hoc spreadsheets to structured financial model templates. The reason is simple: standardized frameworks reduce human error and force consistency across calculations.
Key insight: A financial model template is not just a spreadsheet. It is a strategic communication tool that translates business assumptions into quantifiable financial outcomes. If you want to see how this plays out in practice, our guide to building a powerful financial model breaks down the process from the ground up.
Why Every Business Needs a Financial Model Template
Without a template, financial modeling is chaotic. A well-designed financial model template eliminates that guesswork and delivers five core benefits:
- Standardization — Consistency across teams and reporting periods, ensuring financial data is presented and analyzed the same way every time.
- Efficiency — Building a model from scratch can take 20–40 hours. With a quality template, you cut that to 4–6 hours of customization.
- Accuracy — Linked cells and pre-built formulas replace hard-coded figures scattered across disconnected sheets, reducing manual errors significantly.
- Clarity — A common financial language that executives, investors, lenders, and board members can interpret without decoding a custom format.
- Investor Readiness — Businesses that use structured financial models are 2.3x more likely to secure venture funding than those with informal projections (PitchBook, 2023).
These benefits compound when paired with sound financial analysis practices, which help you interpret what the model is actually telling you about the business.
Types of Financial Models

Different business contexts call for different model types. Understanding which applies to your situation helps you choose or build the right template from the start.
Three-Statement Model The most foundational model type, integrating the income statement, balance sheet, and cash flow statement into a single interconnected framework. This is the backbone of most comprehensive financial model templates.
Discounted Cash Flow (DCF) Model Used primarily for company valuation. DCF models project future free cash flows and discount them back to their present value using a weighted average cost of capital. Investors and investment bankers use this model extensively to determine intrinsic value. Net present value calculations are central to this approach — see our breakdown of why NPV matters for financial models for more detail.
Startup Financial Model Tailored to early-stage companies that often lack historical data. These templates focus heavily on assumptions, burn rate, runway, and the path to profitability. Essential for seed and Series A fundraising, and often built alongside a pre-seed funding strategy.
Budget and Forecasting Model Forward-looking models used for annual budgeting, monthly reforecasting, and scenario planning. Finance teams use these to set targets, track performance against plan, and adjust resource allocation throughout the year.
Merger and Acquisition (M&A) Model Complex models that analyze the financial impact of acquiring another company. They incorporate accretion and dilution analysis, pro forma financial statements, and synergy assumptions.
Leveraged Buyout (LBO) Model Used in private equity to assess the feasibility and returns of acquiring a business using significant debt financing. LBO models stress-test a deal under various leverage scenarios and exit multiples.
Real Estate Financial Model Specialized templates evaluating property investments, development projects, and real estate portfolios. They incorporate net operating income, capitalization rates, loan-to-value ratios, and cash-on-cash returns — metrics you can explore further with our real estate investment ROI calculator.
Core Components of a Financial Model Template
A well-designed financial model template is composed of several interconnected sheets, each serving a distinct purpose.
1. Assumptions & Drivers Sheet
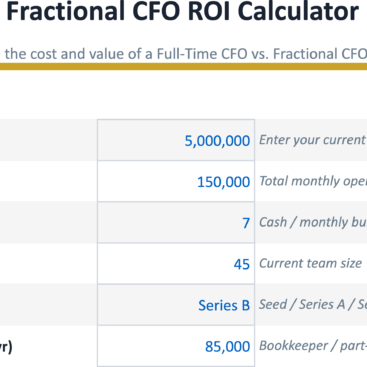
The assumptions sheet is the control center of any financial model. Every projection and output in the model flows from the inputs defined here. Common assumptions include:
- Revenue drivers (units sold, price per unit, customer growth rate)
- Cost structures (COGS percentage, operating expense categories)
- Headcount plans and compensation by department
- Working capital assumptions (receivable days, payable days, inventory days)
- Capital expenditure schedules
- Debt and financing terms
- Macroeconomic factors (interest rates, currency, inflation)
Golden rule: All assumptions live in one place. Never hard-code numbers into formulas on other sheets.
Best practices include color-coding input cells (blue for inputs, black for formulas), grouping assumptions by category, and including notes explaining the source of each assumption — whether industry benchmarks, historical averages, or management guidance.
2. Income Statement (Profit & Loss)
The income statement shows whether a business is profitable. It tracks all revenues generated and subtracts all costs incurred to arrive at net income or net loss for the period.
Key line items in a financial model template:
- Total revenue
- Cost of Goods Sold (COGS)
- Gross Profit and Gross Margin %
- Operating Expenses by category (Sales, Marketing, R&D, G&A)
- EBITDA
- Depreciation & Amortization
- EBIT (Operating Income)
- Interest Expense
- Income Before Tax
- Income Tax Expense
- Net Income
The income statement is also where critical ratios like gross margin, operating margin, and net margin are calculated — essential for benchmarking performance against industry peers. Tracking metrics like customer acquisition cost and lifetime value alongside these ratios gives a fuller picture of unit economics.
3. Balance Sheet
While the income statement shows performance over a period, the balance sheet provides a snapshot of the company’s financial position at a specific point in time. It follows the fundamental accounting equation:
Assets = Liabilities + Equity
| Section | Key Items |
| Current Assets | Cash, accounts receivable, inventory |
| Non-Current Assets | Property, plant & equipment, intangibles |
| Current Liabilities | Accounts payable, short-term debt |
| Long-Term Liabilities | Long-term loans, leases |
| Equity | Common stock, retained earnings |
In a three-statement model, the balance sheet is tightly linked to both the income statement and the cash flow statement. Net income flows into retained earnings; cash balances are driven by the cash flow statement. This interconnectedness is what makes the three-statement model the gold standard.
4. Cash Flow Statement
The cash flow statement is arguably the most important statement in the model because it tracks actual cash movements rather than accounting profits. A company can be profitable on paper while simultaneously running out of cash — a distinction explored further in our piece on cash vs. profit.
The cash flow statement is organized into three sections:
- Operating Activities — Cash generated or consumed by the core business, adjusted for non-cash items like depreciation and changes in working capital.
- Investing Activities — Cash used to purchase or generated from selling long-term assets and investments.
- Financing Activities — Cash flows related to debt borrowing or repayment, equity issuances, and dividend payments.
The ending cash balance on the cash flow statement must always equal the cash balance on the balance sheet. If these two figures do not reconcile, the model contains an error that must be corrected before it can be relied upon.
5. Revenue and Sales Forecast
Revenue forecasting is both the most important and most uncertain part of building a financial model. Build it bottom-up wherever possible — grounded in real drivers rather than top-level assumptions.
Different revenue models require different forecasting approaches:
| Business Type | Primary Drivers |
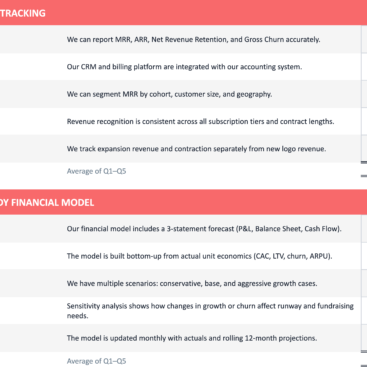
| Subscription (SaaS) | MRR, ARR, churn rate, net revenue retention |
| Transactional / E-commerce | Order volume, average order value, ROAS |
| Services | Billable hours, utilization rate, headcount |
| Product / Manufacturing | Units sold by SKU, pricing tier, capacity |
| Real Estate | Occupancy rate, rent per square foot, cap rate |
If your business runs on a subscription model, our overview of the SaaS business model covers the specific drivers that should anchor your revenue forecast.
Validate your revenue forecast using both approaches: top-down (total market × expected market share) and bottom-up (customers × price × purchase frequency). If both methods produce wildly different results, the assumptions need scrutiny — a useful cross-check is revisiting your TAM, SAM, and SOM sizing.
6. Supporting Schedules
Supporting schedules are supplementary worksheets that provide detailed calculations behind specific line items in the three main financial statements.
| Schedule | Purpose |
| Depreciation Schedule | Tracks useful life and annual depreciation of each fixed asset; feeds depreciation in the income statement and net book value on the balance sheet |
| Amortization Schedule | Details gradual reduction of intangible assets or debt; breaks out principal and interest components of each loan payment |
| Payroll Schedule | Itemizes headcount by department, role, and compensation tier; the primary driver of operating expenses for most service and technology businesses |
| Working Capital Schedule | Analyzes accounts receivable, inventory, and accounts payable using DSO, DIO, and DPO assumptions |
| Debt & Loan Schedule | Tracks each debt instrument, outstanding balance, interest rate, and repayment timeline |
| Operating Expense Schedule | Detailed breakdown of all operating costs by category for cost driver analysis and benchmarking |
7. Financial Analysis Tools
Beyond the core statements, a comprehensive financial model template includes analysis tools that help decision-makers interpret the numbers.
Break-Even Analysis Determines the revenue level at which total costs equal total revenues (zero profit). Calculated as: Fixed Costs ÷ Contribution Margin. Critical for startups and new product launches to identify the minimum sales volume needed before the business becomes self-sustaining.
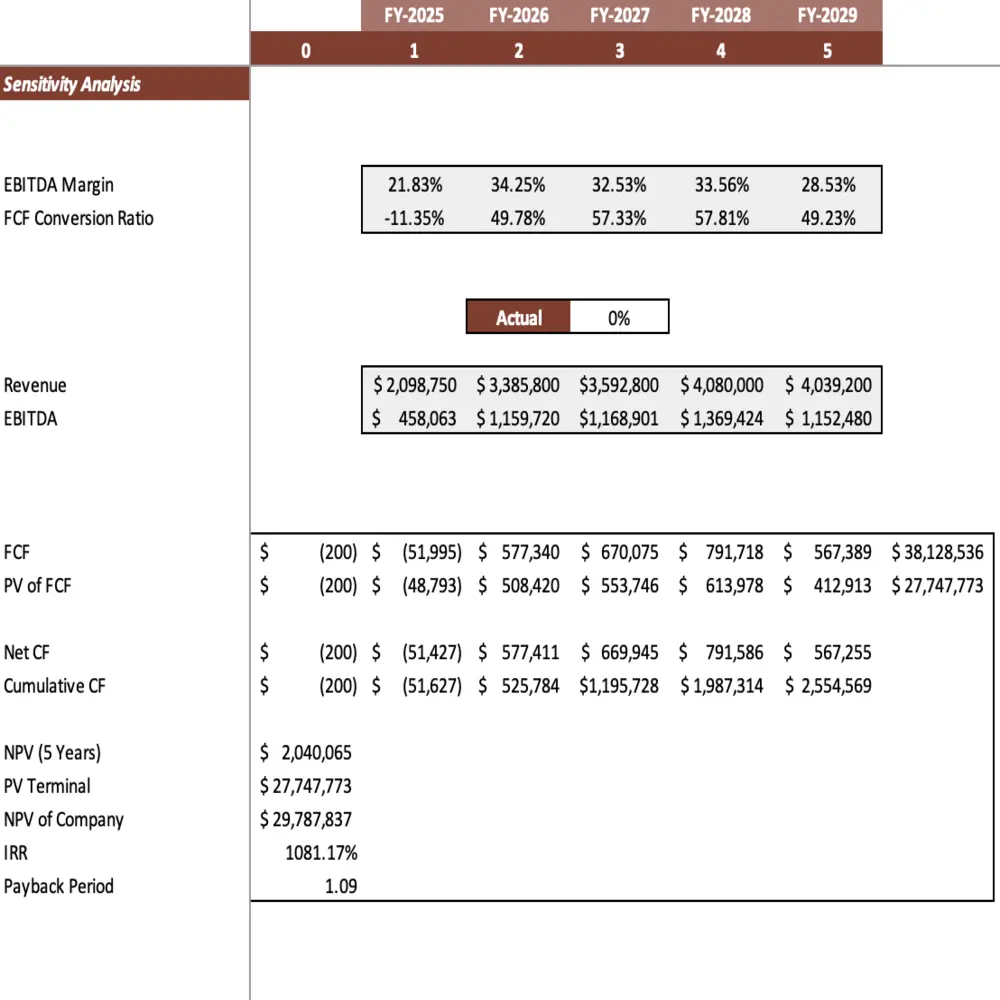
Sensitivity Analysis Tests how model outputs change when key assumptions are varied one at a time. A sensitivity table might show how net income changes as revenue growth rates range from 5% to 30%, or how free cash flow responds across a 10-percentage-point gross margin range. This identifies which assumptions have the greatest impact on outcomes.
Scenario Analysis Changes multiple variables simultaneously to model distinct business situations:
- Base Case — Most likely outcome
- Upside Case — Faster growth, lower churn, favorable market conditions
- Downside Case — Market downturn, rising input costs, slower customer acquisition
- Break-Even Case — Minimum viable performance
Where sensitivity analysis changes one variable at a time, scenario analysis changes multiple variables simultaneously to model an entire business environment. This kind of stress testing is covered in depth in our guide to stress test financial models and our piece on financial risk modeling.
Company Valuation Many templates include a valuation tab applying multiple methodologies: discounted cash flow (DCF), comparable company analysis (revenue or EBITDA multiples from public peers), and precedent transaction analysis. Triangulating across methods produces a more robust and defensible valuation range.
8. Financial Ratios and KPIs
| Category | Key Metrics |
| Profitability | Gross Margin, EBITDA Margin, Net Profit Margin, ROA, ROE |
| Liquidity | Current Ratio, Quick Ratio, Cash Ratio, Operating Cash Flow Ratio |
| Leverage | Debt to Equity, Interest Coverage, Net Debt to EBITDA |
| Efficiency | Asset Turnover, Inventory Turnover, DSO, DPO |
| Growth | Revenue Growth, Customer Growth, Gross Profit Growth |
| Valuation | EV/Revenue, EV/EBITDA, P/E Ratio, Price to Book |
9. Dashboard and Data Visualization
A well-designed executive dashboard consolidates the most important metrics and visuals onto a single sheet. Effective dashboards typically include:
- Revenue and EBITDA trend charts
- Waterfall charts showing year-over-year revenue bridges
- Margin evolution charts
- Cash balance and runway over time
- Headcount growth by department
- Scenario comparison visuals
The goal is to allow leadership and investors to grasp the financial story of the business in minutes — not hours spent reading through individual spreadsheet tabs. Waterfall charts in particular are worth understanding on their own; see our deep dive into the waterfall financial model.
10. Executive Summary
The executive summary is typically the first sheet a viewer encounters. It presents the most critical financial highlights in a concise, clean format: projected revenue at the end of the forecast period, gross and net margins, EBITDA, total capital required, the investment thesis, and key risks.
This sheet is particularly important in investor-facing models because it immediately answers: What does this business do? What are the financials? What is the opportunity? This is also where a strong one-page business plan and the financial model should align.
How to Build a Financial Model Template: 8-Step Framework

Step 1: Define the Model’s Purpose
Before touching Excel, answer one question: What decision will this model inform?
- Raising a Seed round? Focus on customer metrics and cash runway.
- Planning a new product launch? Model development costs and unit economics.
- Evaluating an acquisition? Build a merger model with synergy estimates.
Your purpose dictates the structure. A valuation model looks fundamentally different from an operational budget model.
Step 2: Gather Historical Data
Collect 2–3 years of historical financials if available: past income statements, balance sheets, cash flow statements, customer and revenue data by segment, headcount records, and marketing spend by channel.
No historical data? Early-stage startup financial model templates rely more heavily on industry benchmarks and bottom-up assumptions.
Step 3: Design the Structure
Create separate worksheet tabs for each component:
- Cover / Navigation — Table of contents with hyperlinks
- Assumptions — All inputs in one place
- Income Statement — P&L forecast
- Balance Sheet — Assets, liabilities, equity
- Cash Flow Statement — Operating, investing, financing
- Supporting Schedules — Revenue build, working capital, debt, PP&E
- Dashboard — Summary outputs and charts
Step 4: Apply Color-Coding Conventions
Industry-standard color coding makes your model readable and auditable:
| Color | Meaning | Example |
| Blue | Hard-coded input (user enters) | Revenue growth assumption |
| Black | Formula within the same sheet | Gross margin calculation |
| Green | Link from another sheet | Cash linked from cash flow statement |
| Red | Flag or error check | Balance sheet imbalance alert |
“Color-coding is not optional — it is a survival tool. When a model breaks at 2 AM before a board meeting, you will thank yourself for using blue inputs and black formulas.” — Aswath Damodaran, Professor of Finance, NYU Stern
Step 5: Build the Three Statements
Start with the income statement. Project revenue down to net income using your assumptions. Then build the balance sheet, linking retained earnings from the income statement. Finally, construct the cash flow statement using the indirect method.
The three statements must link dynamically:
- Net income → retained earnings on the balance sheet
- Depreciation on the income statement → PP&E schedule
- Changes in working capital on the balance sheet → cash flow from operations
- Cash from the cash flow statement → back to the balance sheet
Step 6: Add Error Checks
Build sanity checks throughout:
- Does the balance sheet balance? (Assets − Liabilities − Equity = 0)
- Does ending cash match the cash flow statement?
- Are financial ratios within reasonable industry ranges?
- Do revenue growth rates follow a logical progression?
Use conditional formatting to highlight errors in red automatically.
Step 7: Build Scenario Analysis
Static models are dangerous. Add scenario toggles (Base Case, Upside, Downside) that let users switch between full assumption sets instantly. Use Excel’s DATA TABLES or CHOOSE functions to drive scenario switching cleanly.
Step 8: Create the Dashboard
Design a one-page executive summary with key financial metrics, a 3–5 year summary table, and charts showing revenue growth, cash runway, and scenario comparisons. This is the first sheet investors will read.
The 7 Golden Rules of Financial Modeling
- One formula per row — Never combine multiple calculations in a single cell. Break complex logic into helper columns for auditability.
- No hard-coded numbers in formulas — Every number that could change belongs on the assumptions sheet.
- Never repeat calculations — Perform all calculations exactly once and link to that single source throughout the model.
- Keep it simple — A model too complex to audit is a model that cannot be trusted. If a formula requires more than two nested functions, break it down.
- Document everything — Include a Documentation tab explaining the model’s purpose, key assumptions, and version history.
- Build in error checks — Verify the balance sheet balances, cash reconciles, and no circular references exist.
- Review and update quarterly — A model is a living document. Stale models lead to stale decisions.
Common Financial Modeling Mistakes to Avoid
- Scattered hard-coded inputs — Hard-coding numbers throughout the model rather than centralizing on the assumptions sheet makes the model rigid and error-prone.
- Ignoring cash flow timing — Focusing solely on accrual-based income leads to models that show profitability while the business is actually cash constrained.
- Unrealistic revenue assumptions — Assuming fixed perpetual growth without grounding it in market size or competitive dynamics undermines credibility.
- Presenting only one scenario — A model with only a base case gives management and investors a false sense of certainty.
- Failing the balance sheet check — If assets don’t equal liabilities plus equity, there is a fundamental structural error. Full stop.
- Circular references — Avoid formulas that reference themselves. Use iterative calculation settings or algebraic solutions to break the circle.
- Poor formatting — Inconsistent fonts, no color coding, and hidden cells destroy credibility with investors.
Industry-Specific Considerations
| Industry | Key Focus Areas | Unique Metrics |
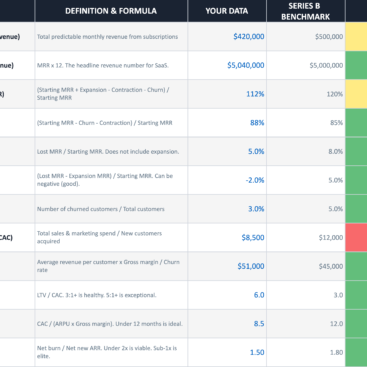
| SaaS | MRR, ARR, churn, CAC, LTV | Net Revenue Retention, Magic Number |
| E-commerce | Unit economics, inventory, ad spend | Gross Margin by SKU, ROAS |
| Real Estate | NOI, cap rate, debt service coverage | IRR, Equity Multiple, Cash-on-Cash |
| Manufacturing | Capacity utilization, raw material costs | Capacity Utilization %, BOM costs |
| Healthcare | Reimbursement rates, patient volume | AR Days, Payer Mix, Denial Rate |
| Retail | Same-store sales, inventory management | GMROI, Sell-Through Rate |
| Startups | Burn rate, runway, path to profitability | Months to Profitability, CAC Payback |
If you operate in a specialized industry, use a template designed for that sector. Generic templates miss the metrics that matter most to your investors — our restaurant financial model case study is a good example of how sector-specific drivers change the structure of a model.
Tools and Software
The vast majority of financial models are built in Microsoft Excel or Google Sheets. Excel remains the industry standard due to its computational power and wide adoption across corporate finance and investment banking. Google Sheets is increasingly used in startups and collaborative environments.
Beyond spreadsheets, purpose-built platforms such as Causal, Mosaic, and Jirav offer structured modeling environments with stronger version control, better team collaboration, and built-in visualization. For companies that have outgrown spreadsheet-based models, these platforms can significantly reduce maintenance burden while improving accuracy. Our roundup of the top financial modeling tools compares these options in detail, and AI is increasingly part of that toolkit, see how AI is transforming financial modeling.
Regardless of the tool, the fundamental principles remain: clear assumptions, interconnected statements, rigorous error checking, and outputs that drive actionable decisions.
Frequently Asked Questions
What is the difference between a financial model and a financial plan?
A financial plan outlines a company’s goals and the broad steps to achieve them. A financial model is the quantitative engine that translates those goals into detailed numerical projections.
How long should a financial model forecast period be?
Three to five years is the standard range. Shorter periods may miss the full investment cycle; projections beyond five years carry too much uncertainty to be meaningful.
What is the most important part of a financial model?
The assumptions sheet. Every output is only as reliable as the inputs feeding it. Spending time validating and pressure-testing assumptions is the single highest-value activity in the modeling process.
What is the best color coding for financial models?
Blue for hard-coded inputs, black for formulas within the same worksheet, green for links from other worksheets, and red for error checks or flags. This convention, widely used in investment banking, makes models readable and auditable.
What is the difference between sensitivity analysis and scenario analysis?
Sensitivity analysis changes one variable at a time to measure its individual impact on outputs. Scenario analysis changes multiple variables simultaneously to model a distinct business environment — such as a market downturn or an accelerated growth phase.
Should a startup build a financial model before it has revenue? Yes.
A financial model is especially valuable pre-revenue because it forces founders to articulate assumptions about customer acquisition, pricing, costs, and capital needs. Investors at every stage expect to see one.
How do I know if my financial model is correct?
The balance sheet must balance, the ending cash balance must match cash on the balance sheet, and assumptions should be benchmarked against industry data. Independent review by a second analyst is the most reliable validation method.
Conclusion
A financial model template is one of the most powerful tools available to business leaders, investors, and financial analysts. When built correctly, it serves as a dynamic representation of a business’s financial reality, a tool for testing assumptions, a foundation for fundraising, and a compass for strategic decision-making.
The core components, assumptions sheet, income statement, balance sheet, cash flow statement, supporting schedules, financial analysis tools, and visual dashboards, work together to create a complete picture of a company’s financial health and trajectory.
The best models are not the most complex ones. They are the ones that are clear, accurate, well-documented, and built to be updated regularly as new information becomes available.
Whether you are a startup founder preparing for your first investor meeting, a CFO reforecasting the annual budget, or an analyst evaluating a potential acquisition, a well-designed financial model template is the foundation upon which confident, data-driven decisions are made.
You can spend 40 hours fighting Excel formulas, or you can spend that time running your business. Financial modeling isn’t just about filling in boxes, it’s about mapping out your cash runway, building dynamic 3-statement integrations, and stress-testing your downside risks before they happen.
Let our expert financial architects handle the architecture. We build fully dynamic, tailored models that translate your business assumptions into clean, boardroom-ready strategies, without the spreadsheet headaches. Schedule a free consultation with our modeling team.
.


