Financial Modeling in Excel: A Comprehensive Guide
Mastering Financial Modeling in Excel: A Step-by-Step Practical Blueprint
Financial modeling is one of those skills that separates people who understand business on paper from people who can actually stress-test it. If you work in finance, run a company, or advise one, you will eventually need to build or interpret a financial model in Excel. And if you are doing it in a professional setting, that model is almost certainly going to live in Excel.
This guide covers everything from the basics of what a financial model actually is, to how you build one in Excel, what the different types are, and what separates a model that gets trusted from one that gets ignored.

What Is a Financial Model?
A financial model is a structured spreadsheet that represents the financial performance of a business, a project, or an investment. It takes in assumptions about the future and produces forecasts that help people make decisions, whether that is a decision about valuation, capital allocation, budget planning, or whether to go ahead with a merger.
The word “model” sometimes makes this sound more technical than it is. At its core, a financial model is just an organized set of assumptions and formulas that connect inputs to outputs in a logical, auditable way. The reason Excel dominates this space is that it is flexible enough to handle everything from a simple cash flow projection to a complex leveraged buyout analysis, and familiar enough that almost every finance professional already knows it.
What makes a model good is not how many tabs it has or how many formulas it uses. A good model is one that answers a specific question clearly, that someone else can audit without your help, and that can be updated quickly as assumptions change.
What Financial Models Are Actually Used For
Before you open Excel, it helps to know what problem you are trying to solve. Financial models serve different purposes depending on who is building them and why.
Investment bankers use models to value companies in M&A transactions, to evaluate whether a leveraged buyout makes sense, and to prepare pitch books for clients. Private equity firms build models to determine the maximum price they can pay for a business and still hit their return targets. FP&A teams inside companies build budget models and forecasting models to track performance against plan and to inform decisions about hiring, capital spending, and pricing.
Startup founders and early-stage businesses use financial models to project runway, to understand how changes in customer acquisition costs affect profitability, and to present credible financial plans to investors. Real estate developers build models to evaluate deals, project cash flows from properties, and understand their returns under different exit scenarios.
The common thread is that a model forces you to make your assumptions explicit and to see how those assumptions interact. That process alone often reveals things you would not have noticed otherwise.
The Core Building Blocks: The Three Financial Statements
Almost every financial model for a business, regardless of its purpose, is built on the three core financial statements. If you do not have a strong working knowledge of these, building a reliable model is very difficult.
Income Statement
The income statement shows revenues and expenses over a period of time and produces a bottom-line profit or loss figure. When you are forecasting an income statement, you are essentially making predictions about how much the business will sell, what it will cost to deliver that product or service, and what the overhead looks like. The net income figure from the income statement feeds into both the balance sheet and the cash flow statement.
Balance Sheet
The balance sheet is a snapshot of what the business owns, what it owes, and what is left over for shareholders at a specific point in time. Assets must always equal liabilities plus shareholders’ equity. This equation is not optional. If your model’s balance sheet does not balance, something is wrong. In practice, the balance sheet is where you track things like working capital, fixed assets, debt balances, and retained earnings. Changes in these items flow in from the income statement and cash flow statement.
Cash Flow Statement
The cash flow statement reconciles net income with actual cash movement. This is important because a business can be profitable on paper and still run out of cash, and the cash flow statement is what shows you the difference. It is divided into operating activities, investing activities, and financing activities. Operating cash flow adjusts net income for non-cash items like depreciation and for changes in working capital. Investing cash flow reflects capital expenditures and asset sales. Financing cash flow shows debt raised or repaid and equity issued or returned to shareholders.
When these three statements are fully integrated and linked together, any change you make to one assumption ripples through all three automatically. That integration is what people mean when they refer to a three-statement model, and it is the foundation for most of the more complex models built on top of it.
Types of Financial Models You Will Encounter
Not every financial question requires the same type of model. Here are the most common ones you will encounter in practice.
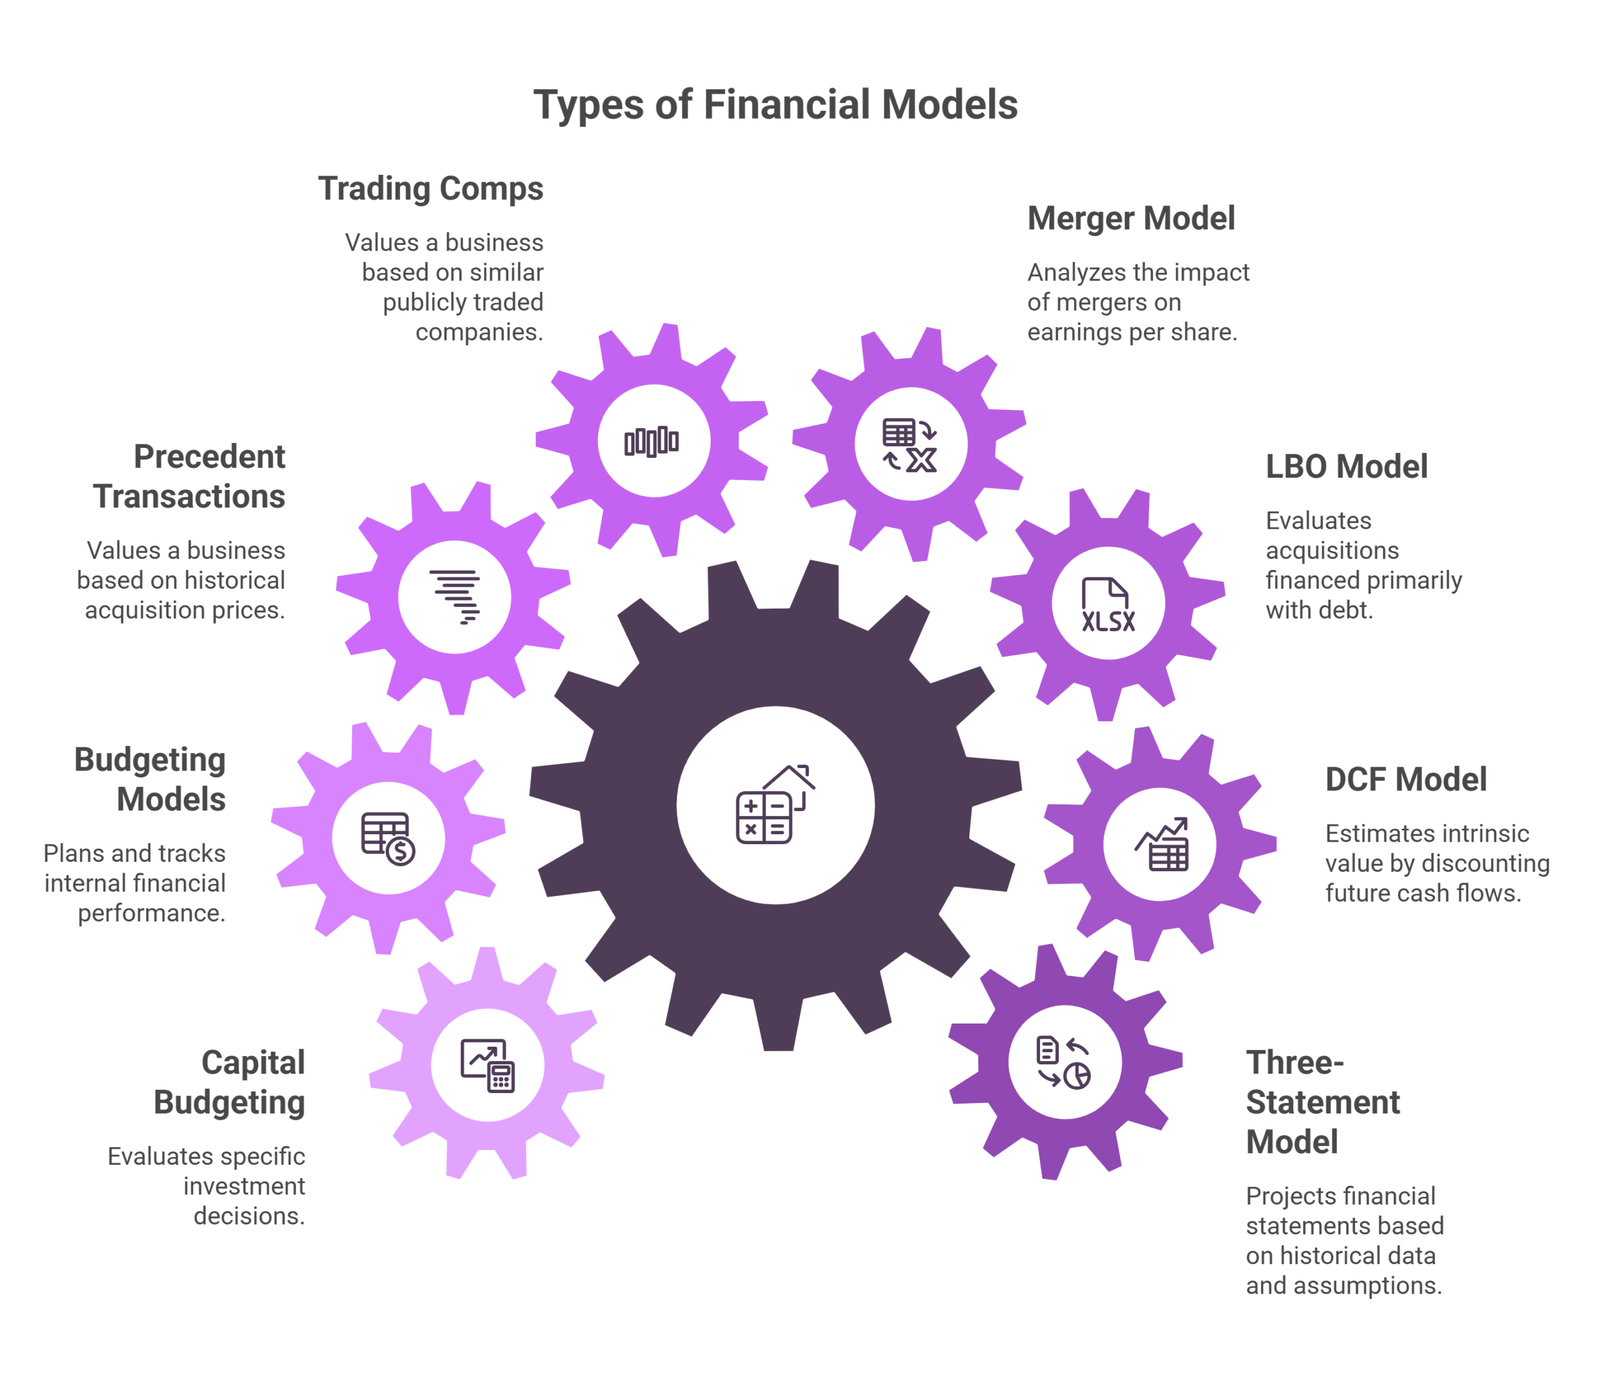
Three-Statement Model.
This is the starting point for most serious financial modeling. It projects the income statement, balance sheet, and cash flow statement forward using historical data, management guidance, and industry assumptions as inputs. Every other model type either builds on top of a three-statement model or borrows its logic.
Discounted Cash Flow (DCF) Model.
A DCF model estimates the intrinsic value of a business by projecting its future free cash flows and discounting them back to the present at an appropriate rate that reflects the risk of those cash flows. The discount rate is typically the weighted average cost of capital. The terminal value, which captures the value of cash flows beyond the explicit forecast period, often represents the majority of total value in a DCF, which is why the assumptions behind it deserve careful attention. A DCF is only as good as its assumptions, and small changes in the discount rate or the terminal growth rate can move the valuation significantly.
Leveraged Buyout (LBO) Model.
Private equity firms use LBO models to evaluate acquisitions that are financed primarily with debt. The model tests whether the business can generate enough cash to service that debt and still deliver an acceptable return to equity investors, typically over a holding period of three to seven years. The output is usually expressed as an internal rate of return and a multiple on invested capital. LBO models also serve as a way to establish a floor valuation, since the maximum price a financial buyer can pay is constrained by what the debt markets will support and the minimum return the fund will accept.
Merger Model (Accretion/Dilution Analysis).
When two companies combine, the acquiring company’s earnings per share can go up or down depending on how the deal is structured and what the target is worth relative to what was paid. An accretion/dilution analysis quantifies that impact. It is a standard deliverable in M&A advisory work and helps the acquirer and its board evaluate whether a deal creates or destroys value for shareholders in the near term.
Comparable Company Analysis (Trading Comps).
This is a relative valuation approach that estimates what a business is worth based on what similar publicly traded companies are trading for in the market. You gather valuation multiples like EV/EBITDA and Price/Earnings for a peer group, then apply those multiples to your target company’s metrics. It is faster to build than a DCF and anchored to observable market data, but it is also sensitive to how well you have defined the peer group and whether current market conditions are a reliable guide to value.
Precedent Transactions Model.
Similar to trading comps but looks at acquisition prices rather than trading prices. Because buyers typically pay a premium to acquire control of a business, transaction comps tend to produce higher valuations than trading comps. This model is useful for understanding what acquirers have historically been willing to pay for comparable businesses.
Budget and Forecasting Models.
These are operational models used internally by finance teams to plan the business, track performance, and update forward-looking projections. They tend to be more granular about the business’s specific revenue streams and cost structure than a valuation model would be, and they are updated more frequently.
Capital Budgeting Models.
Used to evaluate specific investment decisions, like whether to buy a piece of equipment, build a new facility, or launch a new product line. The key outputs are net present value, internal rate of return, and payback period. A positive NPV means the investment is expected to generate more value than it costs. IRR tells you the rate of return implied by the investment’s cash flows.
How to Build a Financial Model in Excel
The process of building a financial model from scratch follows a consistent structure regardless of the type of model. What changes is the complexity and the specific inputs and calculations involved.
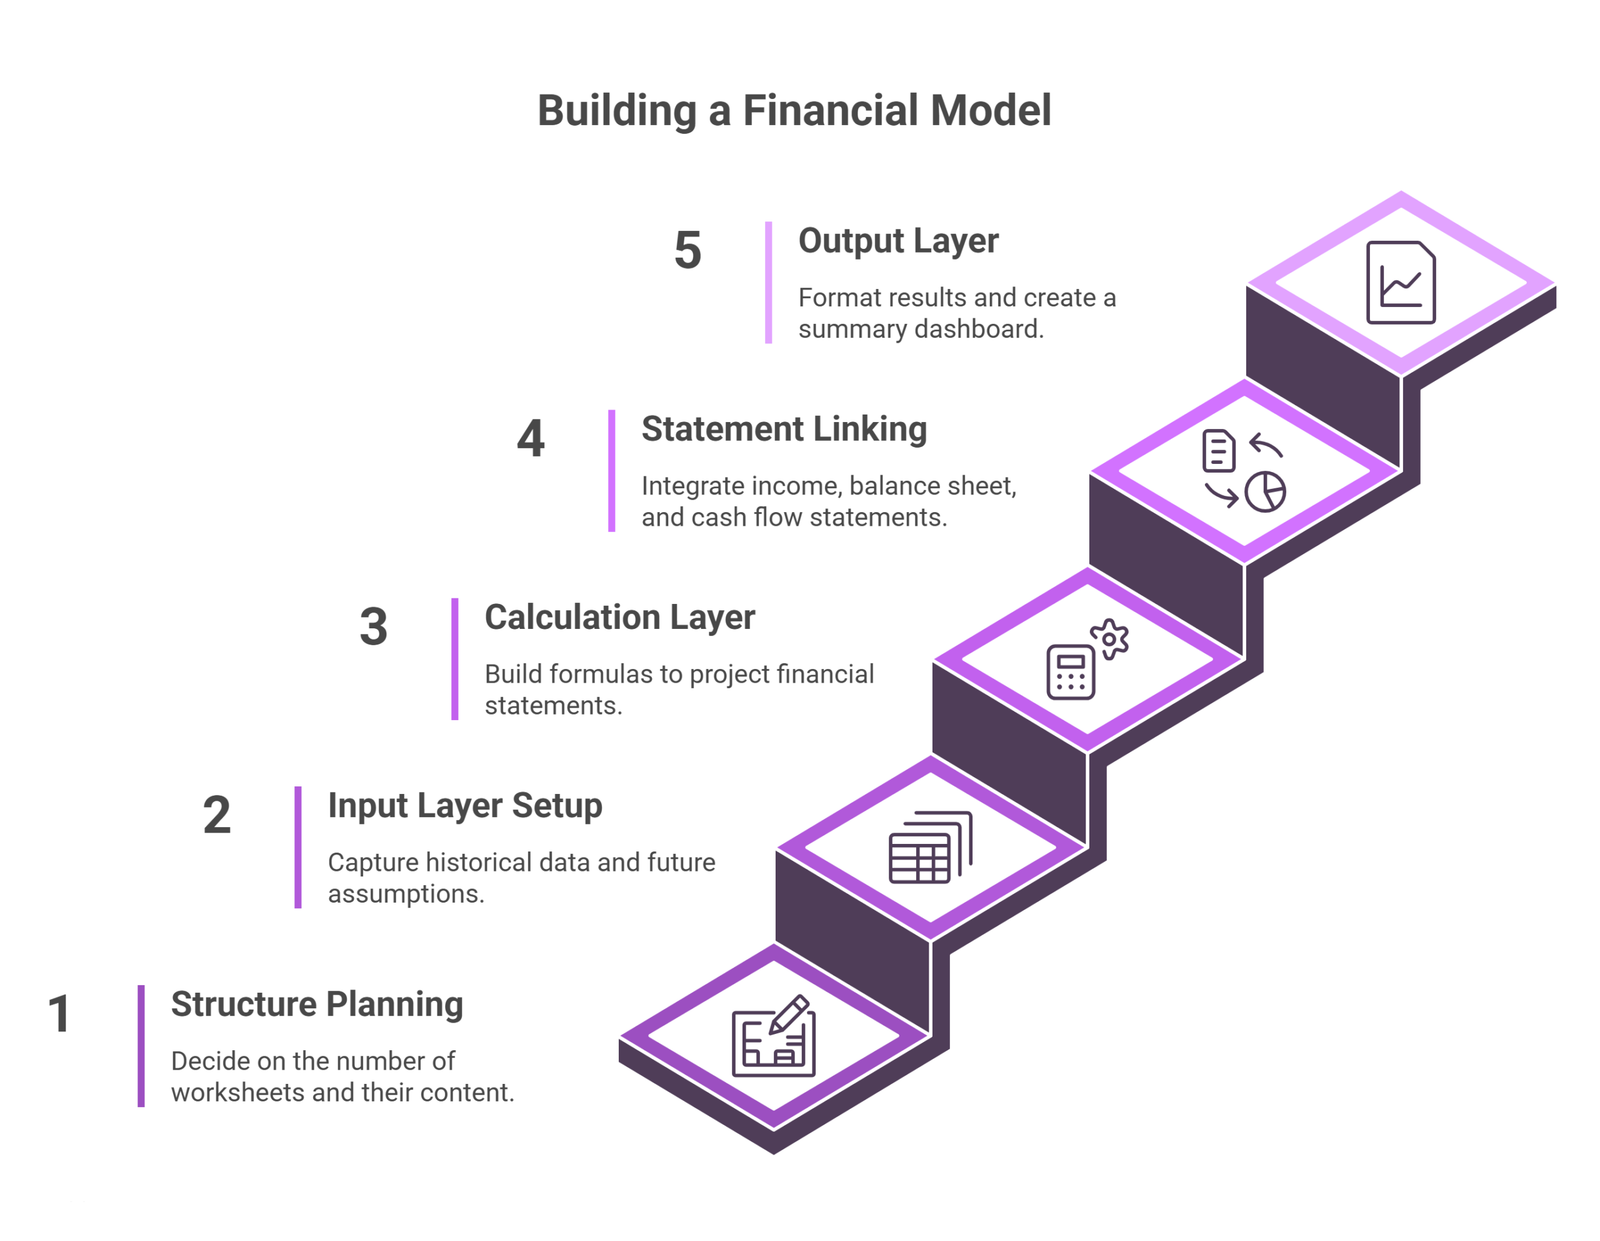
Start with the structure before you start with numbers.
Decide upfront how many worksheets you need, what each one will contain, and how information will flow between them. The standard structure separates inputs from calculations from outputs. Your inputs sheet contains all the hardcoded assumptions and historical data. Additionally, your calculation sheets contain the formulas that turn those inputs into projections. Your output sheets contain the formatted results, financial statements, and summary metrics that the model is designed to produce. If you skip this planning step, you will almost certainly end up with a model that is hard to audit, prone to errors, and painful to update.
Set up your input layer carefully.
This is where you capture historical financial data and where you enter your assumptions about the future. Think through every driver of the business. Revenue usually needs to be broken down by channel, product line, or customer segment depending on what is meaningful. You need assumptions for growth rates, pricing, volume, margins, headcount, capital spending, working capital, taxes, and interest rates. The more granular your inputs, the more defensible your model, but also the more maintenance it requires. Color-code your input cells in blue to distinguish them from formulas.
Build the calculation layer methodically.
This is where your formulas live. Every line item in your projected financial statements is driven by something, either an assumption from the input layer or a calculation based on other projected figures. Revenue is typically the starting point, since most cost items can be modeled as a percentage of revenue or as a fixed amount that grows with the business. Work through the income statement top to bottom, then build your supporting schedules for things like depreciation, working capital, debt, and taxes. These schedules feed into the balance sheet and cash flow statement. Check your work at each step rather than building everything and troubleshooting at the end.
Link the three statements together.
This is where integrated modeling gets its name. Net income from the income statement flows into retained earnings on the balance sheet and into operating activities on the cash flow statement. Depreciation calculated in your PP&E schedule flows into both the income statement and the cash flow statement. The ending cash balance on the cash flow statement equals cash on the balance sheet. When all of these links are correct, the model is self-consistent and the balance sheet will balance. If it does not balance, work backwards systematically to find the error.
Build the output layer last.
This is what people see when they open your model. Clean, well-formatted financial statements, a summary dashboard with key metrics, and any charts or visualizations that make the story clearer. The output layer should not contain any calculations. It should only contain formatted references to figures produced in the calculation layer.
Excel Techniques That Actually Matter for Financial Modeling
Excel has hundreds of functions, but financial modelers rely heavily on a relatively small subset of them. Knowing these well makes a significant difference.
INDEX/MATCH is more flexible than VLOOKUP for looking up data, since it can retrieve values from any column regardless of position. SUMIF and SUMPRODUCT are essential for aggregating data across categories. IFERROR catches calculation errors cleanly and prevents them from propagating through the model. MIN and MAX can often replace nested IF statements and make formulas much easier to audit. OFFSET is useful for building dynamic ranges, though it should be used sparingly because it recalculates every time the spreadsheet changes.
The roll-forward schedule structure, sometimes called BASE (Beginning plus Additions minus Subtractions equals Ending), is a standard way to model any balance sheet item that changes over time. You start with the opening balance, add any increases during the period, subtract any decreases, and the result is your closing balance. This structure is transparent, consistent, and easy to audit.
Avoid nested IF statements wherever possible. When you find yourself building an IF inside an IF inside another IF, there is almost always a cleaner solution. In many cases, using Boolean logic with TRUE and FALSE values acting as ones and zeros is more elegant and less prone to error. Flags, which are rows that output TRUE or FALSE depending on what phase or scenario the model is in, can replace complex conditionals and make formulas dramatically simpler.
Named ranges feel intuitive but create long-term problems. When you delete the cell that was named but forget to delete the name, Excel retains it, and old models accumulate dozens of phantom names that cause warnings and confusion. Avoid them unless you have a very specific reason to use them.
Best Practices That Separate Good Models from Bad Ones
Color coding is not optional.
Blue for hardcoded inputs. Black for formulas. Green for references to other worksheets. Red for references to other files. This convention is standard across most professional environments, and it allows anyone who opens the model to immediately understand which cells they can change and which cells they should not touch. Without color coding, even a well-structured model is much harder to audit.
One row, one formula.
Every formula in a given row across the time axis should be identical. If your formula in January is different from your formula in March, that inconsistency is almost certainly an error. This rule, combined with the practice of never hard-coding numbers inside formulas, is one of the most effective ways to prevent mistakes from slipping through unnoticed.
Avoid hard-coding numbers inside formulas.
The number 0.35 should never appear inside a formula. It should be an input cell in your assumptions section, and the formula should reference that cell. This is not just about cleanliness. When your tax rate assumption needs to change, you want to change it in one place. If you have hard-coded it in thirty different formulas, you will miss some of them and produce incorrect results.
Build error checks into the model.
The balance sheet check, confirming that assets equal liabilities plus equity, is the most obvious and most important. But you should also check that sources and uses of funds balance in transaction models, that quarterly figures sum to annual figures if you have both, and that depreciation does not exceed the asset it is depreciating. These checks add a small amount of time to the build but save significant time during review.
Group rows instead of hiding them.
When you have rows containing intermediate calculations that you do not want cluttering the output, use Excel’s grouping function rather than hiding those rows. Hidden rows are easy to overlook when someone is reviewing or copying the model, which creates risk. Grouped rows are visible and obvious.
Comment everything that is not obvious.
If a number comes from an external source, a research report, a filing, or a conversation with management, note it in a cell comment. If an assumption was made a particular way for a specific reason, explain it. A model that cannot be understood without its author present is a liability, not an asset.
Separate inputs, calculations, and outputs.
This principle is worth repeating because it is violated constantly in practice. Assumptions embedded inside calculation sheets make models harder to update and easier to corrupt. A model where all inputs live in one clearly labeled section is far faster to update and far easier to hand off to someone else.
Scenario and Sensitivity Analysis
No set of assumptions is the truth. Every financial model represents one possible version of the future, and the value of a model comes partly from understanding how different the outcome would be if key assumptions turned out differently.
Scenario analysis lets you define multiple cases, a base case, an upside case, and a downside case, and toggle between them using a single dropdown or toggle cell. Each case has its own set of assumptions stored somewhere in the model, and the toggle switches which set of assumptions feeds the rest of the model. This is more structured than just manually changing input cells, and it preserves all three versions of the analysis simultaneously.
Sensitivity analysis, often implemented as a data table in Excel, systematically varies two key assumptions and shows how the output changes across all combinations. In a DCF model, for example, you would typically run a sensitivity table that shows the implied valuation across a range of discount rates and terminal growth rates. This is useful because it shows which assumptions the model is most sensitive to, which in turn tells you where to focus your effort in defending or challenging the analysis.
Both tools are standard in investment banking deliverables and are expected components of any model that will be presented to clients or used in a board-level decision.
Common Mistakes to Avoid
Hard-coding numbers that should be assumptions is the most common mistake in financial modeling and one of the most dangerous, because it makes models look more rigorous than they are while making them harder to update.
Performing calculations directly on the balance sheet, rather than in supporting schedules, creates a model that is difficult to audit and almost impossible to update cleanly. Every balance sheet line item should be driven by a schedule elsewhere in the model.
Re-entering the same input in multiple places is a mistake that will eventually cause inconsistencies. If the company name, the discount rate, or the revenue growth assumption appears more than once in the model, you are creating a situation where those values can get out of sync. Enter it once, reference it everywhere else.
Linking across too many worksheets within a single formula makes the model very difficult to audit. If a formula references three different worksheets, a reviewer has to navigate to three different places to check its inputs. Bring the data you need onto the sheet where the calculation lives.
Skipping the output layer, and presenting raw calculation sheets as the model’s output, makes it harder for reviewers to find what they are looking for and creates a less professional impression.
Formatting and Presentation
A financial model is a communication tool as much as it is a calculation tool. The way it looks affects how easily it can be reviewed, how much trust it earns, and how useful it is to people who did not build it.
Use consistent fonts and sizes throughout. Keep number formatting consistent: if revenues are shown in thousands, everything should be in thousands. Include a clear header on every sheet showing what the sheet contains, the scale and currency of the figures, and which scenario is active where relevant. Moreover, include a cover sheet with the model’s purpose, the date it was built, and contact information for the person who built it. Include a table of contents if the model has more than five or six worksheets.
The test of a well-presented model is whether a competent person who has never seen it before can sit down, navigate it, understand what it is doing, and spot any errors within a reasonable amount of time. If that is not possible, the model needs more work.
Frequently Asked Questions
Why is the Three-Statement Model considered the foundation of financial modeling?
This model captures the full accounting cycle by linking the Income Statement, Balance Sheet, and Cash Flow Statement. It ensures that every dollar is accounted for across all three views. If you increase revenue, the model automatically adjusts accounts receivable, taxes, and cash balances. Without this integration, a model is just a collection of isolated guesses rather than a cohesive simulation.
What is the difference between intrinsic and relative valuation models?
An intrinsic model like a Discounted Cash Flow (DCF) calculates value based on a company’s own future cash generation. It focuses on the business itself. A relative model like Trading Comps or Precedent Transactions looks outward to what the market pays for similar firms. Most professionals use both to see if the market price aligns with the company’s internal fundamentals.
Are circular references in Excel always an error?
In professional modeling, they are often intentional. This usually happens with interest expense. The interest depends on the debt balance, but the debt balance depends on the cash remaining after interest is paid. Modelers use Excel’s iterative calculation settings and a circuit breaker toggle to handle this logic without breaking the spreadsheet.
Why is color coding essential in professional models?
Standard practice dictates blue for hardcoded inputs and black for formulas. This allows any user to immediately identify which cells are safe to change. Proper formatting prevents the accidental deletion of complex logic and makes the model easy for third parties to audit.
Final Thoughts
Building financial models in Excel is a learnable skill, but it takes more than knowing the formulas. It requires a disciplined approach to structure, a commitment to transparency, and enough knowledge of accounting and business to know whether the numbers you are producing make sense.
The best models are not necessarily the most complex ones. They are the ones that answer the question they were built to answer, that hold up under scrutiny, and that someone else can use confidently without the original builder in the room.
If you are just getting started, focus on mastering the three-statement model first. Get the integration between the income statement, balance sheet, and cash flow statement right. Learn to build clean, consistent, well-commented models before you add complexity. Those foundations will serve you in every type of model you build afterwards.
At Oak Business Consultant, we build financial models for startups, growing businesses, and investors across industries. If you need a model built to investment-grade standards, or want your existing model reviewed and improved, get in touch with our team.