


Solar Panel Manufacturing Plant Excel Financial Model Template


Original price was: $190.$114Current price is: $114.
The Solar Panel Manufacturing Plant Excel Financial Model is a user friendly and fully customizable tool designed to streamline financial planning and analysis for solar panel production businesses. It generates automated financial statements (income statement, balance sheet, and cash flow), tracks production costs and sales performance, and includes scenario planning for pricing and capacity adjustments. With dynamic dashboards and visual charts, it provides clear insights to aid decision making and prepare investor ready reports, ensuring precise forecasting and sustainable business growth.
- Description
Description
Introduction
Do you want to start a solar panel manufacturing plant company? It’s a big move, but one with huge potential if done right. Whether you’re interested in to the solar industry for the first time or expanding your existing startup, getting your financials in a row is non-negotiable. This is where a five year period Excel financial model becomes your companion.
This financial model template is like having a roadmap that shows you where your money is going, how much you need, and when you’ll start seeing returns. Imagine sitting at your kitchen table, complicated numbers over coffee, and realizing exactly what your capital expenditure, operating costs, and potential risks look like. That’s the power of a solid financial model.
Let’s break it down step by step so it feels less like climbing a mountain and more like putting together a puzzle.
Utilizing the Solar Panel Manufacturing Plant Excel Financial Model
Picture this: You’re planning your solar project. You’ve got ideas buzzing in your head, but you’re not sure how to turn them into a working business plan. A Solar Power Project Excel Financial Model simplifies it all. It’s like having a cheat sheet for all the critical numbers you need to track.
This model helps you make informed decisions by showing your cash flow, financial viability, investment return calculations and other essential metrics. It’s a one-stop solution to understand the risks and rewards of your solar panel manufacturing business. It includes profitability KPIs which helps to study potential returns.
Key Components
Input Sheet
This is where everything starts. Think of it as the foundation of your house. The input sheet collects all the raw data—your initial costs, labor costs, and production capacity. By feeding in key assumptions, you set the stage for realistic financial projections and financial assumptions. Got a big expense coming up? Log it here. Want to test different pricing strategies? This is the place for strategic planning.

Loan Schedule
If you’re planning to fund your plant with long-term loans, the loan schedule is complicated. It shows out your debt repayment plan so you’re not surprised by sudden payments. It’s like having a navigator that alerts you of future threats and by this you can easily secure debt issues and monitor payback periods by seeing into debt schedule.
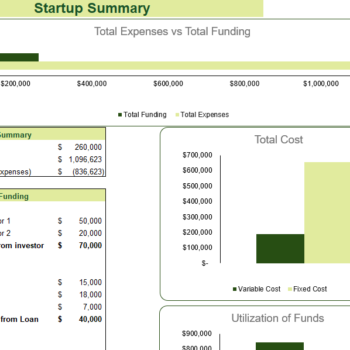
Startup Summary
Starting a solar panel manufacturing plant involves some hefty initial investment costs. The startup summary gives you a snapshot of what you need to get rolling. It includes everything from installation costs to capital costs. Want to see how much of your budget goes into machinery versus marketing? This summary shows it all.
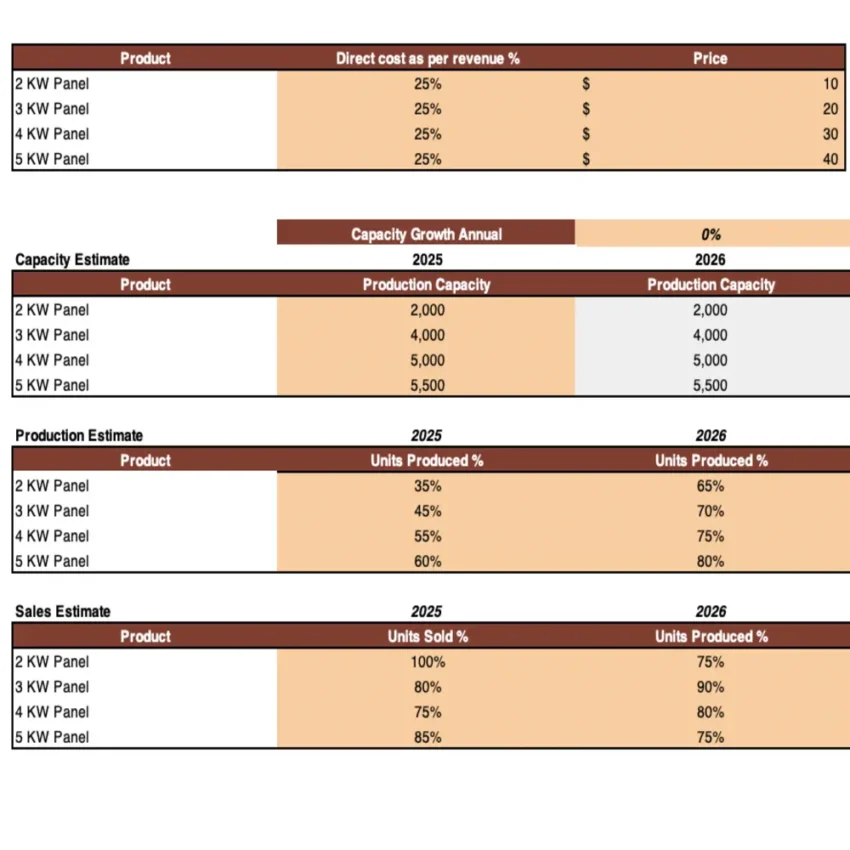
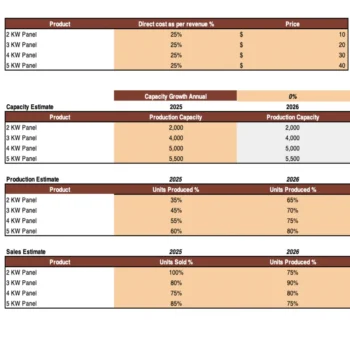
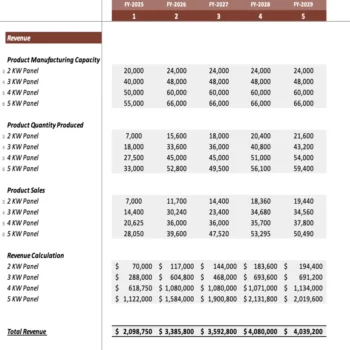
Revenue Analysis
Here’s where it gets exciting. The revenue analysis breaks down how much money your solar panels will bring in. It considers your cost per unit, operational costs, and market demand. You can see your returns on investment and decide if your pricing strategy needs tweaking.

Depreciation Table
Every piece of equipment you buy loses value over time. The depreciation table tracks this so you know the true worth of your assets year after year. It’s a small detail, but it matters for your taxable income and overall financial planning.
Monthly Income Statement
This is your month-to-month report card. It shows your operating expenses, cost of sales, and profits. If you’re wondering how seasonal changes affect your numbers, this is where you’ll find answers.
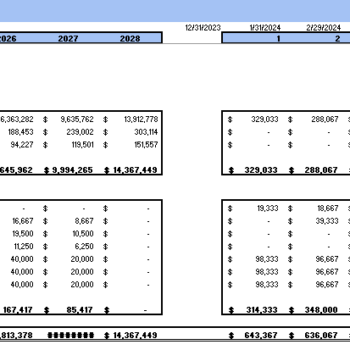
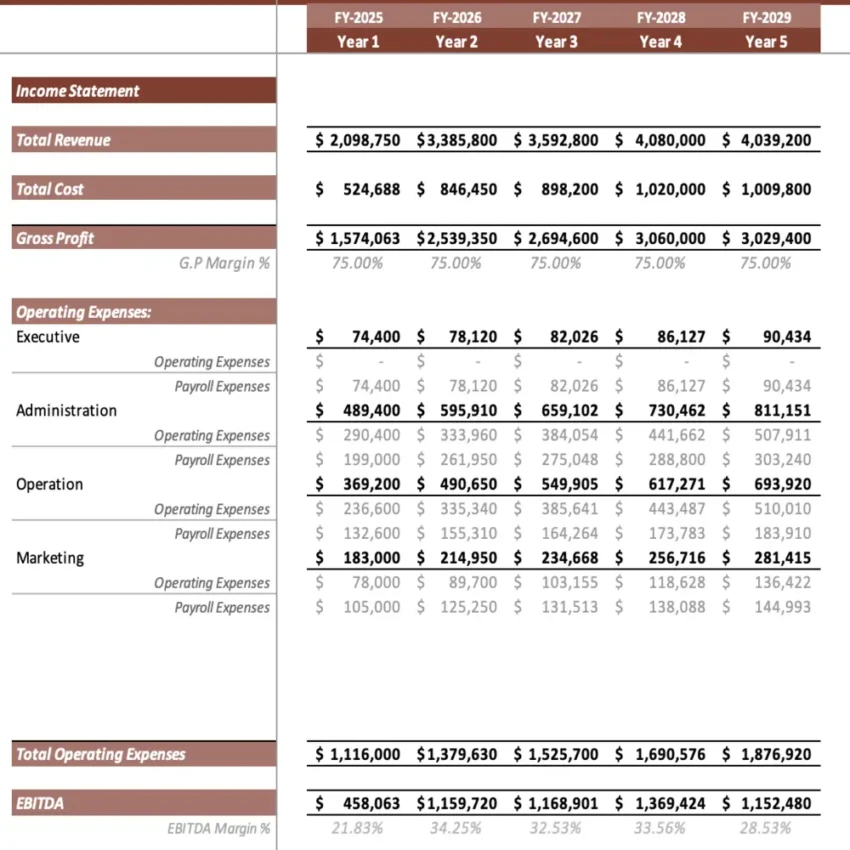
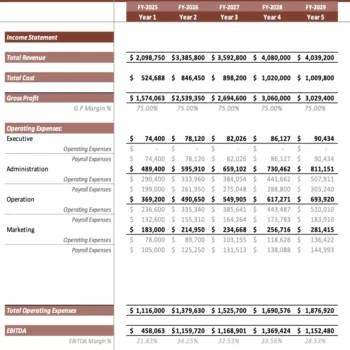
Yearly Income Statement
Zoom out a bit, and you’ve got the 5-year income statement projection. This long term view is perfect for spotting new horizons and future planning. It’s like seeing the big picture instead of just focusing on the daily grind.

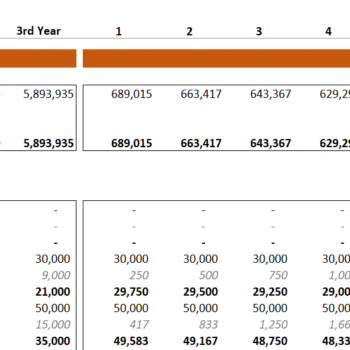
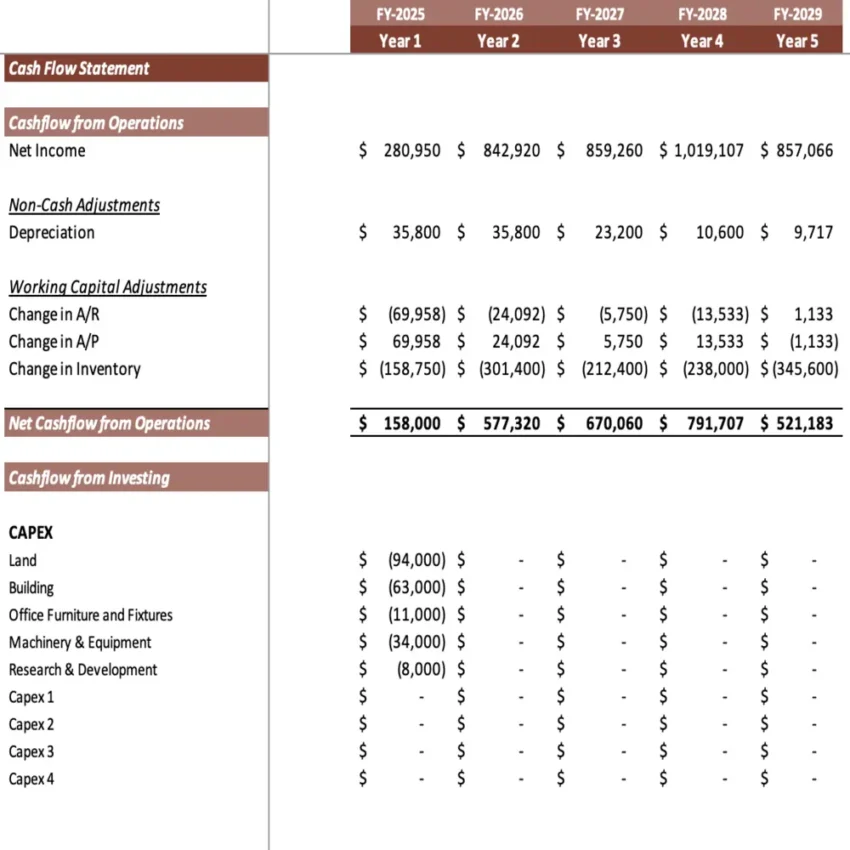
Cashflow Statement
Cash flow can make or break a business. This statement keeps track of your cash inflows and outflows, helping you understand your project cash flow over time. It’s your financial safety net and shows financial implications, financial outcomes with careful consideration.

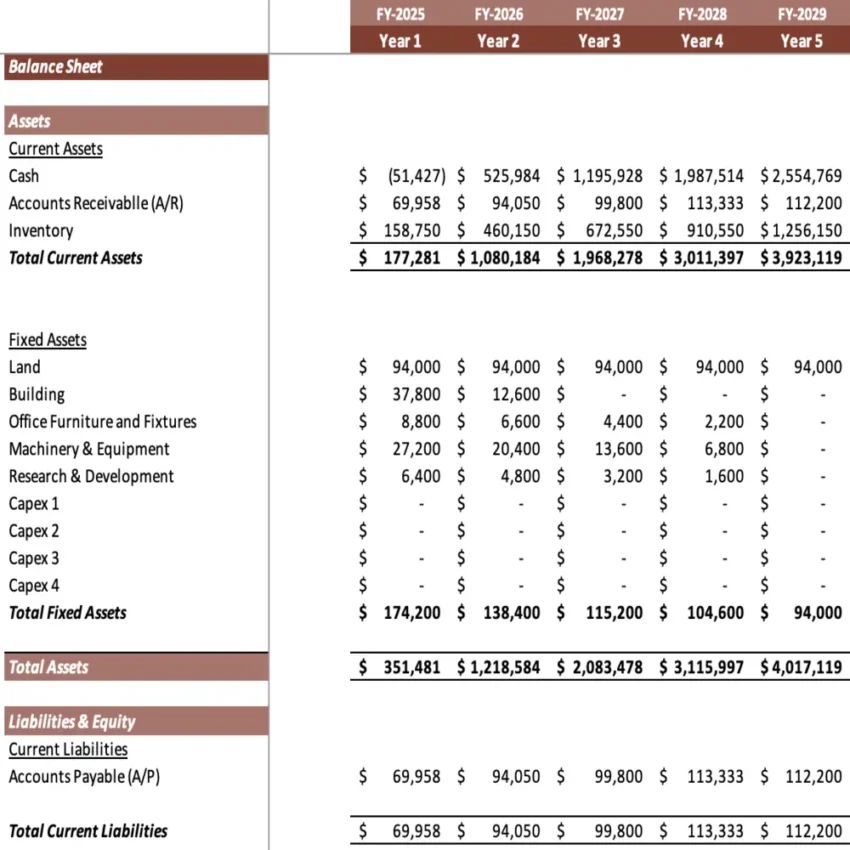
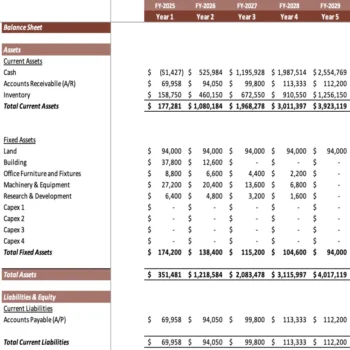
Balance Sheet
The balance sheet is all about what you own and what you owe to entity’s or an individual. It’s a breakdown of your assets, liabilities, and equity. Think of it as your financial health check.

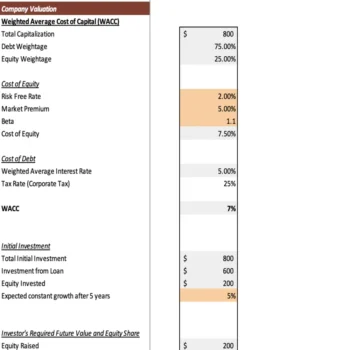
Company Evaluation
Ever wonder what your business is actually worth? The company evaluation uses metrics like the Internal Rate of Return , profitability analysis and financial plan to give you an estimate. This is especially handy if you’re looking for investors and helps to do accurate analysis.

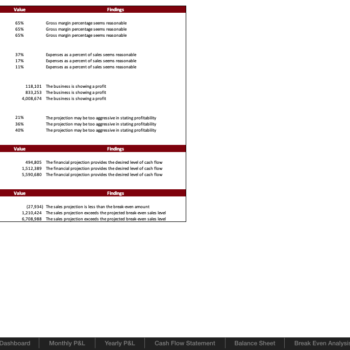
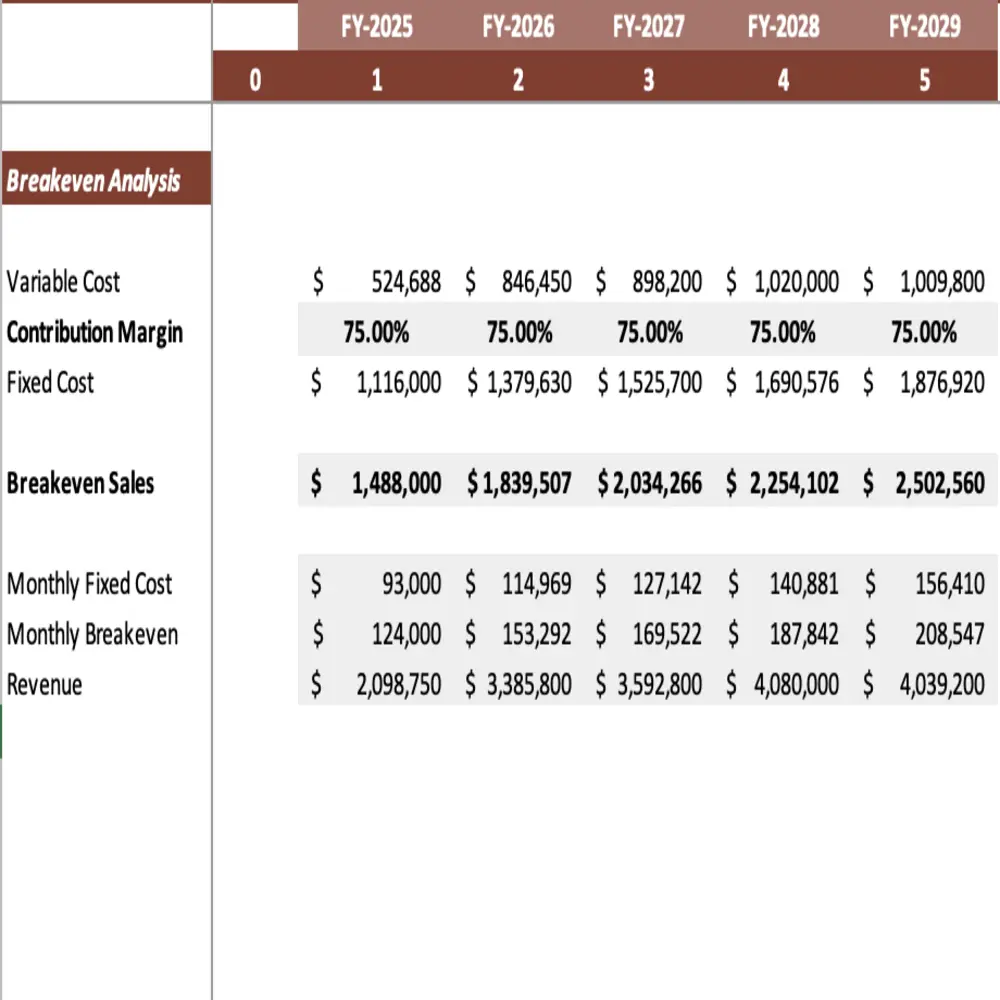
Break even Analysis
How many solar panels do you need to sell before you cover your costs? The break-even analysis answers this question. It’s a ice breaker of the momentum for understanding your cost margins and profit potential.
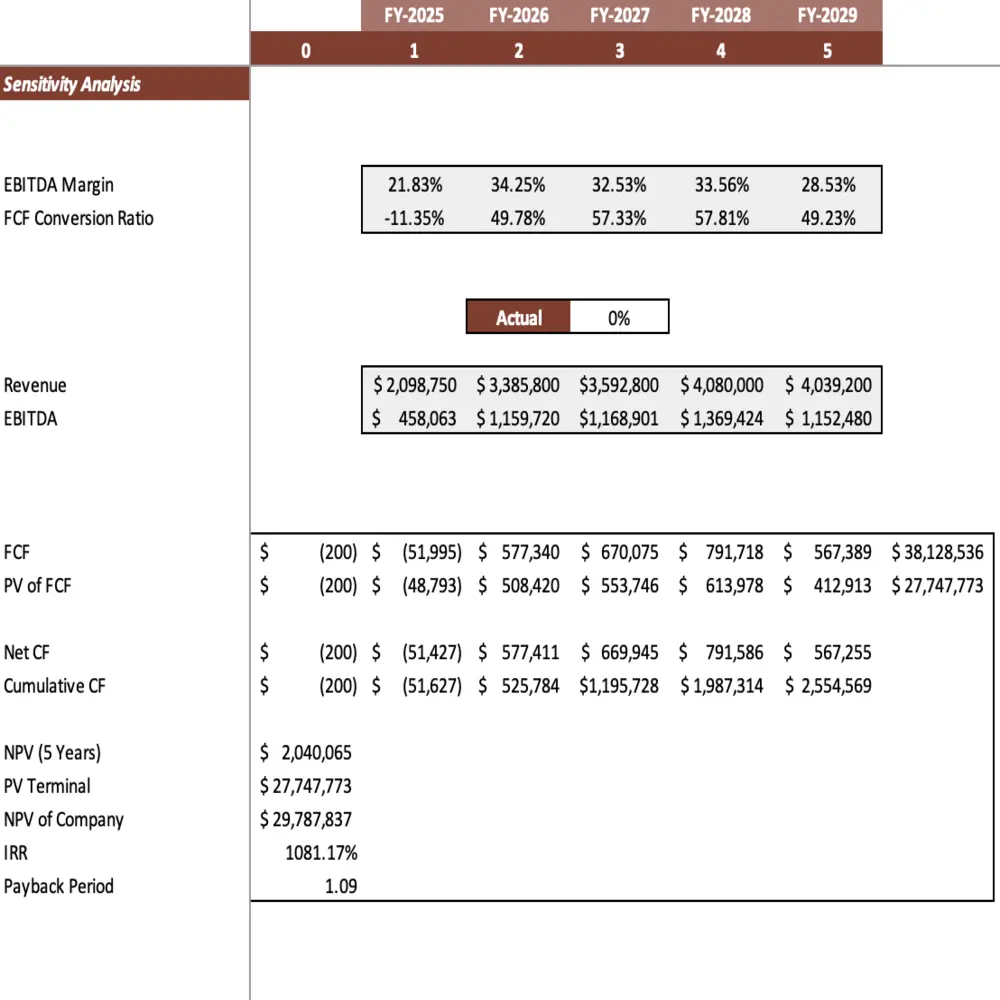
Sensitivity Analysis
This tool lets you use the different scenarios with key figures, it is one of the most important financial analysis tool. What happens if raw material prices go up? Or if sales drop? The sensitivity analysis helps you prepare for the unexpected and make accurate financial decisions and helps in-depth understanding.
Diagnostic Tools
These tools flag any discrepancies in your data. It’s like having a spellcheck for your numbers and look into critical aspects. You’ll catch mistakes early, saving you headaches down the road, it’s a powerful tool or can say comprehensive tool.
Dashboard
The dashboard shows summary of everything all together like operational expenses, financial ratios, average price, Debt & Equity and productivity margins. It’s a user friendly summary of all the key features you need to track. With just a quick look, you can check your financial performance, point out latest trends, and adjust your longterm strategies.

Frequently Asked Questions
- Why is financial modeling important for solar power plant projects?
Financial modeling helps you understand the financial aspects of your business. It shows how your initial investment costs, operating expenses, and revenues interact, giving you a clear picture of your financial viability and stability along with different tactics.
- How does a Solar Energy Financial Model help with financing options?
It shows out all the numbers you need to secure funding. From loan amortization schedules to important returns on investment, it’s all there to share with investors or shareholders.
- What are the main costs involved in a solar panel manufacturing business?
Key costs include capital expenditure, labor costs, and raw materials. You’ll also need to consider financing costs and ongoing operational costs and other related associated costs.
- How can I use sensitivity analysis to manage potential risks?
Sensitivity analysis helps you test different scenarios. It’s a way to prepare for changes in market conditions, raw material prices, or demand.
- What is the importance of a break-even analysis?
It tells you exactly how much you need to sell to cover your costs. This is critical for pricing and sales strategies.