Retail Store Financial Model: Calculate Break-Even Sales Before Opening
Retail business financial model: test the lease before you sign it
Most retail failures start with a signature. The owner signs a lease, then hopes the sales arrive.
A retail business financial model reverses that order. It asks first what the store must sell each day to survive. Only then does it ask whether the location can deliver it.
This guide builds the model around that question. It covers the driver chain from foot traffic to cash, a worked store with break-even traffic, a stress test, rent and inventory rules, and how the model changes by retail format.
Start with the drivers, not a sales target
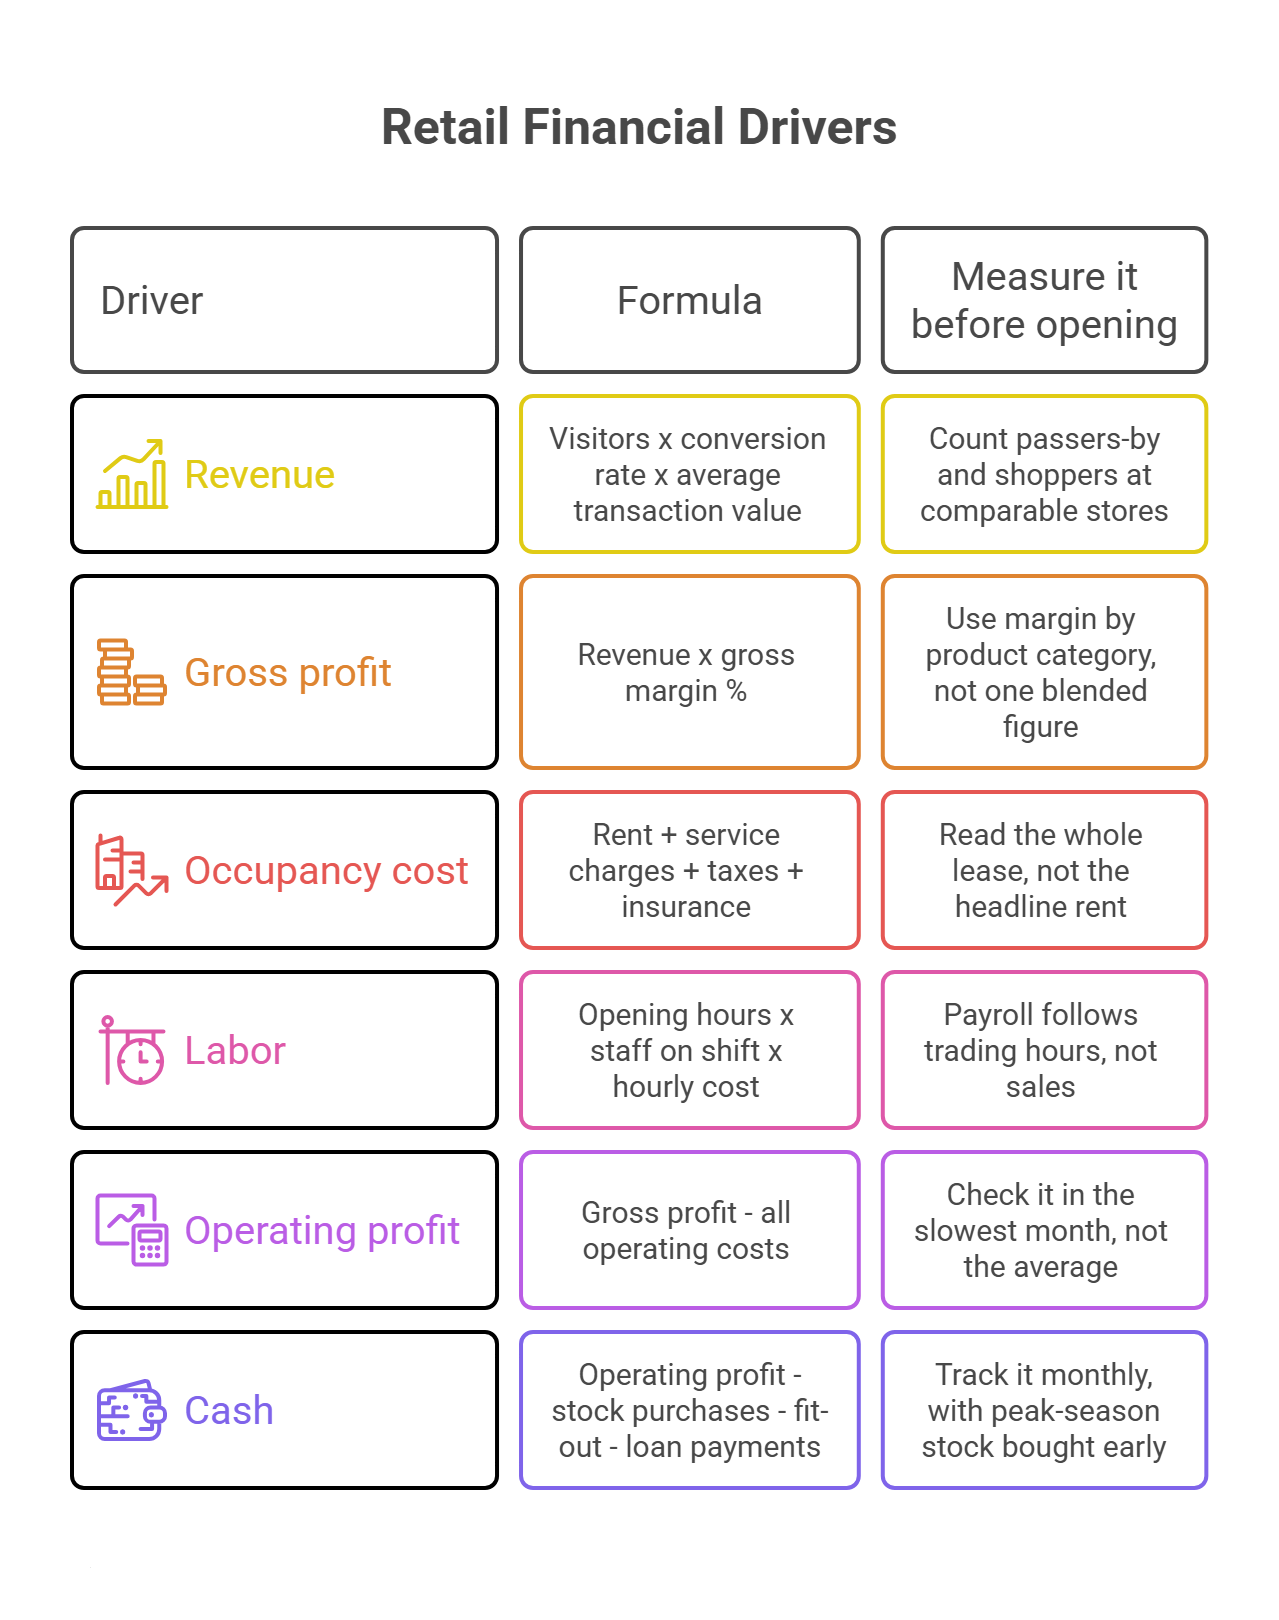
A single sales number hides every risk. Break it into the pieces a store owner can observe and change.
| Driver | Formula | Measure it before opening |
| Revenue | Visitors x conversion rate x average transaction value | Count passers-by and shoppers at comparable stores |
| Gross profit | Revenue x gross margin % | Use margin by product category, not one blended figure |
| Occupancy cost | Rent + service charges + taxes + insurance | Read the whole lease, not the headline rent |
| Labor | Opening hours x staff on shift x hourly cost | Payroll follows trading hours, not sales |
| Operating profit | Gross profit – all operating costs | Check it in the slowest month, not the average |
| Cash | Operating profit – stock purchases – fit-out – loan payments | Track it monthly, with peak-season stock bought early |
For online stores, replace visitors with sessions. The chain works the same way.
Model new and repeat customers apart. Repeat customers cost little to win back, but they return at a different pace. A single blended rate hides that.
A new store has no history. Use a ramp-up curve, so month one sits well below month twelve. Add a seasonal index too, because December and January behave differently.
A worked store: 1,200 sq ft kitchenware shop
The numbers below are hypothetical. They show how the drivers connect.
| Line | Assumption | Monthly result |
| Visitors | 75 a day, 30 days | 2,250 |
| Conversion | 22% | 495 transactions |
| Average transaction | $52 | $25,740 revenue |
| Gross margin | 48% | $12,355 gross profit |
| Occupancy cost | Rent plus service charges | $2,800 |
| Payroll | Two part-time staff plus owner draw | $4,200 |
| Utilities, insurance, POS | $900 | |
| Marketing | $1,000 | |
| Other | $600 | |
| Operating profit | $2,855 |
Occupancy cost is 10.9% of sales. Total operating costs are $9,500.
What the owner must believe
Break-even revenue is operating costs divided by gross margin: $9,500 / 0.48 = $19,792. That is about 381 transactions, or 58 visitors a day at a 22% conversion rate.
The store plans for 75. So it has a 23% cushion. That sounds comfortable. The next table shows how fast it shrinks.
Stress test
Change one driver at a time, then two together.
| Change | Revenue | Operating profit |
| Base case | $25,740 | $2,855 |
| Visitors down 10% | $23,166 | $1,620 |
| Visitors down 20% | $20,592 | $384 |
| Conversion at 18% | $21,060 | $609 |
| Average transaction $47 | $23,265 | $1,667 |
| Gross margin 45% | $25,740 | $2,083 |
| Rent up 20% | $25,740 | $2,295 |
| Visitors and conversion each down 10% | $20,849 | $508 |
Two lessons stand out.
- Lost sales hurt more than higher rent. A 20% rent rise costs $560 a month. A 20% traffic drop costs $2,471. Each lost dollar of sales takes 48 cents of gross profit with it.
- Small misses stack. Two 10% shortfalls leave the store barely profitable.
Price the lease with break-even traffic
Now turn the lease into a daily target. Hold every other cost the same and change only occupancy cost.
| Monthly occupancy cost | Break-even revenue | Break-even visitors a day | Occupancy as % of break-even sales |
| $2,800 | $19,792 | 58 | 14.1% |
| $3,400 | $21,042 | 61 | 16.2% |
| $4,200 | $22,708 | 66 | 18.5% |
A $1,400 higher occupancy cost needs about 8 more visitors a day. The question to ask is simple: can this street deliver that traffic? Count it on a weekday and a weekend before signing.
The occupancy cost ratio
The standard check is occupancy cost divided by sales. Include base rent, service charges, taxes, insurance, and any percentage rent. Rent alone understates the burden.
Healthy levels depend on the category. Retail leasing sources describe grocery tenants as healthy near 2.5%, and apparel tenants at 12% or more. A common general guide keeps the ratio under 10%. Some sources put typical retail leases at 8% to 15%.
Treat these as ranges, not rules. Margin decides what a store can afford. A high-margin shop carries more rent than a low-margin one.
Plan stock like cash, because it is
Stock is the other place retail models go wrong. A store can show a profit while cash drains into the stockroom.
Track three measures:
- Inventory turnover = COGS / average inventory
- Days of inventory = 365 / turnover
- GMROI = annual gross profit / average inventory at cost
In the kitchenware store, annual COGS is $160,618. At four turns, average stock is about $40,150 and lasts 91 days. GMROI is 3.7. A GMROI below 1.0 means the stock earns less than it costs to hold.
Open-to-buy: how much to order
Open-to-buy sets how much stock a store can still order for a period. At cost:
Open-to-buy = planned sales at cost + planned ending stock – beginning stock – stock already on order
Take December. Planned sales are $41,184, which is 1.6 times a normal month. At 52% cost, that is $21,416 of COGS. The owner wants $30,000 of stock at month end. Stock on hand is $38,000, with $4,000 on order.
Open-to-buy is $21,416 + $30,000 – $38,000 – $4,000 = $9,416. That cash leaves in the weeks before the holiday sales arrive. Supplier terms can ease the gap. Model them as an explicit assumption.
Margin versus markup
A $12 item sold at $24 has a 100% markup. Its gross margin is 50%. Using one for the other is a common error in first models, and it distorts pricing.
Count the full cost of getting stock on the shelf. That includes freight, customs, packaging, and card fees. Then deduct what never reaches the till: markdowns, returns, and theft.
Link the statements and find the funding gap
Link the profit and loss, cash flow, and balance sheet. A change in one should flow through the others.
The lowest point of cumulative cash is the funding the store needs. It usually falls before break-even, since fit-out, opening stock, and deposits go out first.
Run three cases: base, downside, and upside. Flex the five drivers that move results most: traffic, conversion, basket size, gross margin, and occupancy cost.
Chains need one more layer. Forecast each store alone, then roll the results up. Oak’s financial model for a clothing store chain in Dubai and Jordan shows that structure at work. For stock tracking, Oak also offers a free inventory and COGS spreadsheet.
How the model changes by format
Each format has its own main driver and its own way of running out of cash.
| Format | Main driver | Watch closely | Oak model |
| Grocery | Basket size and visit frequency | Thin margins, spoilage, turns | Grocery marketplace model |
| Apparel | Seasons and sell-through | Markdowns, size and color depth | Retail clothing store model |
| Appliances and electronics | High-ticket units | Margin per unit, warranty claims | Appliances store model |
| Online retail | Sessions and conversion | Shipping, returns, platform fees, ad cost | E-commerce modeling service |
| Specialty shops | A niche customer and product mix | Slow-moving stock, location rent | Custom or template |
| Service-led shops | Booked hours plus product sales | Chair utilization, staff split | Custom or template |
Oak also has templates for homeware, golf equipment, massage products, barber shops, and tattoo shops.
Sales channel matters too. Direct-to-consumer retail runs on traffic and basket size. Wholesale runs on order size and payment terms, so receivables become the main cash driver. Omnichannel stores should model each channel apart, because shipping, returns, and discounts differ.
Six mistakes that sink retail models
- Signing before testing. No break-even traffic was calculated for the lease.
- One blended margin. Low-margin lines hide inside the average.
- Rent without service charges. The real occupancy cost is higher.
- Profit without cash. Stock is paid for long before it sells.
- Flat monthly sales. Seasonality hides the cash crunch.
- Only one case. A single outcome is a sales pitch.
Frequently Asked Questions
What should a retail financial model include?
A revenue forecast built from traffic, conversion, and basket size. It also needs COGS by category, fixed and variable costs, an inventory plan, three linked statements, and base, downside, and upside cases.
How do you forecast sales for a new store?
Triangulate. Count foot traffic at the site and at comparable stores. Apply a conversion rate and basket size from similar retailers. Add a ramp-up curve and a seasonal index. Then check the result against sales per square foot.
How do you calculate retail break-even?
Divide monthly operating costs by gross margin to get break-even revenue. Divide that by the average transaction to get the sales needed. Divide again by conversion and trading days to get visitors a day.
What rent can a store afford?
Compare total occupancy cost with expected sales. A common guide keeps it under 10% of sales, but categories differ. Low-margin stores need a lower ratio.
How much stock should a store hold?
Enough to avoid stockouts, with no cash sitting idle. Track turnover and days of inventory by category. A low GMROI is a warning sign.
Should I use a template or a custom model?
A template suits one store with standard drivers. A custom model suits chains, multi-channel retail, and investor-facing plans.
Count the customers before you count the profit
A retail model earns its fee on a simple point. Stores rarely fail because sales fall to zero. They fail because sales land a little under plan while rent and stock commitments stay fixed.
Owners who calculate break-even traffic before the lease make better choices. Lenders also trust them more. If you need a retail model for a lender, an investor, or a new location, Oak Business Consultant builds them from store level to group level. Talk to Oak about financial modeling services for your retail business.