Direct Cost Breakdown Analysis: A Complete Guide
Essential Direct Cost Breakdown Analysis Tips
Every dollar that leaves your business tells a story. The question is whether you are reading it.
A direct cost breakdown analysis is one of the most powerful tools a business can use to understand where money actually goes. Not where you think it goes. Where it actually goes. When you break costs down to their true components, you stop guessing and start making decisions grounded in real numbers.
This guide covers everything you need to know about conducting a thorough direct cost breakdown analysis: the core concepts, step-by-step methodology, industry applications, technology enablers, and the strategies that help you control spending and protect your margins at every stage of growth.
What Is a Direct Cost Breakdown Analysis?
A direct cost breakdown analysis is the process of identifying, categorizing, and examining every cost that can be directly tied to a specific product, service, project, or business unit. Unlike indirect costs or overhead, direct costs move in direct proportion to what you produce or deliver. If you make more units, your direct costs rise. If production slows, they fall. That traceability is what makes them so important to manage.
In business economics, cost breakdown analysis itemizes the cost of a product or service into its underlying cost drivers. The analysis makes it possible to see the financial anatomy of a business at a granular level, revealing which cost elements compress margins, where resource allocation can be tightened, and which cost drivers are most sensitive to market changes.
The goal is clarity. When you run a proper cost breakdown analysis, you get a line-by-line view of your cost structure rather than an undifferentiated total. That visibility is the foundation of smart cost management.
This type of analysis is used across industries, from manufacturing and construction to professional services and technology. Wherever money flows into producing an output, a direct cost breakdown analysis helps you understand and manage that flow.
Direct Costs vs. Indirect Costs: Why the Distinction Matters
Before diving into methodology, it helps to be precise about what “direct” actually means in this context.
Direct costs are expenses that can be traced, without ambiguity, to a specific cost object. A cost object is any unit of analysis you choose: a product line, a project, a client engagement, a business unit. Labor hours billed to a project, raw materials consumed in manufacturing a product, and subcontractor fees for a specific contract are all direct costs.
Indirect costs (also called overhead) cannot be traced to a single cost object and must be allocated across multiple outputs. Facility rent, administrative salaries, and general insurance premiums are examples. A business has far less operational leverage over indirect costs on a unit-by-unit basis.
| Characteristic | Direct Costs | Indirect Costs |
| Traceability | Directly traceable to a cost object | Shared across multiple outputs |
| Behavior | Variable with output | Often fixed or semi-fixed |
| Examples | Labor, raw materials, subcontracting | Rent, admin salaries, utilities |
| Management leverage | High | Lower |
| Role in pricing | Core to unit economics | Allocated through overhead rates |
Misclassifying costs between these two categories distorts your understanding of true product or project economics. A manufacturing firm that lumps factory floor supervisor salaries into overhead may systematically underestimate the direct cost of production and misprice its products.
Why Direct Costs Matter More Than People Think
Many businesses focus on revenue growth while paying less attention to what it costs to generate that revenue. This is an expensive oversight.
Labor costs and material costs are typically the two largest direct cost components for most businesses. Together, they often represent 60 to 80 percent of total production costs. Small inefficiencies in either area compound quickly at scale.
Here is a straightforward truth about business mathematics: a 5 percent reduction in direct costs can have a greater impact on net profit than a 20 percent increase in revenue in many business models. That is why a focused direct cost breakdown analysis pays for itself many times over.
Understanding your cost structure in detail also prepares you for conditions outside your control. Supply chain disruptions, raw material price spikes, currency fluctuations, and sudden changes in labor market conditions all hit direct costs first. Businesses that know their cost drivers respond faster and more precisely than those operating on approximations.
A detailed direct cost breakdown analysis also feeds directly into better financial forecasting and budgeting. When you know the cost structure of each product or service, you can model scenarios accurately and plan for growth without overextending your margins.
The Core Components of a Direct Cost Breakdown
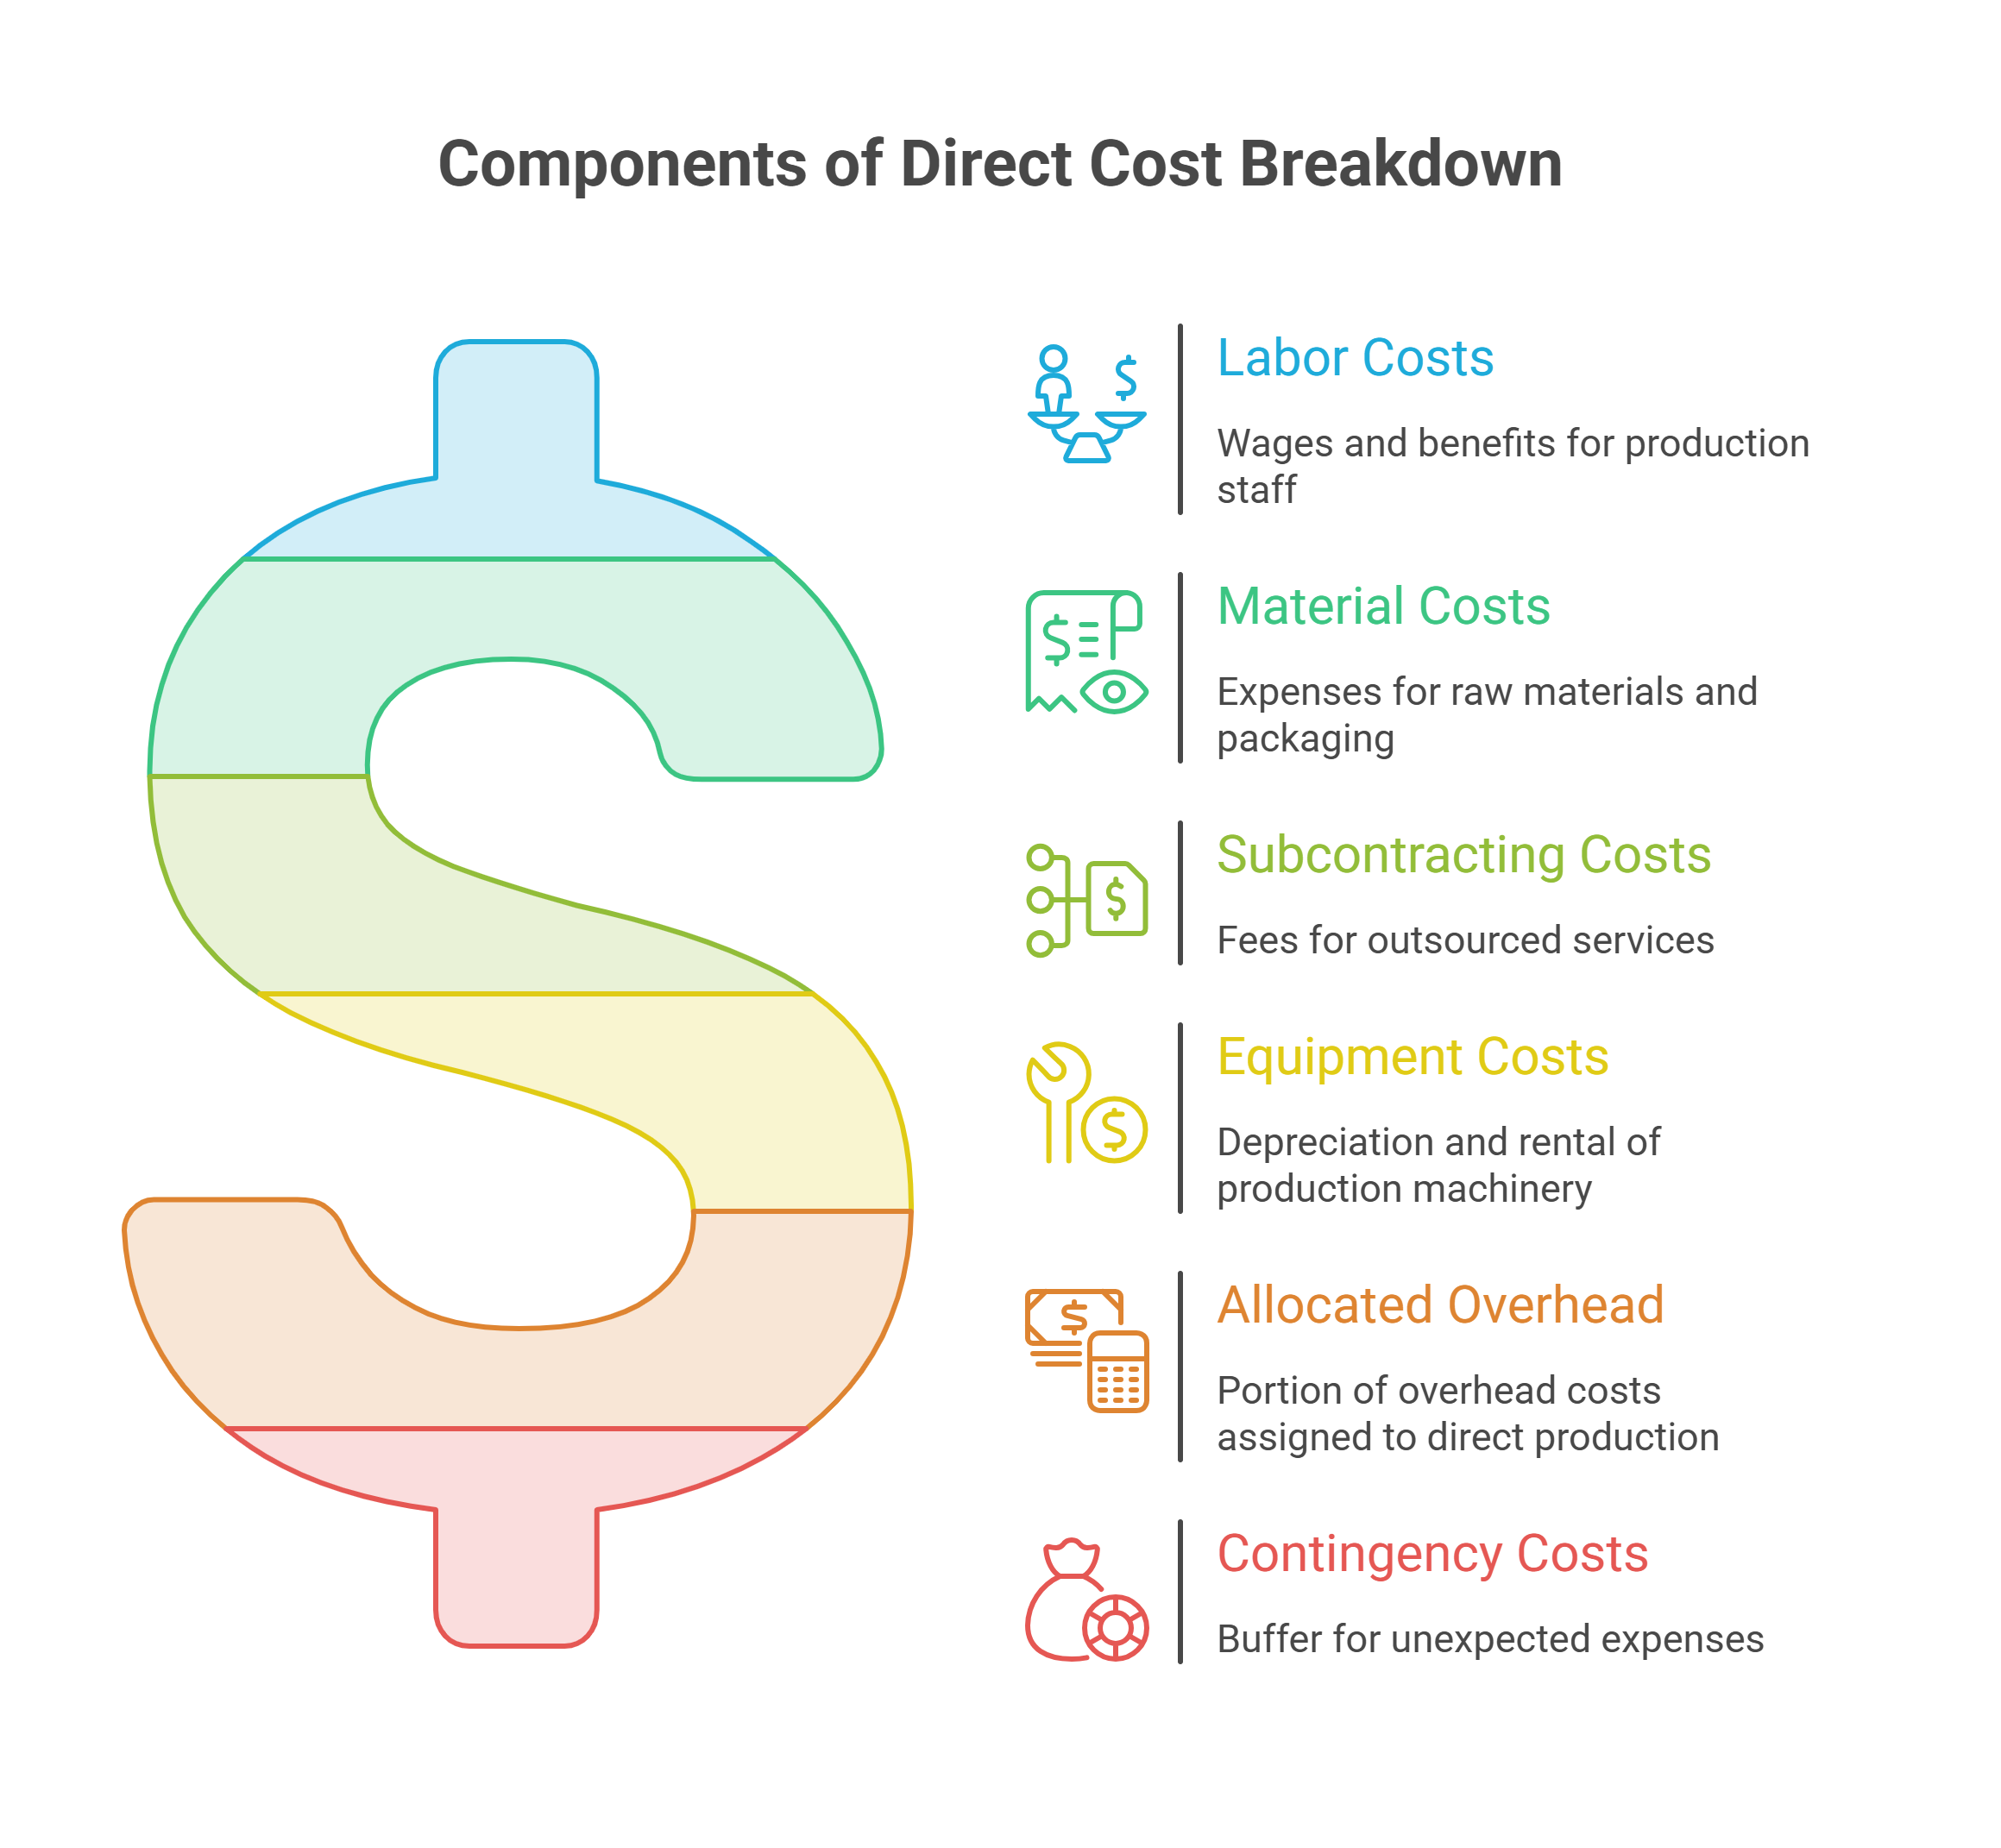
When you conduct a direct cost breakdown analysis, you are examining specific cost elements that collectively explain your total direct cost. Here is what those elements typically include.
Labor Costs
Labor costs represent the wages, salaries, benefits, and payroll taxes tied to the people directly involved in producing your product or delivering your service. In manufacturing, this means your production floor workers. In consulting or professional services, it means the hours your team bills to client deliverables.
Labor costs are often the most visible direct cost category, and also the hardest to optimize without granular data. A thorough cost breakdown analysis shows you not just total labor spend, but labor cost per unit, per project, or per service hour. That level of detail is what makes improvement possible.
It also creates accountability. When teams can see the cost of their hours relative to project budgets, decision-making improves across the organization.
Material Costs
Material costs cover everything you purchase to create your product. Raw materials, components, packaging, and manufacturing supplies all fall into this category. For a manufacturer, this includes inputs like steel, plastic, or fabric. For a food business, it includes ingredients and packaging.
Tracking material costs at a granular level allows you to spot price creep before it damages margins. It also gives you leverage in supplier negotiations, because you can show exactly where you are spending and how prices have shifted. Businesses that cannot quantify their material cost exposure are always reactive in procurement conversations. Those with detailed cost breakdowns can negotiate from a position of knowledge.
Subcontracting and Third-Party Services
When a business outsources specific components of a project or product to external vendors, those fees are typically direct costs. Subcontracting is common in construction, IT services, engineering, and creative industries. Tracking these costs within your breakdown structure prevents them from being absorbed into vague overhead allocations and ensures they are properly accounted for in project pricing.
Equipment and Tooling Costs
In capital-intensive industries, the cost of equipment, tooling, and machinery directly used in production is treated as a direct cost. This can include depreciation of manufacturing equipment, rental of specialized machinery for a project, or software licenses tied to specific client engagements.
Overhead Costs Allocated to Direct Production
While overhead costs like facility rent and administrative salaries are not always classified as direct costs, a portion can be allocated to specific products or projects based on a defined cost allocation basis, such as labor hours or machine hours. Understanding how these costs flow into your cost breakdown structure gives you a more accurate picture of true profitability.
This is where activity-based costing becomes valuable. Rather than spreading overhead uniformly, activity-based costing assigns costs based on actual resource consumption per cost object, producing a more accurate direct cost figure.
Contingency Costs
Contingency costs are planned buffers built into cost estimates to account for uncertainty. In project management, contingency is typically set as a percentage of the total estimated cost, adjusted for the risk profile of the project.
A thoughtful cost breakdown analysis flags whether contingency reserves are being used appropriately or are masking deeper cost problems. Contingency should be a managed reserve with a clear drawdown process, not a default explanation for budget overruns.
How to Conduct a Direct Cost Breakdown Analysis: Step-by-Step
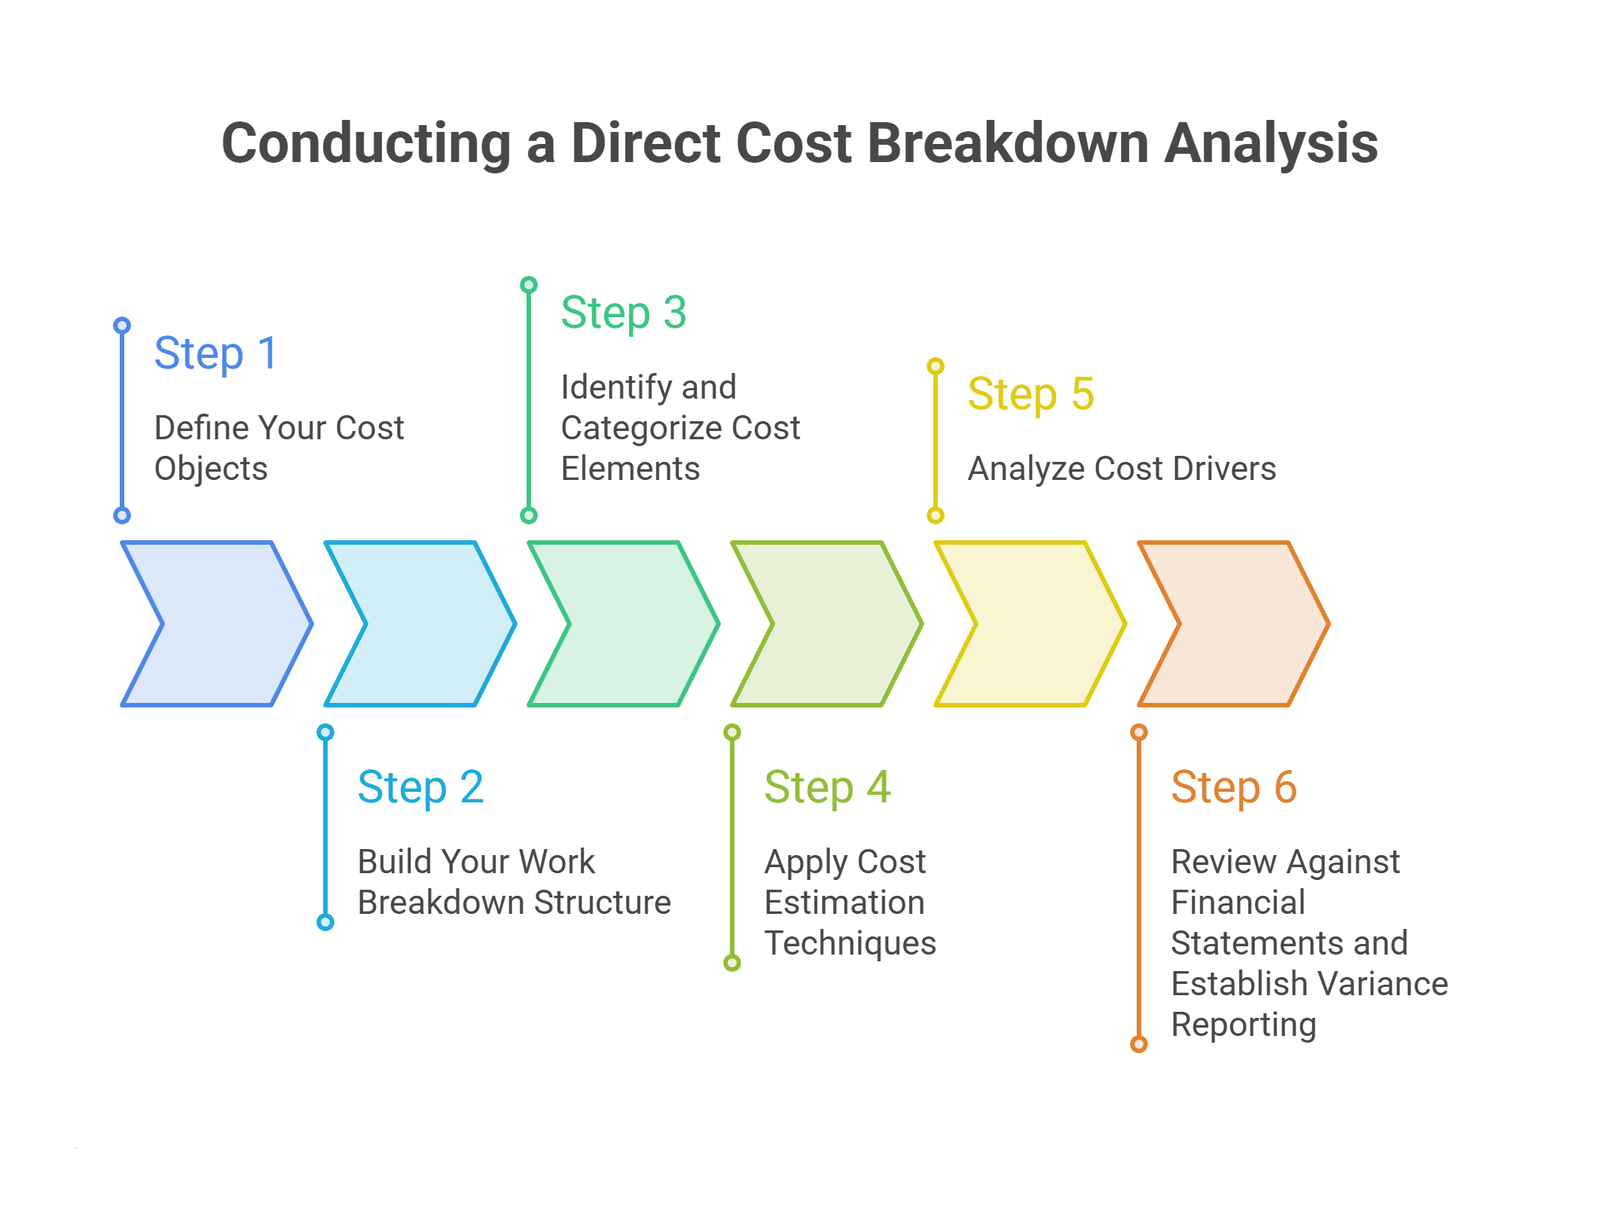
The process is systematic but requires discipline and accurate underlying data. Here is how to approach it.
Step 1: Define Your Cost Objects
A cost object is whatever you are analyzing. It could be a product line, a project, a client engagement, a service category, or a business unit. You need to define this clearly before you start, because it determines what costs are relevant and which are not. Ambiguity at this stage leads to imprecise cost allocations later.
For a product business, the cost object is typically a SKU or product family. Additionally, for a services firm, it is usually a client engagement or service type. For a project-based business, it is the project itself.
Step 2: Build Your Work Breakdown Structure
A Work Breakdown Structure (WBS) is a hierarchical decomposition of the work required to deliver your cost object. It breaks the project or product down into manageable components, making it easier to assign costs at each level.
The WBS is the scaffolding that turns a vague cost total into a structured cost breakdown. Each node in the hierarchy corresponds to a scope element, and each scope element has an associated cost estimate. When you sum the costs from the bottom of the WBS upward, you arrive at your total direct cost with full traceability.
This step is especially critical in project management contexts. Platforms that support project scheduling and resource tracking can help you build and maintain a WBS efficiently.
Step 3: Identify and Categorize Cost Elements
For each component in your Work Breakdown Structure, list the cost elements that apply. Group them by category: labor costs, material costs, equipment, subcontracting, allocated overhead, and contingency.
Being thorough here is what separates a useful cost breakdown analysis from a superficial one. Every cost element should be traceable back to a source document, a supplier quote, or a verifiable estimate. Costs that cannot be sourced should be flagged for further investigation rather than included at face value.
Step 4: Apply Cost Estimation Techniques
Depending on the nature of your project or product, you may use several cost estimation techniques. The right choice depends on how much historical data is available and how early in the planning cycle you are. See the following section for a detailed treatment of these methods.
Step 5: Analyze Cost Drivers
Cost drivers are the activities or conditions that cause costs to increase or decrease. Understanding your cost drivers is one of the most valuable outcomes of a thorough direct cost breakdown analysis.
Common cost drivers include production volume, headcount, machine hours, square footage, transaction counts, and project complexity. When you know what is driving your costs, you can make targeted decisions to control or reduce them rather than cutting broadly across categories.
Cost driver analysis also reveals non-linear cost behaviors. Some costs scale linearly with output. Others step up in fixed increments as capacity thresholds are crossed. Still others are driven by complexity rather than volume. Knowing which pattern applies to each cost element allows for far more accurate planning.
Step 6: Review Against Financial Statements and Establish Variance Reporting
Your cost breakdown analysis should be reconciled against your actual financial statements. This reconciliation helps you identify variances between planned and actual costs, catch cost spikes early, and verify that your cost allocation basis is producing accurate results.
Variance reporting should be a standing discipline, not a one-time exercise. Establish a regular cadence, whether monthly, quarterly, or at project milestones, for reviewing actual costs against your breakdown structure and investigating material differences.
Cost Estimation Techniques Explained
The quality of a direct cost breakdown analysis depends heavily on the quality of the cost estimates it is built on. Here are the main estimation techniques used in practice.
| Technique | How It Works | Best For |
| Bottom-up Estimating | Builds costs from the smallest WBS components upward | Detailed project planning with well-defined scope |
| Parametric Estimating | Uses statistical relationships between project variables and historical cost data | Early-stage estimates with limited scope definition |
| Analogous Estimating | Benchmarks against similar completed projects or products | Quick estimates when detailed data is unavailable |
| Three-Point Estimating | Averages optimistic, pessimistic, and most likely cost scenarios | Risk-adjusted estimates in uncertain environments |
| Activity-Based Costing | Assigns costs based on actual resource consumption per activity | Overhead allocation and service-line profitability |
Many finance teams use a combination of these methods to cross-validate their cost estimates. Parametric estimating might be used early in a project to establish a budget range, while bottom-up estimating is used as the scope definition matures to produce a detailed cost breakdown.
Direct Cost Breakdown by Industry
The composition of direct costs varies considerably across industries. Here is how a cost breakdown analysis typically looks in different contexts.
Manufacturing
In manufacturing, direct costs are dominated by raw materials and direct labor. A typical breakdown might show materials at 40 to 60 percent of total direct cost, direct labor at 20 to 35 percent, and manufacturing overhead (allocated) at 15 to 25 percent. Machine hours are often the dominant cost driver, and cost breakdown analysis is used extensively to support pricing decisions, supplier negotiations, and make-vs-buy analyses.
Construction
Construction projects have complex direct cost structures that include materials, subcontractor fees, equipment, and site labor. Contingency costs are particularly important in construction, where unforeseen site conditions, weather delays, and design changes are common. A rigorous cost breakdown structure mapped to the project WBS is essential for tracking budget performance throughout a construction project’s lifecycle.
Professional Services and Consulting
In professional services, direct costs are primarily labor. The cost breakdown analysis focuses on billable hours, staff utilization rates, and the cost of delivering specific service types. Understanding the fully loaded cost of a consultant’s hour, including salary, benefits, and overhead allocation, is critical for setting profitable fee structures. Oak’s Fractional CFO services routinely involve building cost frameworks that help services businesses understand the true economics of each engagement.
Technology and SaaS
For SaaS and technology companies, direct costs include hosting and infrastructure, customer success labor, and third-party software fees embedded in service delivery. As these businesses scale, understanding the cost of serving each customer, the so-called Cost to Serve, becomes central to margin management. Cost breakdown analysis feeds directly into unit economics modeling that investors scrutinize closely.
Retail and E-Commerce
Retail direct costs include product cost (cost of goods sold), inbound freight, import duties, and fulfillment costs tied to specific SKUs. A detailed cost breakdown by product category reveals which lines are truly profitable and which are margin dilutive when all direct costs are properly accounted for.
Worked Numerical Example
To make this concrete, consider a mid-sized engineering firm bidding on a six-month infrastructure project.
Project scope: Design and project management for a commercial building HVAC system upgrade.
Step 1: Define cost object. The cost object is the HVAC upgrade project.
Step 2: Work Breakdown Structure. The project is broken into four major phases: site assessment, design, procurement support, and installation oversight.
Step 3: Cost element identification and estimation.
| Cost Element | Category | Monthly Cost | Duration | Total |
| Senior Engineer (0.5 FTE) | Direct Labor | $7,500 | 6 months | $45,000 |
| Project Manager (0.3 FTE) | Direct Labor | $4,200 | 6 months | $25,200 |
| CAD Technician (0.4 FTE) | Direct Labor | $3,200 | 4 months | $12,800 |
| Specialized HVAC Software License | Equipment/Tools | $1,500 | 6 months | $9,000 |
| Site Survey Subcontractor | Subcontracting | One-time | $6,500 | |
| Travel and Site Access | Direct Materials | $800 | 6 months | $4,800 |
| Allocated Overhead (25% of labor) | Overhead Allocation | $20,750 | ||
| Contingency (8% of subtotal) | Contingency | $9,924 | ||
| Total Direct Cost | $133,974 |
Step 4: Cost driver analysis. The dominant cost driver is labor hours, particularly senior engineer time. A 10 percent reduction in senior engineer involvement (via better scope definition or more efficient software tools) would reduce total project cost by approximately 3.4 percent, or $4,500, before contingency.
Step 5: Variance tracking. At month three, actual labor spend is tracked against this breakdown. If senior engineer hours have overrun by 15 percent, the project manager has an early warning signal and can investigate whether scope has drifted before the overrun compounds through the remaining three months.
This kind of structured visibility is exactly what a Virtual CFO or Fractional CFO provides to businesses that do not yet have the internal finance capacity to build and monitor these frameworks independently.
Cost Control and Cost Reduction Strategies
A direct cost breakdown analysis is not just a diagnostic tool. It is a roadmap for cost control and cost reduction.
Once you understand your cost structure in detail, specific improvement strategies become visible.
Supplier renegotiation.
Granular material cost data gives you real leverage in procurement conversations. When you can show a supplier the exact volume you are purchasing, how their pricing compares to market benchmarks, and the trend in your spend over time, you negotiate from knowledge rather than intuition.
Labor deployment optimization.
When you can see exactly where labor hours are being consumed relative to output, you can identify roles or processes that are consuming disproportionate time for their contribution. This is distinct from simply cutting headcount. It is about matching the right skills to the right tasks and eliminating waste in how labor is scheduled and supervised.
Make vs. buy analysis.
A detailed direct cost breakdown makes it possible to compare the true cost of producing something internally versus outsourcing it. Many businesses make this decision based on incomplete data and end up either outsourcing activities that would be cheaper to keep in-house or maintaining internal capabilities that a subcontractor could deliver more efficiently.
Earned Value Management.
For project-based businesses, Earned Value Management (EVM) provides a systematic framework for connecting cost performance to schedule performance. EVM metrics like the Cost Performance Index and Schedule Performance Index give project teams a real-time signal of whether they are on track to deliver within budget. A CPI above 1.0 means you are getting more value per dollar spent than planned. Below 1.0 is an early warning. This kind of early detection is only possible when the underlying cost breakdown structure is solid.
Budgeting integration.
A cost breakdown analysis should feed directly into the annual budgeting process. When budget targets are grounded in real cost driver data rather than percentage-based assumptions from prior years, cost objectives are both more achievable and more meaningful.
Cost savings goals that are grounded in real cost data are far more achievable and sustainable than those derived from top-down targets. The breakdown gives you the specificity to act rather than simply aspire.
Cost Breakdown Analysis in Government Contracting
In government contracting, a direct cost breakdown analysis takes on additional legal and regulatory weight.
The Federal Acquisition Regulation, specifically FAR 15.404-1(c), requires contractors to provide detailed cost or pricing data when contracts exceed certain thresholds. A contracting officer reviews the cost breakdown structure to assess whether proposed costs are fair and reasonable. This includes scrutiny of labor rates, material costs, overhead allocation rates, and contingency reserves.
A Cost Breakdown Structure in this context must meet exacting documentation standards. Each cost element needs a traceable basis of estimate, whether from historical data, supplier quotes, industry benchmarks, or engineering analysis. Vague or unsupported cost estimates expose contractors to significant risk during audits and can result in price adjustments that damage profitability.
Contractor Cost Data Reports submitted to the Cost Assessment Data Enterprise (CADE) allow government agencies to collect and analyze contractor cost data across a project’s lifecycle. For contractors, maintaining a clean and consistent cost breakdown structure is not optional. It is a compliance requirement that also happens to produce better project management outcomes.
When a suspension of work or a differing site condition affects project costs, having a rigorous cost breakdown already in place makes it far easier to calculate and justify the equitable adjustment you are entitled to. Businesses without that foundation often leave money on the table in these situations simply because they cannot produce a defensible cost reconstruction.
Using Technology to Improve Your Cost Breakdown Analysis
Modern businesses have more tools available than ever to support accurate and efficient cost breakdown analysis.
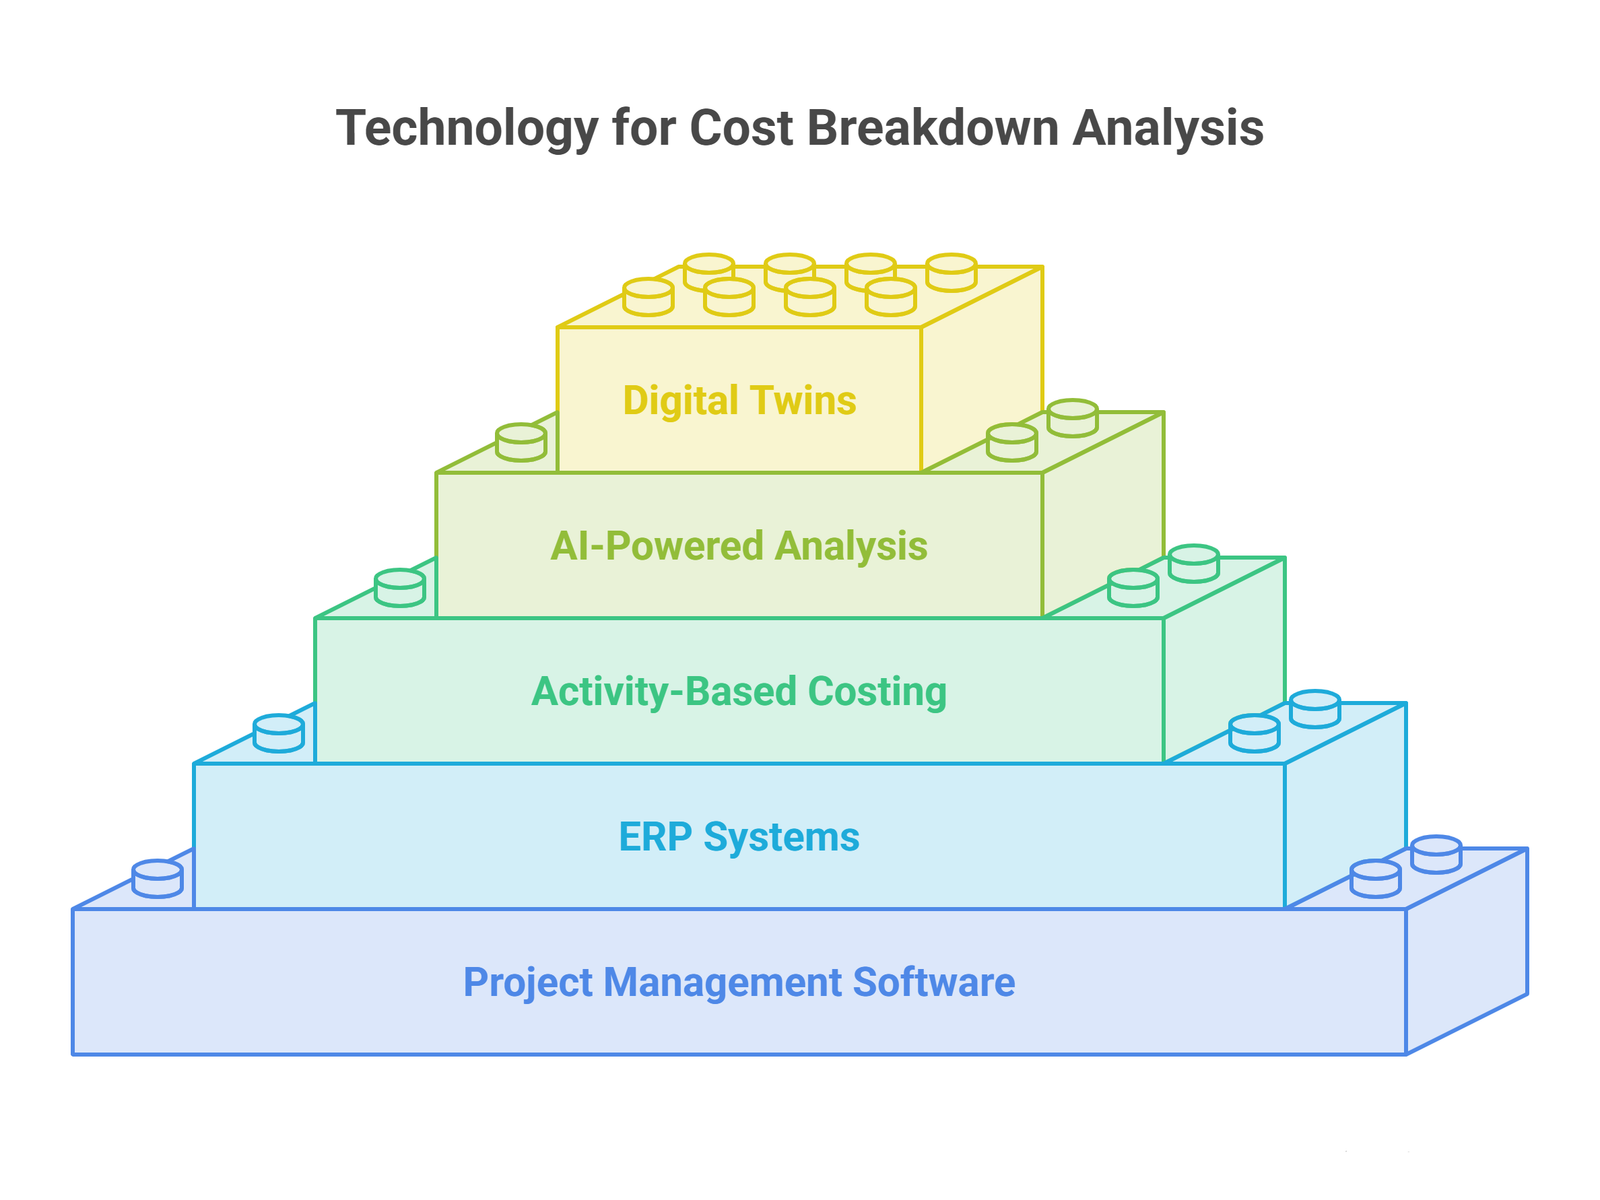
Project management and cost tracking software.
Platforms that integrate project scheduling with cost tracking allow you to maintain a live connection between your Work Breakdown Structure and your actual spend. Rather than updating a spreadsheet manually at the end of each month, costs flow into your breakdown structure in real time, and variance reports generate automatically.
ERP systems.
Enterprise resource planning systems connect cost data across procurement, production, HR, and finance. When these systems are properly configured, a direct cost breakdown analysis draws on actual transactional data rather than estimates, and the reconciliation between your breakdown and your financial statements is straightforward.
Activity-based costing software.
Specialized tools for activity-based costing make it practical to implement a more sophisticated cost allocation methodology than traditional overhead rate spreading. These tools are particularly valuable for businesses with diverse product or service lines where overhead costs are material.
AI-powered procurement and spend analysis platforms.
AI-driven procurement tools can analyze spending patterns across thousands of transactions, identifying opportunities for consolidation, improved pricing, or better vendor terms. The intelligence these platforms generate would take a finance team months to produce manually. They are particularly effective in identifying material cost drift before it becomes a significant margin problem.
Digital twins and scenario modeling.
Digital twin technology allows organizations to simulate cost scenarios before committing to them. By modeling different resource allocation decisions or supply chain configurations, you can test the impact on your cost breakdown structure before spending a dollar. This is especially valuable in capital-intensive industries where investment decisions are difficult to reverse.
The common thread across all of these technologies is that they reduce the friction between real-world transactions and your understanding of cost. A good financial model built on a solid cost breakdown structure is the foundation that makes this technology investment worthwhile.
Common Mistakes to Avoid
Even experienced finance teams make errors in cost breakdown analysis. Here are the most common ones and what to do instead.
Confusing direct and indirect costs.
Misclassifying costs is a foundational error that distorts your understanding of true product or project economics. It leads to mispricing, inaccurate margin reporting, and strategic decisions built on flawed assumptions. Invest time upfront in establishing clear classification criteria and apply them consistently.
Assuming linear cost behavior.
Many teams assume that costs scale linearly with output. In reality, costs have complex behaviors that only become visible when you examine the data carefully. Some costs step up in increments as capacity thresholds are crossed. Others are driven by complexity rather than volume. A cost breakdown analysis that ignores these patterns will produce inaccurate estimates at non-standard production levels.
Treating cost estimates as fixed.
Cost estimates are living documents that should be revised as new information becomes available. Failing to update them as a project progresses is a project management failure that leads to surprises at completion. Establish a regular cadence for reviewing and refreshing your cost breakdown as execution proceeds.
Misusing contingency reserves.
Treating contingency as a default explanation for overruns rather than a managed reserve with clear drawdown criteria leads to budget overruns that appear unforeseeable but were actually preventable. Contingency should be released against specific risk events, not consumed incrementally as costs drift.
Failing to connect cost objectives to strategic goals.
Even a technically perfect cost breakdown analysis can fail to drive good decisions if the cost reduction targets it generates are not connected to what the business is actually trying to achieve. A 15 percent reduction in raw material costs means nothing if it requires a quality compromise that undermines customer retention.
Running the analysis once.
A cost breakdown analysis is most valuable as a continuous management practice rather than a one-time project. Build the analytical discipline, the tools, and the organizational habits that make it a recurring input to decision-making.
Frequently Asked Questions
What is the difference between a cost breakdown and a cost estimate?
A cost estimate projects what something will cost before it happens. A cost breakdown analysis dissects actual or projected costs into their component parts so you can understand the structure, not just the total.
How often should a business conduct a direct cost breakdown analysis?
For ongoing operations, a quarterly review is a reasonable baseline. For active projects, it should happen monthly or at key milestones. Any time there is a significant change in market conditions, supplier pricing, or operational structure, it is worth revisiting.
How does a direct cost breakdown analysis support cost reduction?
By revealing exactly where money is being spent and what is driving those costs, the analysis allows you to target cost reduction efforts precisely. A structured project budget template can help you compare estimates against actuals in real time.
Is a direct cost breakdown analysis useful for small businesses?
Absolutely. Small businesses often benefit most because they have fewer resources to absorb inefficiencies. Understanding your cost drivers clearly is even more critical when margins are tight and cash flow is the primary constraint.
What is the Cost Performance Index in Earned Value Management?
The Cost Performance Index is a ratio of earned value to actual cost. A CPI above 1.0 means you are getting more value per dollar spent than planned. Below 1.0 signals an over-budget condition relative to work completed.
How does direct cost breakdown analysis connect to financial modeling?
A well-constructed cost breakdown structure is the primary input to any meaningful financial model. Without accurate direct cost data, revenue projections and profitability forecasts are built on assumptions rather than evidence.
Conclusion
A direct cost breakdown analysis transforms vague financial concern into specific, actionable intelligence. It shows you exactly where your money goes, what is driving your costs, and where the real opportunities for savings and efficiency live.
Most businesses have more cost optimization potential than they realize. The challenge is not finding the savings. It is having the analytical clarity to see them.
The businesses that manage costs most effectively are not the ones that cut the hardest. They are the ones that understand their cost structure well enough to cut precisely, investing the savings back into the capabilities that drive competitive advantage.
If your business is ready to move from reactive cost management to proactive financial strategy, working with experienced financial leadership can accelerate that journey significantly. Oak Business Consultant offers CFO services and financial modeling designed to help growth-stage businesses build the financial systems, cost frameworks, and analytical clarity needed to compete and scale. Reach out to explore how their team can help you turn your cost data into a competitive advantage.