Highlighting the Importance of CAC and CLV
CAC to CLV ratio: the SaaS metric that decides whether you scale or stall
Most SaaS founders track Customer Acquisition Cost (CAC) and Customer Lifetime Value (CLV) as two separate line items on a dashboard. That is the mistake. On their own, neither number means much. A $500 CAC is a disaster for a $10 monthly plan and a bargain for a $2,000 enterprise contract. The number that actually tells you whether your growth is sustainable is the ratio between the two, and whether that ratio is improving or eroding quarter over quarter.
This matters more in 2026 than it did a few years ago. Paid acquisition costs have climbed steadily as ad platforms get more competitive and attribution gets murkier, so the businesses that survive are the ones that know exactly what a customer costs, what that customer is actually worth, and how the two numbers move together.
What CAC actually measures
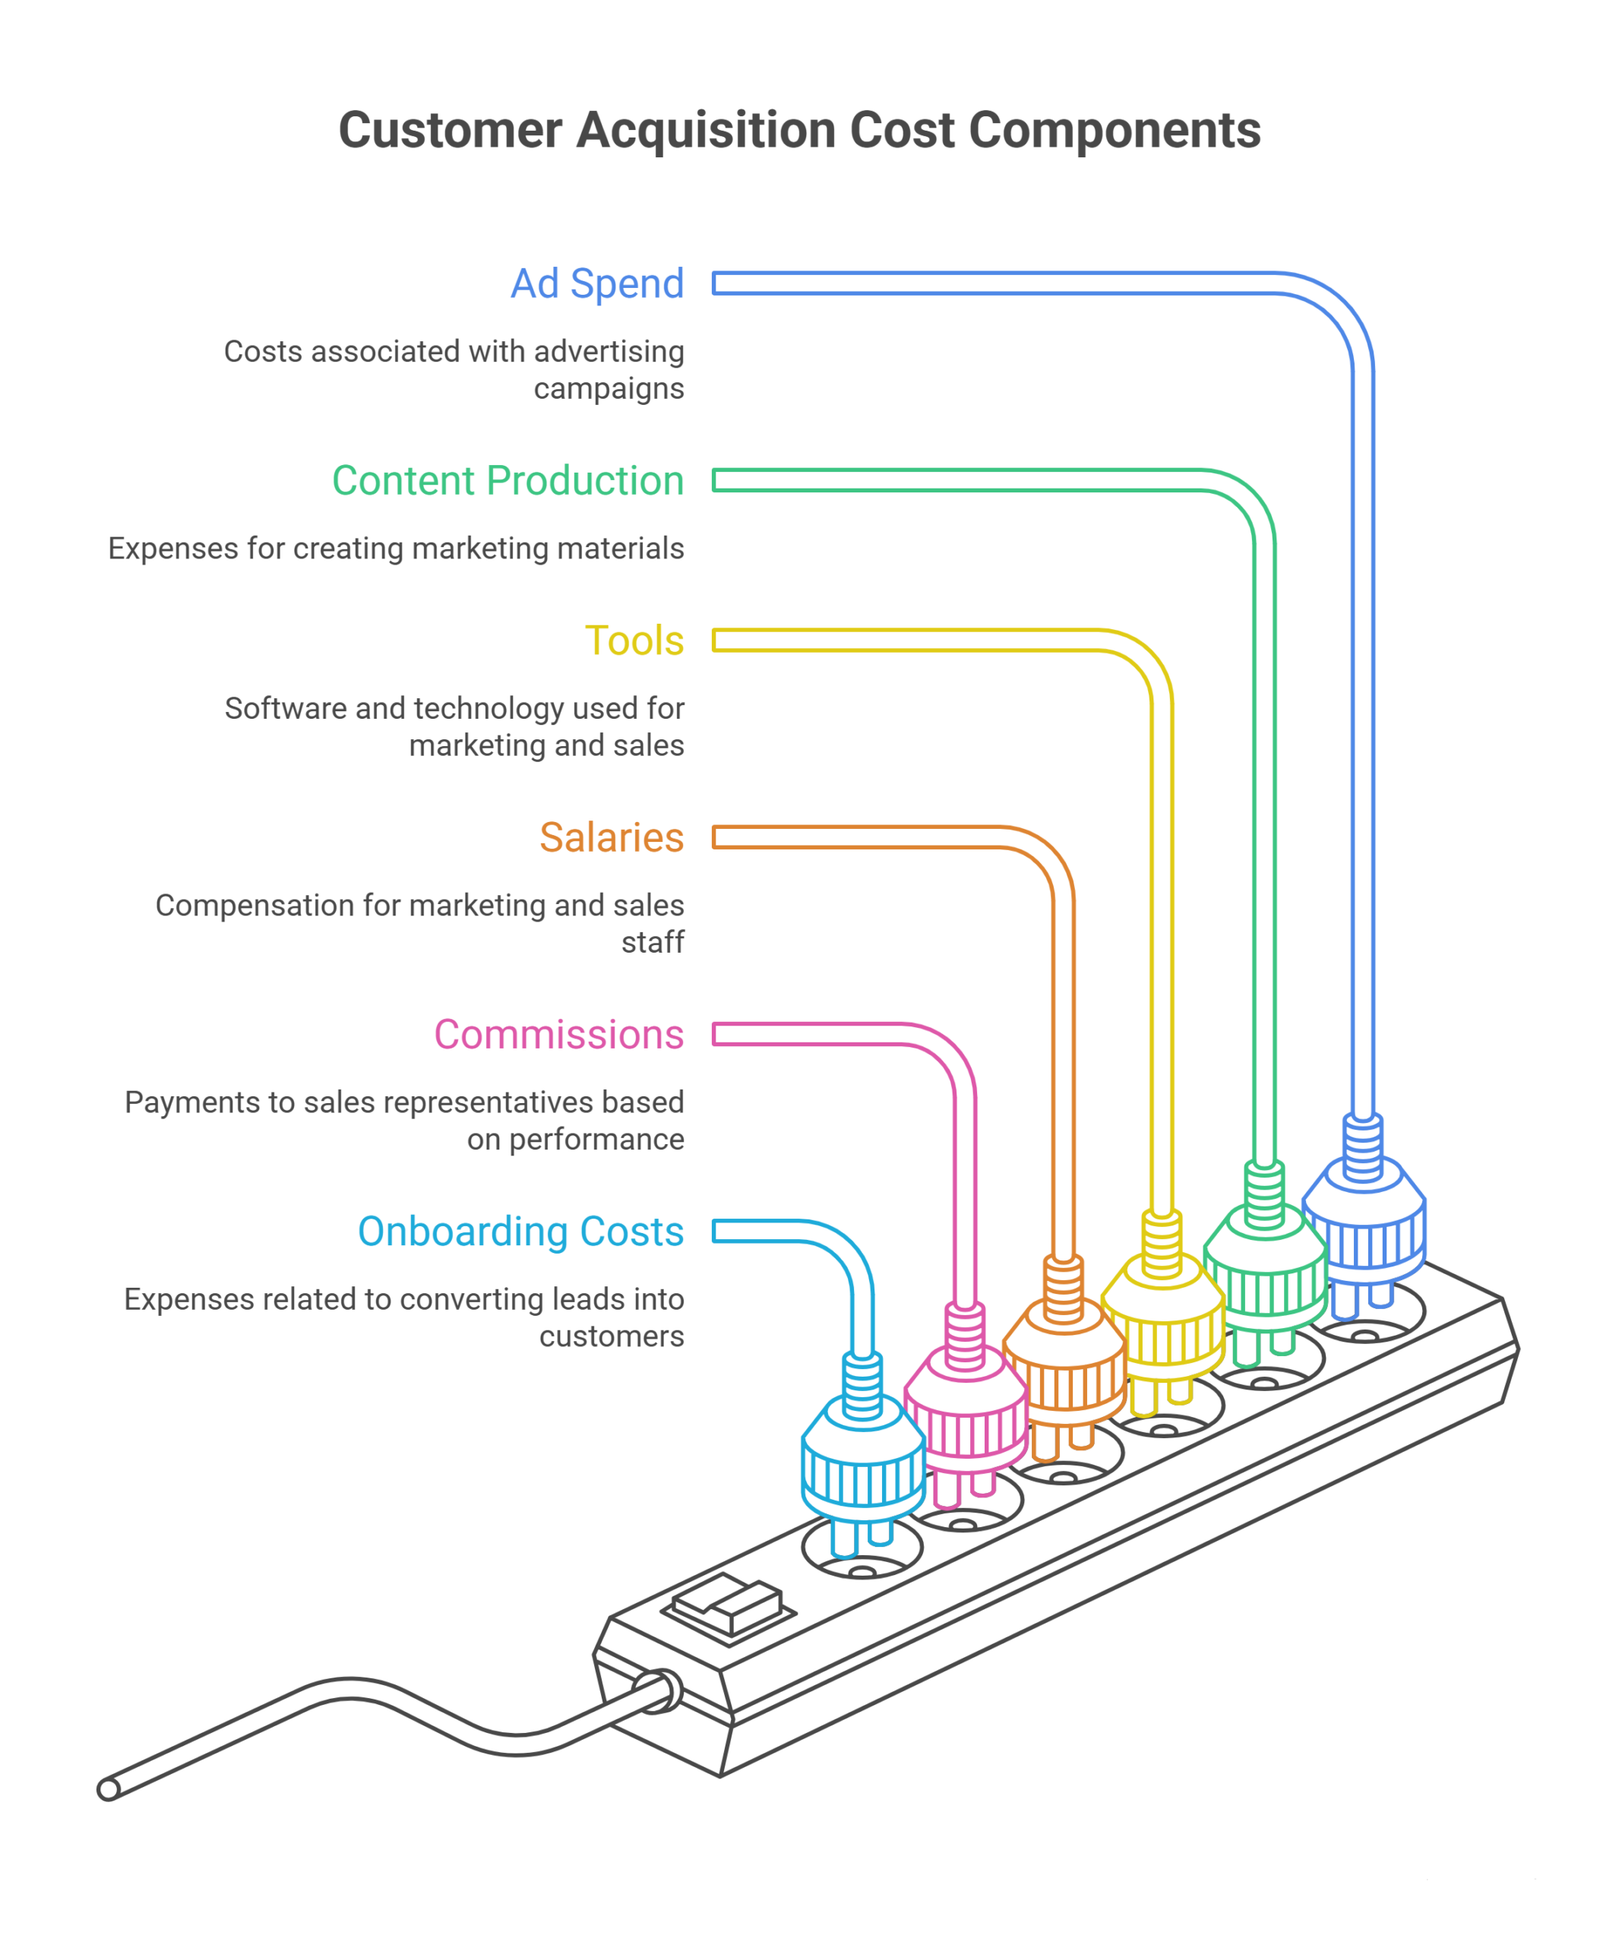
Customer Acquisition Cost is the total sales and marketing spend required to convert one lead into a paying customer, over a given period.
CAC = Total Sales & Marketing Spend ÷ Number of New Customers Acquired
The spend side should include everything: ad spend, content production, tools, salaries for marketing and sales staff, commissions, and onboarding costs tied to conversion. Leaving out salaries or onboarding is the single most common way founders understate CAC and end up with a ratio that looks healthier than it is.
Worked example: a SaaS company spends $120,000 on marketing and $180,000 on sales in a quarter and closes 60 new customers. CAC = $300,000 ÷ 60 = $5,000 per customer.
What CLV actually measures
Customer Lifetime Value is the total revenue a business expects to earn from a customer over the full relationship, adjusted for the cost of serving them.
CLV = Average Revenue Per User (ARPU) × Gross Margin × Customer Lifetime
Gross margin is calculated as (Revenue – Cost of Goods Sold) ÷ Revenue. Using raw revenue instead of gross-margin-adjusted revenue is the second most common calculation error, because it ignores hosting, support, and delivery costs and makes CLV look larger than the business can actually bank.
Customer lifetime itself is usually approximated from churn: Average Customer Lifetime = 1 ÷ Churn Rate. A company with 5% monthly churn has an average customer lifetime of 20 months; at 2% churn that stretches to 50 months.
Worked example: ARPU of $200/month, 80% gross margin, 4% monthly churn (25-month average lifetime). CLV = $200 × 0.80 × 25 = $4,000.
Why the CAC:CLV ratio matters more than either number alone
The ratio tells you how many dollars a customer returns for every dollar spent acquiring them. A 1:1 ratio means the business breaks even on acquisition and has nothing left for operations, product, or profit. Industry consensus across SaaS benchmarking puts the healthy range at 3:1 to 5:1, though the right target depends heavily on stage and go-to-market motion.
| Stage / segment | Typical CLV:CAC target | Notes |
| Pre-PMF (under $1M ARR) | 2:1 to 2.5:1 | Acceptable while still finding product-market fit |
| Early scaling ($1M-$10M ARR) | 3:1 to 4:1 | Should show clear direction toward sustainability |
| Scale stage ($10M-$50M+ ARR) | 3.8:1 to 5:1 | Investors treat below 3:1 as a red flag at this stage |
| Enterprise / long sales cycle | 3:1 to 4.5:1 | Higher absolute CAC offset by much higher CLV |
| Self-serve / PLG | 4:1 to 7:1 | Low CAC makes higher ratios normal, not a sign of under-investment |
A ratio far above 5:1 is not automatically good news. It often means the company is under-spending on acquisition and leaving market share on the table, since capital that could fund growth is sitting idle.
CAC payback period: the second half of the picture
The ratio tells you long-term efficiency, but payback period tells you how fast the business gets its cash back, which matters directly for runway. Payback period is calculated as CAC divided by monthly gross-margin-adjusted revenue per customer.
| Stage | Target payback period |
| Pre-PMF | 18-24 months |
| Early scaling | 12-18 months |
| Scale stage | 9-14 months |
| Public / late-stage | 9-12 months |
A strong CLV:CAC ratio built on a five-year customer lifetime assumption is far less reassuring if it takes two years to recover the acquisition cost. Both numbers need to be tracked side by side.
Why churn moves this ratio faster than anything else
Churn sits in the denominator of the customer lifetime calculation, so small changes swing CLV disproportionately. Using ARPU of $100 and 80% gross margin as a constant:
| Monthly churn rate | Average lifetime | CLV |
| 2% | 50 months | $4,000 |
| 4% | 25 months | $2,000 |
| 6% | 16.7 months | $1,333 |
| 10% | 10 months | $800 |
At 10% monthly churn, a $1,000 CAC no longer clears a healthy ratio at all. This is why retention work, not just acquisition spend, is usually the fastest lever a SaaS business has to improve its unit economics, since it improves the ratio without adding a single dollar to the marketing budget.
How to actually improve the ratio
Reduce CAC:
- Shift acquisition mix toward organic, SEO, and referral channels, which typically run 15-25% cheaper than paid channels once fully loaded
- Tighten ideal customer profile targeting so spend goes toward prospects who convert and stay, not just prospects who convert
- Shorten the sales cycle, since longer cycles compound cost through more touchpoints and higher SDR/AE time per deal
Increase CLV:
- Reduce churn through better onboarding, since time-to-first-value in the first 90 days is one of the strongest predictors of whether a customer renews
- Raise ARPU through usage-based tiers, upsells, or value-based pricing rather than cost-plus pricing
- Push expansion revenue from existing accounts, which is consistently cheaper than acquiring net-new logos and is the reason net revenue retention above 100% has become such a closely watched metric
- Fix involuntary churn from failed payments with retry logic and dunning management, since this is pure lost CLV that has nothing to do with product dissatisfaction
Tracking the underlying inputs consistently is what makes any of this actionable. A SaaS-specific KPI framework that ties CAC, CLV, churn, and MRR into one view is what turns these levers from theory into a monthly operating habit, and a proper KPI dashboard makes the ratio visible to the whole leadership team rather than buried in a spreadsheet.
Common mistakes that quietly distort this ratio
- Using revenue instead of gross margin for CLV. This overstates true profitability and hides the real cost of serving a customer.
- Mixing attribution models. Using first-touch attribution for CAC and last-touch for CLV analysis produces numbers that contradict each other.
- Excluding salaries or onboarding costs from CAC. This is the fastest way to make a struggling acquisition motion look healthy on paper.
- Reading the ratio as a single snapshot. A 3:1 ratio that is declining quarter over quarter is a different situation than a stable 3:1, even though the number looks identical today.
Tracking these figures alongside broader SaaS financial metrics such as MRR and bookings gives a fuller picture than watching CAC and CLV in isolation, and reviewing marketing spend against ROI by channel catches inefficiencies before they distort the blended number.
Frequently Asked Questions
What is a good CAC to CLV ratio for a SaaS company?
Most SaaS businesses aim for 3:1 to 5:1. Below 3:1 signals acquisition spend is not being recovered fast enough; well above 5:1 can mean the business is under-investing in growth.
How do you calculate CLV if the company is only a year old?
Use the churn-based approximation (Average Lifetime = 1 ÷ Churn Rate) with whatever churn data exists, even a few months of it, and revisit the estimate as more cohort data accumulates. Early-stage estimates are always noisy, so payback period should carry more weight than the ratio until the business has 12-18 months of retention history.
Does CAC include salaries?
Yes. A complete CAC figure includes marketing spend, sales salaries and commissions, tools, and onboarding costs directly tied to conversion. Leaving these out understates CAC.
Why does a very high CLV:CAC ratio not always mean the business is doing well?
A ratio well above 5:1 often means the company is spending too conservatively on acquisition relative to how valuable its customers are, leaving growth on the table that competitors with a lower, more aggressive ratio are capturing instead.
How often should this ratio be recalculated?
Monthly or quarterly. CAC shifts with channel mix and ad costs, and CLV shifts as churn and pricing change, so a ratio calculated once a year can be badly out of date by the time it is reviewed again.
What is the fastest way to improve a weak ratio?
Reducing churn usually moves the ratio faster than cutting acquisition spend, because customer lifetime sits in the denominator of the churn formula and small improvements compound into large CLV gains.
Conclusion
CAC and CLV are only useful together, and getting either one wrong, through misattributed costs, revenue-based CLV, or stale churn assumptions, produces a ratio that looks fine right up until it doesn’t. Before increasing acquisition spend, it is worth confirming the underlying numbers are being tracked consistently and the ratio reflects where the business actually stands today, not where it stood a year ago.
Our CFO services for SaaS companies are built around exactly this: tracking CAC, CLV, churn, and recurring revenue accurately so growth decisions are based on real unit economics rather than an outdated spreadsheet. Book a call to see how your current ratio compares to where it should be at your stage.