Essentials of Financial Analysis
The building blocks of financial analysis: statements, ratios, and how they fit together
Financial analysis gets talked about in terms of why it matters: better decisions, fewer surprises, stronger investor confidence. That is true, but it skips the more practical question most people actually need answered first. What is financial analysis actually made of? Which statement do you start with, which ratios come from which document, and how do the pieces connect into a single, coherent read on a company’s health? This is a working guide to those building blocks.
The three statements everything else is built on
Every financial analysis, no matter how sophisticated it eventually gets, starts with the same three documents, the same three financial reporting outputs a business already produces for compliance and management purposes.
The income statement shows revenue, expenses, and profit over a period of time. It answers whether the business made money, and how efficiently it converted sales into profit after costs.
The balance sheet is a snapshot at a single point in time. It lists what a company owns (assets), what it owes (liabilities), and what is left over for the owners (equity). It answers whether the business is solvent and how it is financed.
The cash flow statement tracks actual cash moving in and out, split into operating, investing, and financing activities. It answers a question the income statement cannot: whether the business is actually generating cash, since profit on paper and cash in the bank are not the same thing.
Reading any one of these in isolation gives an incomplete picture. A company can show a healthy income statement while its cash flow analysis reveals it is burning through reserves to stay afloat, which is exactly the kind of gap financial analysis exists to catch.
Who actually reads these numbers, and why it changes the analysis
The same three statements get read differently depending on who is asking. A bank evaluating a loan application cares most about liquidity and coverage: can this business pay what it owes, on time, out of cash it actually has. An investor weighing a stake cares more about profitability and growth trends over several periods, since a single strong quarter says less than a consistent pattern.
Internal management reads the same numbers for a third reason: to decide where to cut costs, where to invest, and whether a growth plan is actually fundable. None of these audiences are wrong. They are just asking different questions of the same three documents, which is part of why a single ratio in isolation rarely settles anything on its own.
The five ratio categories that turn statements into analysis
Ratios are what turn three static documents into an actual analysis. Most financial analysis training covers four core categories, but a fifth, market value ratios, matters too once a business is raising capital, courting a buyer, or benchmarking against public comparables.
| Category | Question it answers | Key ratios | Where the inputs come from |
| Liquidity | Can the business cover what it owes in the next 12 months? | Current ratio, quick ratio | Balance sheet |
| Profitability | How efficiently does the business turn revenue into profit? | Gross margin, net profit margin, return on equity | Income statement, balance sheet |
| Leverage (solvency) | How dependent is the business on borrowed money? | Debt-to-equity ratio, interest coverage ratio | Balance sheet, income statement |
| Efficiency | How well does the business use its assets to generate revenue? | Inventory turnover, accounts receivable turnover, asset turnover | Income statement, balance sheet |
| Market value | What is the business worth relative to its earnings or assets? | Price-to-earnings, price-to-book, EV/EBITDA | Income statement, balance sheet, market data |
Market value ratios depend on a market price, so for a privately held small business there usually isn’t a stock quote to plug in. They still matter earlier than most owners expect: they’re the backbone of how a business valuation gets built when a company is preparing to sell, bring on investors, or benchmark itself against a public comparable in its industry.
Example
Here’s how one of these ratios actually gets calculated, using the net profit margin as an example. Say a business reports $850,000 in revenue and $102,000 in net income for the year. Net profit margin equals net income divided by revenue, so $102,000 divided by $850,000 works out to 12%. That means the business keeps 12 cents of every dollar in sales as profit after all expenses, taxes, and interest are paid. On its own, 12% doesn’t mean much. Compared against last year’s margin, or against the margin a competitor in the same industry reports, it starts to say something.
No single ratio tells the full story, and this is where a lot of informal financial analysis goes wrong. A business can show strong profitability and still fail a liquidity test if too much of its profit is tied up in unpaid invoices or slow-moving inventory. Reading these categories together, rather than picking one favorite metric, is what separates a real analysis from a spot check.
Horizontal and vertical analysis: two ways to read the same statement
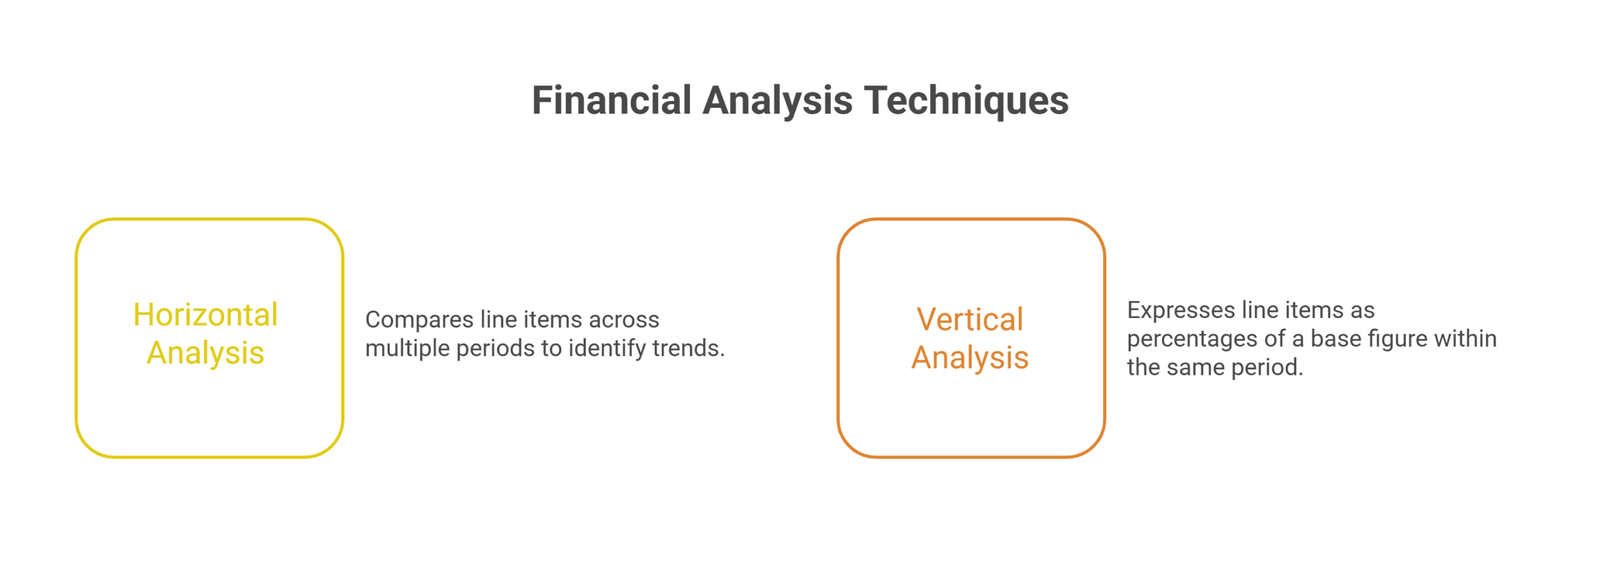
Beyond ratios, there are two core techniques for reading any single statement, and most professional financial analysis uses both.
Horizontal analysis compares the same line item across multiple periods, such as revenue this year against revenue last year, to spot trends and growth patterns. It answers: is this getting better or worse over time?
Vertical analysis expresses each line item as a percentage of a base figure within the same period, typically total revenue on the income statement or total assets on the balance sheet. When a statement is rewritten this way, with dollar amounts replaced by percentages, it’s often called a common-size statement, and it answers a different question: how is this business structured right now, and how does that structure compare to a competitor of a different size?
Used together, horizontal and vertical analysis let an analyst see both the trajectory of a business and its current shape, without needing to compare raw dollar figures that can be misleading across companies of different sizes.
Why cash flow gets analyzed on its own terms
Cash flow deserves separate treatment because it is where most business failures actually originate, even when the income statement looks fine. A cash flow analysis typically breaks activity into three buckets: cash from operations, cash used in or generated by investing activities, and cash from financing activities like loans or capital raises.
The operating cash flow figure in particular deserves close attention, since it strips out the accounting adjustments that can make a business look profitable on the income statement while it is actually short on real cash. A business with strong net income but negative operating cash flow, quarter after quarter, is showing a warning sign that a profitability ratio alone would miss entirely. This is also usually the first place an outsourced CFO will look when a founder says the business “feels” fine but the bank balance tells a different story.
Putting it together: a basic financial analysis workflow
A financial analysis, at a practical level, tends to follow a consistent sequence:
Gather accurate, current statements. Analysis built on outdated or incomplete financial reports produces conclusions that do not hold up, regardless of how sound the ratio math is.
Run horizontal analysis first. Establish the trend before diving into any single period, so a single unusual quarter does not get mistaken for a pattern.
Run vertical analysis to understand structure. Compare the resulting percentages against industry norms, not just against the company’s own history.
Calculate ratios across all five categories where they apply. Liquidity, profitability, leverage, and efficiency for every business, and market value ratios once a sale, raise, or public comparison is on the table.
Cross-check against cash flow. Confirm that a profitable-looking business is also cash-generative, since these two pictures can diverge.
Interpret with context. A ratio that looks weak in isolation may be normal for the industry, the season, or the company’s growth stage. Numbers without context produce false alarms as often as they produce real insight, which is why this workflow feeds directly into ongoing financial planning rather than sitting as a one-off report.
Where ratio analysis falls short
Ratio analysis is genuinely useful, but it has real limits worth knowing before leaning on it too heavily.
It’s backward-looking by nature. Every ratio is calculated from statements that summarize a period that has already closed, so it describes where a business has been, not necessarily where it’s headed.
It’s industry-dependent in ways that trip people up. A current ratio of 1.2 might be perfectly healthy for a retailer with fast inventory turnover and a warning sign for a construction firm carrying long project cycles. Comparing a ratio to a generic “good” benchmark, rather than an industry-specific one, produces the wrong read more often than it should.
It can be distorted by seasonality. A ski resort’s ratios will look very different in July than in January, and comparing either to a non-seasonal period, rather than to the same season a year earlier, will make a perfectly normal business look like it’s over- or underperforming.
Common mistakes when getting started
Analyzing one statement in isolation. The income statement alone cannot tell you if a company is solvent, and the balance sheet alone cannot tell you if it is profitable. Each statement answers a different question, and skipping any one of them leaves a gap.
Comparing ratios without an industry benchmark. As noted above, the same ratio can mean opposite things in two different industries. Ratios only mean something in context.
Ignoring one-time or non-recurring items. A one-off asset sale or a lawsuit settlement can distort a single period’s numbers significantly. A careful analysis flags and adjusts for these rather than treating every number as equally representative of ongoing performance.
Treating financial analysis as a single event. A one-time analysis captures a moment. The real value comes from repeating the process on a consistent cadence and comparing results period over period, which is what turns financial analysis into an early warning system rather than a retrospective report card.
Frequently Asked Questions
What is the difference between horizontal and vertical analysis?
Horizontal analysis tracks how a single line item changes over time. Vertical analysis expresses each line item as a percentage of a base figure within one period, producing what’s often called a common-size statement, which shows the structure of the business at that moment.
Which ratio category matters most when starting out?
Liquidity and profitability are usually the first two worth tracking, since they answer the most immediate questions: can the business pay its bills, and is it actually making money. Leverage and efficiency become more important as the analysis matures, and market value ratios generally only become relevant once a sale, raise, or public benchmark enters the picture.
How often should ratios be recalculated?
Monthly for liquidity and cash flow indicators, and at least quarterly for the full set of ratios, so trends can be caught early rather than discovered after they have compounded.
Is financial analysis different for a small business than for a large company?
The core statements and ratio categories are the same. What differs is the benchmark, since small businesses are typically compared against similarly sized peers in their industry rather than large public companies, and market value ratios usually matter less until a transaction is on the horizon.
Can financial analysis be done without accounting software?
Yes, though it becomes harder to maintain accuracy and consistency at scale. Basic financial analysis only requires accurate statements and the discipline to calculate and track ratios over time, but purpose-built tools reduce the risk of manual error as the volume of data grows.
Conclusion
Financial analysis is not one technique but a set of building blocks: three statements, five ratio categories, and two ways of reading trends and structure, all used together rather than in isolation. Once those pieces are in place, the process becomes repeatable, and a repeatable process is what actually catches problems early rather than explaining them after the fact.
If you want these building blocks assembled into an ongoing practice rather than a one-time exercise, Oak’s fractional CFO services can set up the statements, ratios, and reporting cadence your business needs. For businesses whose biggest blind spot is cash rather than profit, a dedicated cash flow analysis is often the fastest way to close that gap.