Writing a Financial Analysis Report: Tips and Tools for Success
What Is a Financial Analysis Report?
A financial analysis report is a structured document that evaluates a company’s financial health by examining its income, expenses, assets, liabilities, cash flows, and equity. It translates raw numbers from financial statements into meaningful insights that inform investment decisions, strategic planning, and operational improvements.
Unlike standard accounting records, a financial analysis report does not merely present data. It interprets data. It tells the story behind the numbers: whether the business is growing sustainably, where risks are accumulating, and whether the company’s valuation reflects its true worth.
Investors, lenders, board members, and executive teams rely on these reports to answer three fundamental questions:
- Is this business financially healthy today?
- Is it generating and managing cash effectively?
- Does its trajectory justify continued or increased investment?
For founders and CFOs, producing a credible financial analysis report is not optional. It is a baseline expectation when engaging with any serious capital provider or strategic partner. Our Financial Modeling Services are designed to help businesses meet that standard with precision.
Why Every Business Needs One
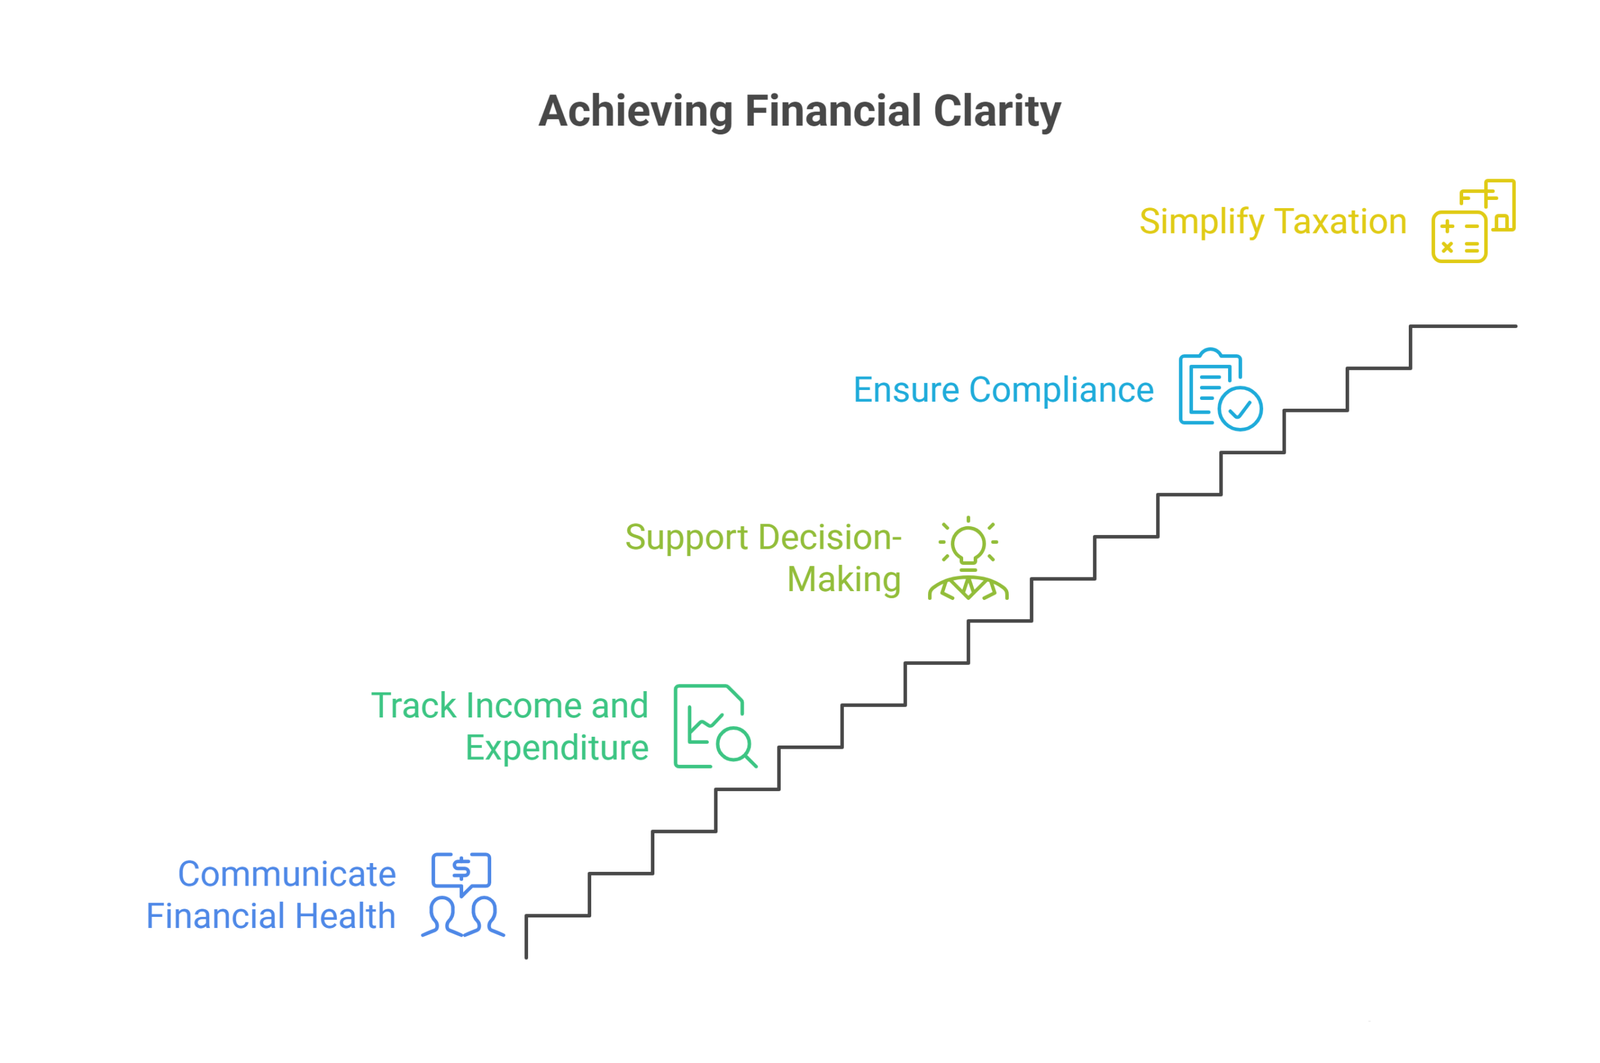
Communicating Financial Health to Stakeholders
Every high-ranking member of an organization, from investors and board members to senior leadership, needs an accurate picture of the company’s financial position. A financial analysis report creates that shared picture. It consolidates performance data, benchmarks results against peers, and flags emerging risks before they become crises.
When you communicate transparently through structured financial reports, you demonstrate governance maturity. That maturity builds investor confidence. It also creates the internal alignment needed to allocate resources strategically and move quickly when opportunities arise.
Tracking Income and Expenditure
A financial analysis report is the most reliable instrument for tracking where money enters and exits the business. Understanding expenditure patterns at a granular level is essential before building any effective budget or debt management plan. Our Budgeting Consultants help businesses design budgeting frameworks that integrate seamlessly with financial reporting cycles.
Supporting Decision-Making
Financial reports contain historical performance data, major expenditure categories, and trend indicators that feed directly into financial projections. When leadership uses this data to model future scenarios, decisions around hiring, expansion, capital expenditure, and pricing become evidence-based rather than intuition-driven.
Ensuring Compliance
Regulatory bodies in most jurisdictions require businesses to maintain and submit accurate financial records. In the United States, both private and public companies must adhere to GAAP (Generally Accepted Accounting Principles). International businesses primarily report under IFRS (International Financial Reporting Standards). Our Accounting and Bookkeeping Services ensure your records meet the standards required by both frameworks before a report is ever written.
Simplifying Taxation
Accurate financial reports reduce the risk of errors in tax filings by consolidating all financial data in one place. The IRS and equivalent authorities use financial statements to assess corporate tax obligations. Financial Reporting Services that are maintained consistently throughout the year make tax season significantly less burdensome.
Key Components of a Financial Analysis Report
A well-constructed financial analysis report contains the following core elements:
| Component | Purpose |
| Business Overview | Provides context on the company, its industry, and competitive positioning |
| Income Statement Analysis | Evaluates revenue quality, gross margin, and net profitability trends |
| Balance Sheet Analysis | Assesses asset quality, liability structure, and equity position |
| Cash Flow Analysis | Measures liquidity and the sustainability of operations, investments, and financing |
| Ratio Analysis | Quantifies performance across liquidity, profitability, efficiency, and leverage dimensions |
| Valuation Section | Determines the company’s worth using DCF, relative, or book value methods |
| Risk Assessment | Identifies factors that could impair the company’s projected value or performance |
| Projected Financial Statements | Provides forward-looking pro-forma models based on realistic assumptions |
| Concluding Remarks | Synthesizes findings into an actionable recommendation |
The Core Sections of Financial Analysis Report Explained
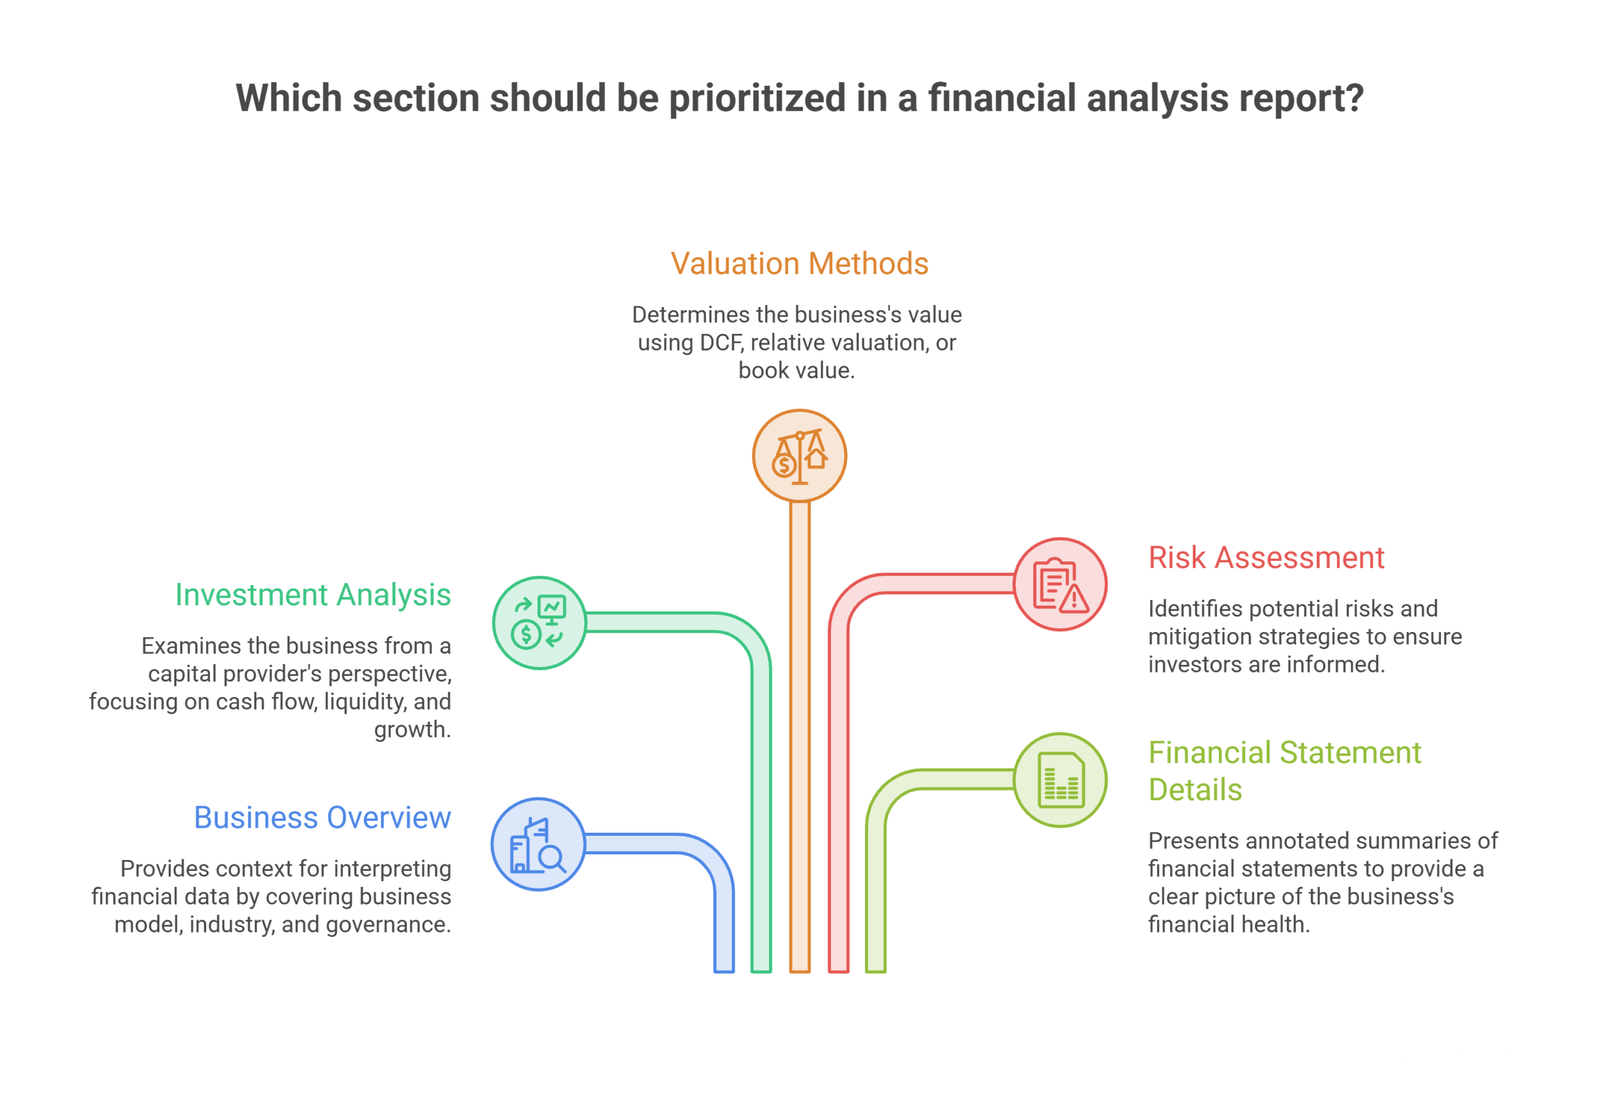
Business Overview
Begin every financial analysis report with a company summary. This section establishes the context an external reader needs to evaluate the financial data that follows. It should cover the business model, industry dynamics, competitive landscape, and any material governance or ownership structures.
This information is typically available in quarterly or annual reports. The goal is not to describe the business for its own sake but to establish the lens through which the financial results should be interpreted. A 15% gross margin that looks weak in SaaS might be strong in commodity distribution. Context changes everything.
Investment Analysis
The investment section examines the business through the eyes of a prospective capital provider. It covers:
- Cash flow position and runway
- Liquidity ratios and working capital trends
- Debt levels and debt service coverage
- Historical revenue growth and gross margin trajectory
- Inventory turnover and Return on Investment
- Forecasts for each of the above
This section should reference historical financial patterns to substantiate forward-looking projections. The more rigorously you anchor forecasts to actual performance data, the more credible the investment case becomes.
Valuation Methods
Valuation is one of the most consequential sections of any financial analysis report. Three standard approaches exist, each suited to different business types and circumstances:
Discounted Cash Flow (DCF) Analysis
DCF calculates the present value of projected future cash flows using a discount rate that reflects the risk profile of the business. This method is most appropriate when the company has stable, predictable cash generation. The DCF approach is sensitive to assumptions about growth rates and discount rates, so those inputs should be justified carefully. Our NPV Calculator can assist in modelling present value scenarios.
Relative Valuation
Relative valuation compares the company’s key financial metrics — most commonly the price-to-earnings (P/E) ratio or EV/EBITDA — against those of comparable companies or industry benchmarks. This approach is useful when market comparables are abundant and the business operates in a sector with established valuation norms.
Book Value
Book value compares the company’s net asset value (total assets minus total liabilities) against its current stock or equity price. This method helps identify whether a business is trading at a premium or discount to its intrinsic asset base. It is most relevant for asset-heavy businesses such as real estate, manufacturing, or financial services.
Risk Assessment
Every financial analysis report must include a dedicated risk section. Investors need to understand what could prevent the company from reaching its projected value, and they need to see evidence that management has thought rigorously about those scenarios.
A credible risk assessment covers:
- Market and competitive risks (pricing pressure, new entrants, demand shifts)
- Operational risks (supply chain dependencies, talent concentration, technology failure)
- Financial risks (liquidity constraints, interest rate exposure, currency risk)
- Regulatory and compliance risks (tax changes, licensing requirements, data privacy obligations)
- Intellectual property risks (expiry of patents, loss of proprietary advantages)
Each risk should be documented, assigned an owner, given a probability and impact rating, and paired with a mitigation strategy. Our Business Valuation Services include a structured risk modeling component that addresses this requirement in detail.
Financial Statement Details
The details section grounds the analysis in the underlying financial statements. Include annotated summaries of:
- Income Statements: Focus on revenue quality, cost structure trends, and operating leverage.
- Balance Sheets: Highlight changes in working capital, fixed assets, and long-term debt.
- Cash Flow Statements: Examine operating, investing, and financing cash flows separately. The Cash Flow Analysis conducted at this stage is critical for assessing whether reported profits translate into real liquidity.
Supplement these summaries with ratio tables, trend charts, and comparative benchmarks. The goal is to give readers a complete and honest picture of the business without requiring them to interpret raw financial statements themselves.
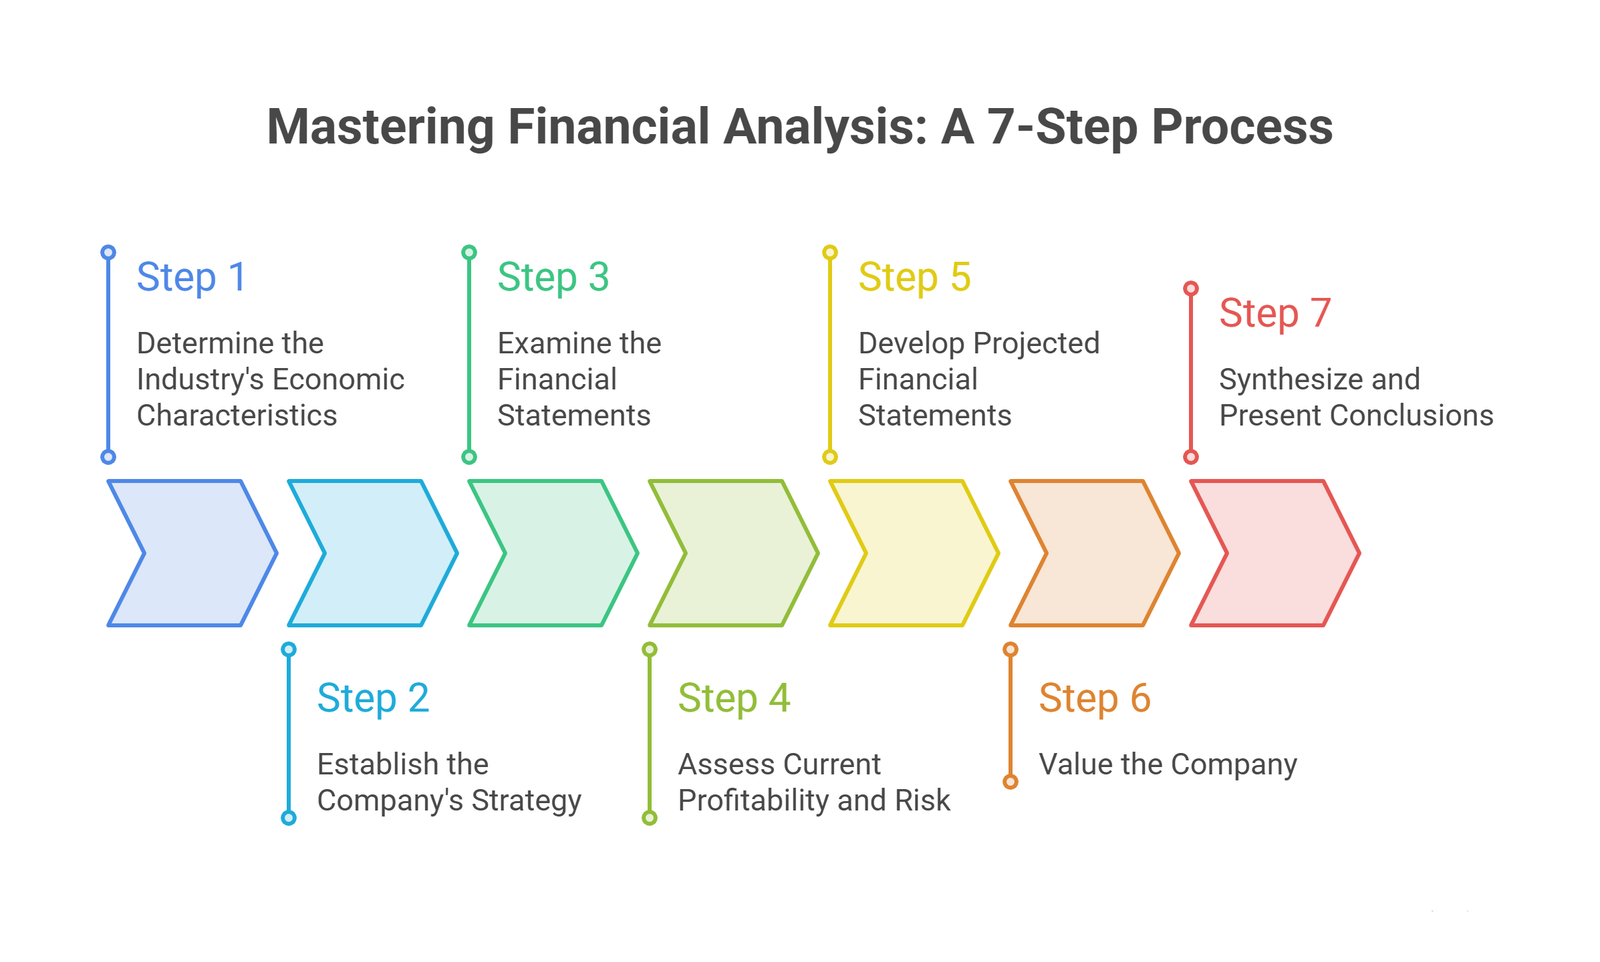
How to Write a Financial Analysis Report in 7 Steps
Every financial expert must be equipped to assess a company’s financial statements rigorously. That process demands mastery of three domains: the format of financial statements, the economic characteristics of the industry, and the competitive strategies the company employs.
With that foundation in place, here is the seven-step process:
Step 1: Determine the Industry’s Economic Characteristics
Begin with an industrial value chain analysis. Understand how the company designs, produces, and delivers its products or services relative to the broader industry. Use frameworks like Porter’s Five Forces to evaluate competitive intensity, bargaining dynamics, and structural profitability.
This context determines which financial metrics matter most. A capital-light services firm is evaluated on EBITDA margins and revenue per employee. A capital-intensive manufacturer is evaluated on asset turns and return on invested capital.
Step 2: Establish the Company’s Strategy
Evaluate the competitive positioning of the business. How does it differentiate? Is it competing on cost leadership, product uniqueness, or customer experience? Assess brand loyalty, pricing power, supply chain integration, geographic diversification, and cost management discipline.
Strategy shapes the financial profile of the business. A high-growth strategy produces very different financial statements from a mature, margin-focused business. Understanding which game the company is playing makes it possible to evaluate whether the financial results are consistent with the stated strategy.
Step 3: Examine the Financial Statements
Review the three primary financial statements in the context of applicable accounting standards:
- Balance Sheet: Are asset valuations appropriate? Are liabilities fully disclosed? Does the balance sheet accurately reflect the company’s economic position?
- Income Statement: What is the quality of revenues? Are margins sustainable? Are there non-recurring items distorting profitability?
- Cash Flow Statement: Is the company converting earnings into cash? What is driving changes in working capital? The examination of the cash flow statement reveals the real funding dynamics that the income statement alone cannot show.
Step 4: Assess Current Profitability and Risk
This is where financial analysts add the most value. Apply a structured set of financial ratios across five dimensions: liquidity, asset management, profitability, financial leverage, and market/risk metrics.
Evaluate return on assets independently of the capital structure, then assess return on equity from the owners’ perspective. Decompose return ratios into their component drivers (profit margin, asset turnover, financial leverage) using the DuPont framework. Compare every ratio against prior periods, peer companies, and industry benchmarks.
Step 5: Develop Projected Financial Statements
Build pro-forma financial statements that model the company’s future performance. The percentage-of-sales method is the most commonly used projection methodology for income statement line items. Balance sheet projections should tie directly to the income statement through working capital and capital expenditure assumptions.
The quality of projections depends entirely on the quality of the assumptions behind them. Every material assumption — revenue growth rate, gross margin, capex intensity, working capital days — should be documented and benchmarked against historical performance and industry norms.
Step 6: Value the Company
Apply one or more valuation methodologies to arrive at an equity value range. DCF analysis anchored to your projected cash flows is typically the primary method. Relative valuation using trading comparables or transaction multiples provides a useful cross-check. Accounting-based measures such as Economic Value Added (EVA) can supplement both.
Present a valuation range rather than a single point estimate, and be transparent about the sensitivity of your conclusions to key assumptions.
Step 7: Synthesize and Present Conclusions
After completing the full analysis, write a concise concluding section that captures your overall assessment of the business. Confirm whether the company is financially sound, identify the most significant opportunities and risks, and state clearly whether the evidence supports the investment or financing case being made.
Back every conclusion with specific data points from the analysis. Vague commentary undermines the credibility of the entire report. Precision and intellectual honesty are what separate a professional financial analysis from a promotional document.
Financial Ratios Every Report Should Include
The following ratio table captures the key metrics that belong in any credible financial analysis report:
| Category | Ratio | Formula | What It Measures |
| Liquidity | Current Ratio | Current Assets / Current Liabilities | Ability to cover short-term obligations |
| Liquidity | Quick Ratio | (Current Assets – Inventory) / Current Liabilities | Liquid coverage excluding inventory |
| Profitability | Gross Margin | (Revenue – COGS) / Revenue | Core product or service profitability |
| Profitability | Net Profit Margin | Net Income / Revenue | Overall earnings efficiency |
| Profitability | Return on Assets (ROA) | Net Income / Total Assets | Asset utilization efficiency |
| Profitability | Return on Equity (ROE) | Net Income / Shareholders’ Equity | Return generated for equity owners |
| Efficiency | Asset Turnover | Revenue / Total Assets | Revenue generation per dollar of assets |
| Efficiency | Inventory Turnover | COGS / Average Inventory | How quickly inventory converts to sales |
| Efficiency | Days Sales Outstanding | Accounts Receivable / (Revenue / 365) | Average collection period |
| Leverage | Debt-to-Equity | Total Debt / Shareholders’ Equity | Financial risk from debt financing |
| Leverage | Interest Coverage | EBIT / Interest Expense | Ability to service debt from operations |
| Valuation | P/E Ratio | Market Price per Share / EPS | Market premium over earnings |
| Valuation | EV/EBITDA | Enterprise Value / EBITDA | Whole-company valuation multiple |
Compliance and Regulatory Considerations
Financial analysis reports must be grounded in data that complies with the appropriate accounting framework for your jurisdiction and investor base.
GAAP (Generally Accepted Accounting Principles) applies to US-based companies and governs how financial statements must be prepared and presented. GAAP emphasizes rules-based consistency across periods and entities.
IFRS (International Financial Reporting Standards) governs financial reporting for companies in over 140 countries. IFRS is more principles-based and allows greater management judgment in certain areas, particularly around asset measurement and revenue recognition.
Key compliance considerations for your financial analysis report include:
- Revenue recognition policies and whether they comply with ASC 606 (GAAP) or IFRS 15
- Lease accounting under ASC 842 or IFRS 16, which significantly impacts balance sheet leverage ratios
- Impairment testing for goodwill and intangible assets
- Segment reporting requirements for diversified businesses
- Related-party transaction disclosures
For businesses operating in the UAE, corporate tax compliance under the UAE Corporate Tax regime adds another layer of reporting obligation. Our Corporate Tax UAE Services ensure that your financial reports meet local regulatory requirements without exposing the business to unnecessary tax risk.
Common Mistakes to Avoid
Even experienced finance teams make preventable errors when preparing financial analysis reports. The most consequential ones to watch for:
Over-relying on historical data without contextualizing it. Past performance is relevant, but markets, competitors, and business models evolve. Always situate historical data within the current strategic and economic context.
Ignoring cash flow in favor of profitability. A business can report strong net income while burning through cash. A financial analysis report that does not interrogate cash conversion quality is incomplete.
Presenting a single-point valuation without sensitivity analysis. Valuations are inherently uncertain. Presenting a range of outcomes under different scenarios is more credible and more useful to decision-makers.
Failing to disclose assumptions. Every projection is built on assumptions. Hiding them undermines trust. Disclosing them invites informed challenge, which improves the quality of conclusions.
Inconsistent ratio definitions. Industry databases and financial publications define certain ratios differently. Specify your formula for every ratio you report and use that formula consistently throughout the document.
Omitting risk documentation. Risk sections that are vague or limited to boilerplate disclosures do not serve investors. A credible risk assessment names specific risks, quantifies their potential impact, and explains the mitigation approach.
Tools and Software for Financial Analysis
The quality of a financial analysis report depends partly on the tools used to compile and model the underlying data. The most widely used categories include:
Spreadsheet-Based Financial Models
Excel remains the dominant platform for financial modeling in professional services. A well-constructed Excel model provides full transparency into assumptions, calculations, and outputs. Our Financial Model Templates provide pre-built, professionally structured Excel frameworks for a wide range of industries and use cases.
FP&A Software
Dedicated financial planning and analysis platforms such as Anaplan, Adaptive Insights, and Planful automate data consolidation and allow real-time scenario modeling at scale. These tools are most valuable for mid-sized to enterprise businesses managing complex multi-entity or multi-currency reporting.
Business Intelligence Platforms
Tools like Power BI and Tableau translate financial data into visual dashboards that make trends and anomalies immediately visible. Our KPI Dashboard Excel templates provide a starting point for businesses that want structured performance visibility without committing to a full BI implementation.
Accounting Platforms
QuickBooks, Xero, and NetSuite generate the underlying financial data that feeds into a financial analysis report. The quality and consistency of your bookkeeping directly determines the reliability of your analysis. Businesses that maintain clean, reconciled accounts throughout the year produce more credible and faster analysis at period-end.
Valuation Calculators
For specific analytical tasks within a financial report, purpose-built calculators accelerate the work significantly. Our NPV Calculator and Loan Amortization Calculator are publicly accessible tools that support common financial analysis calculations.
Frequently Asked Questions
What is the difference between a financial report and a financial analysis report?
A financial report presents raw financial data (income statements, balance sheets, cash flow statements). A financial analysis report interprets that data, evaluating performance, identifying trends, assessing risks, and making recommendations.
How often should a financial analysis report be prepared?
Most businesses prepare financial analysis reports quarterly and annually. Companies with active investor relationships or rapidly changing financial conditions may produce monthly analysis.
What financial statements are required to write a financial analysis report?
You need the income statement, balance sheet, and cash flow statement at minimum. Supporting schedules including accounts receivable aging, debt maturity schedules, and capital expenditure details improve the depth of the analysis.
What is the most important section of a financial analysis report?
There is no single most important section; the report works as an integrated whole. That said, the cash flow analysis and valuation sections typically receive the greatest scrutiny from investors, as they most directly address return potential and downside risk.
What is the role of ratio analysis in a financial analysis report?
Ratio analysis translates absolute financial figures into relative measures that can be benchmarked against prior periods and comparable companies. Ratios cover liquidity, profitability, operational efficiency, and financial leverage. They are the primary analytical tool for identifying strengths, weaknesses, and anomalies in a company’s financial performance.
Conclusion
A financial analysis report is more than a compliance obligation; it is the ultimate strategic mirror that translates raw accounting data into the structural truth behind your company’s growth, cash efficiency, and true market valuation. By transforming historical statements into boardroom-ready foresight, this document replaces intuition with evidence-based decision-making for founders, investors, and lenders alike.
Raw numbers won’t close a funding round or convince a board. You need a defensible narrative backed by expert financial engineering.
If your team lacks the time or specialized resources to build pro-forma models, run complex ratio analyses, or defend an institutional-grade valuation, let us do the heavy lifting. At Oak Business Consultant, we specialize in helping global executives turn financial complexity into strategic clarity. Partner with our advisory specialists to secure the institutional insight, custom modeling, and diagnostic clarity you need to move decisively. Schedule a free consultation with our financial advisory team.