14 Things You Should Include In Your Weekly Sales Activity Report
Weekly Sales Activity Report, What to Include?
If you manage a sales team, you already know the weekly report is one of those things that can either clarify everything or say nothing at all. Too many teams fill pages with numbers that look impressive but don’t actually tell anyone what’s working, what’s broken, or where the pipeline is leaking.
This guide covers the 14 most important things your weekly sales activity report should include, why each one matters, and how to use the data to actually make decisions rather than just document history.
Why Weekly Sales Reports Matter More Than You Think
Most sales managers treat the weekly report as a summary of what already happened. The best ones treat it as a compass for what happens next.
A good weekly report helps you catch problems early, before a slow quarter becomes a bad quarter. It keeps the whole team aligned on priorities. It creates accountability without micromanagement. And it gives leadership the context they need to support the team rather than second-guess it.
The goal is not a 20-page document. The goal is a focused snapshot that anyone on the team can read in five minutes and walk away knowing exactly where things stand.
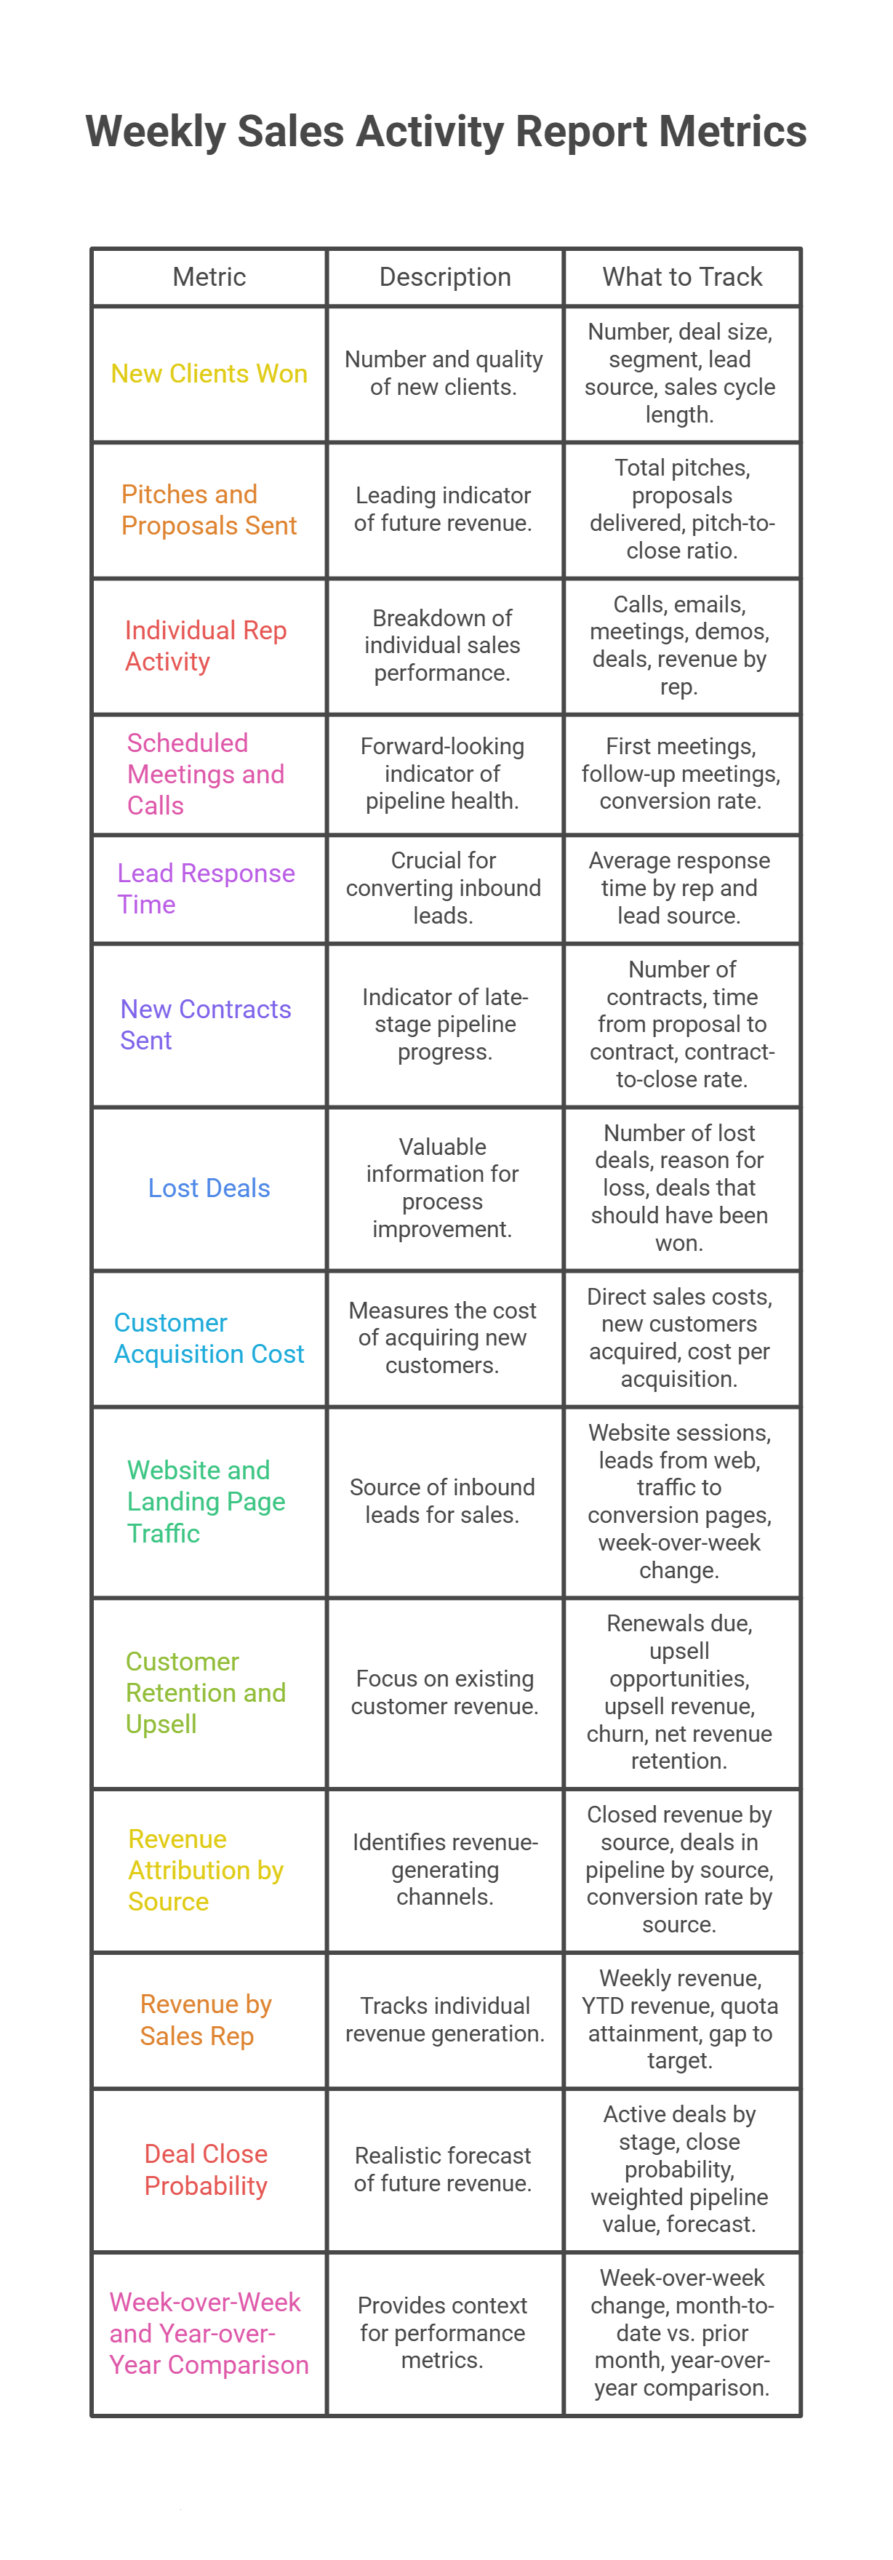
1. New Clients Won
This is the headline number. Every weekly report should open with how many new clients were acquired during the week and compare that figure to the weekly target.
But raw numbers only tell part of the story. A new client who came in through a referral at full price is very different from a new client who was discounted heavily to close. Break this section down to show not just volume but quality. Which segment did they come from? What was the deal size? How long was the sales cycle?
Over time, tracking this data weekly reveals patterns you simply cannot see from monthly summaries. You will start to notice which reps consistently bring in larger deals, which lead sources convert fastest, and which weeks tend to be strong or soft in your cycle.
What to track: Number of new clients, deal size, segment, lead source, and sales cycle length.
2. Number of Pitches and Proposals Sent
Sales is partly a numbers game. The more qualified prospects you pitch, the more deals you close. If new business is slowing down, the first question is usually whether the top of the funnel is being fed properly.
Tracking pitches sent each week gives you a leading indicator, meaning it tells you what your revenue will look like in the coming weeks before the revenue itself shows up. If pitches drop this week, revenue will likely drop a few weeks from now.
Compare pitches sent against the number of new clients won to calculate your pitch-to-close ratio. If it takes 10 pitches to win 1 client and a rep sent 5 pitches last week, you can already predict their likely close count before the week is over.
What to track: Total pitches sent, proposals delivered, pitch-to-close ratio by rep.
3. Individual Rep Activity Metrics
Aggregate team numbers are useful, but they can hide a lot. One rep with a great week can mask two reps who barely showed up. The weekly report should include individual breakdowns for each sales team member.
This is not about surveillance. It is about spotting who needs coaching and who deserves recognition. When you can see that a rep made 40 calls but booked zero meetings, that is a conversation about call quality. When you see a rep booked 10 meetings but closed none, that is a conversation about the handoff or the pitch.
Track inputs as well as outputs. Calls made, emails sent, follow-ups completed, meetings booked, and demos delivered are all inputs. Deals closed and revenue generated are outputs. You cannot improve outputs without understanding what is happening with the inputs.
What to track: Calls made, emails sent, meetings booked, demos delivered, deals closed, and revenue generated, all broken out by rep.
4. Scheduled Meetings and Calls
Meetings booked is a forward-looking metric that tells you where the pipeline is heading. A rep with a full calendar of qualified meetings next week is in a very different position from a rep with an empty one.
Track both first meetings (initial discovery calls or demos) and follow-up meetings separately. Your conversion rate from first meeting to follow-up meeting is a reliable indicator of how well your team is qualifying and engaging prospects. If a rep has lots of first meetings but almost no follow-ups, the initial conversation is not landing.
Also pay attention to how consistently your team is filling its own pipeline. Reps who let meeting volume drop when they have active deals to close are setting themselves up for a dry spell once those deals resolve.
What to track: First meetings scheduled, follow-up meetings scheduled, conversion rate from meeting one to meeting two.
5. Lead Response Time
This one gets overlooked more than almost any other metric, and it is costing teams real revenue.
Research consistently shows that the faster a sales rep responds to an inbound lead, the higher the chances of converting that person into a buyer. A lead who fills out a form or requests a demo is in active research mode. Wait 24 hours to follow up and they have already moved on to a competitor.
Your weekly report should show the average time between a lead coming in and a rep making first contact. Broken down by rep. If someone is consistently slow to respond, that is a coaching opportunity. If the whole team is slow, that might be a process or tooling issue.
What to track: Average lead response time, broken down by rep and lead source.
6. New Contracts Sent
Meetings and conversations are table stakes. What actually moves the business forward is contracts. If your team is having plenty of conversations but not sending contracts, something is breaking in the middle of the process.
Track how many contracts went out each week. Compare that to the number of deals in late-stage pipeline. If you have 15 deals in negotiation but only 2 contracts sent this week, you have a bottleneck worth investigating.
Contracts sent is also a good leading indicator for closed revenue in the near term. Most deals close within a predictable window after a contract is sent. If contract volume is healthy, revenue should follow.
What to track: Number of contracts sent, average time from proposal to contract, contract-to-close rate.
7. Lost Deals and the Reasons Behind Them
Most teams track wins. Fewer track losses with the same rigor. This is a mistake.
Understanding why you lost a deal is some of the most valuable information your sales team can generate. Were deals lost on price? On timing? Because the prospect chose a competitor? Because your team followed up too slowly? Because the product did not fit?
Each of these reasons points to a different fix. Losing on price repeatedly might indicate a positioning problem or a target market mismatch. Losing to a specific competitor might call for updated battle cards. Losing because of slow follow-up is entirely fixable with process changes.
Your weekly report should include not just the number of lost deals but a categorized breakdown of why they were lost. Over time, this data will surface patterns that are impossible to see deal by deal.
What to track: Number of lost deals, reason for loss (price, timing, competitor, no fit, slow response, other), deals that should have been won but were not.
8. Customer Acquisition Cost
Knowing how much revenue you brought in is only half the picture. Knowing what it cost you to bring it in is the other half.
Customer acquisition cost (CAC) is the total sales and marketing spend divided by the number of new customers acquired. Tracking this weekly gives you an early warning system. If CAC is creeping up while deal volume stays flat, your efficiency is declining. If CAC is falling while revenue grows, your team is firing on all cylinders.
You do not need to calculate full company-wide CAC every week, but you should track direct sales expenses, including any paid outreach, tools, and rep time, against the deals that close. This keeps profitability visible rather than a surprise at the end of the quarter.
What to track: Direct sales costs for the week, new customers acquired, cost per acquisition.
9. Website and Landing Page Traffic
Sales and marketing are more connected than most organizations admit. If your reps are benefiting from inbound leads, your weekly sales report should include the traffic data that is generating those leads.
Track the pages that drive the most leads into the pipeline. Monitor week-over-week changes in traffic to key pages. If a landing page that was generating 50 leads a week suddenly drops to 15, your pipeline will feel that in the coming weeks and your team deserves a heads-up now.
This also helps the sales team understand which content is resonating with prospects so they can reference it in their own conversations.
What to track: Weekly website sessions, leads generated from web, traffic to key conversion pages, week-over-week change.
10. Customer Retention and Upsell Activity
New business gets all the attention, but existing customers are often your most efficient source of revenue. Upselling, cross-selling, and renewing current accounts costs significantly less than acquiring new ones.
Your weekly report should show what happened with your existing customer base. How many renewals are coming up? How many upsell conversations happened this week? How many customers expanded their contract? How many churned?
If retention is declining, that is a company-level problem that leadership needs to see, not something to hide in a monthly review. Catching churn signals early gives you the best chance of reversing them.
What to track: Renewals due, upsell opportunities created, upsell revenue, churn or cancellations, net revenue retention for the week.
11. Revenue Attribution by Source
Not all leads are created equal, and not all channels deliver the same return. Revenue attribution tells you which channels, campaigns, and referral sources are actually generating closed revenue, not just traffic or leads.
Your weekly report should show closed revenue broken down by source: outbound, inbound, referral, partnerships, paid, organic, and so on. Over weeks and months, this data tells you where to invest more and where to pull back.
If referrals consistently convert at twice the rate of cold outbound, your team should be building referral programs into their workflow. If a specific paid channel keeps producing high-value deals, it deserves more budget. Attribution data makes these decisions obvious instead of debated.
What to track: Closed revenue by source, deals in pipeline by source, conversion rate by source.
12. Revenue by Sales Rep
Tracking revenue at the team level is necessary. Tracking it at the rep level is essential.
Your weekly report should show year-to-date revenue by rep, current week performance, and where each person stands relative to their quota. This creates healthy visibility and accountability. Reps who know their numbers are visible are more motivated to manage them.
This is also the data you need to have productive one-on-ones. When you can see that a rep is 20% behind their quarterly target with six weeks to go, you can have a specific, forward-looking conversation about what needs to change.
What to track: Weekly revenue by rep, YTD revenue by rep, quota attainment percentage, gap to target.
13. Deal Close Probability
Not every deal in your pipeline is equally likely to close. A deal that has had four meetings, a contract sent, and a verbal yes is very different from a deal where a prospect attended one webinar six weeks ago.
Your weekly report should include a pipeline review with close probability assigned to each active deal. This helps you build a realistic forecast rather than an optimistic one. Multiply deal size by close probability and you get a weighted pipeline value that is much more useful than raw pipeline volume.
Review these probabilities weekly. If a deal’s probability has not changed in three weeks, it might be stalling. If it jumped from 20% to 70%, find out why so you can replicate it.
What to track: Active deals by stage, close probability by deal, weighted pipeline value, forecast for the coming 30 and 60 days.
14. Week-over-Week and Year-over-Year Comparison
Numbers without context are just numbers. Every metric in your weekly report should be compared to the prior week, the prior month, and ideally the same week from the previous year.
This context is what turns data into insight. A 10% drop in calls made sounds alarming until you see it is consistent with a seasonal pattern every year in the same month. A 30% jump in deals closed looks great until you realize it is still 15% below where you were this time last year.
Build the comparison columns into your report template so the context is always visible without anyone having to hunt for it.
What to track: Week-over-week change for each key metric, month-to-date versus prior month, year-over-year comparison for the same week.
How to Structure the Report
A weekly sales activity report does not need to be fancy. What it does need is consistency. Use the same format every week so readers know exactly where to look for each number.
A simple structure that works for most teams:
Section 1 – Headline Numbers: New clients, revenue closed, quota attainment.
Section 2 – Pipeline Health: Deals by stage, weighted pipeline value, deals at risk.
Section 3 – Activity Metrics: Calls, emails, meetings, proposals, contracts, by rep.
Section 4 – Lead and Marketing Data: Traffic, inbound leads, lead response time.
Section 5 – Retention and Expansion: Renewals, upsells, churn.
Section 6 – Lost Deals Analysis: Volume, reasons, deals that should have been saved.
Section 7 – Comparisons: Week-over-week, month-to-date, year-over-year.
Section 8 – Key Takeaways and Actions: Three to five bullets on what the data is telling you and what the team will do about it this week.
That last section is the most important one. Data without action is just reporting. A weekly sales report should end with a clear answer to the question: what are we doing differently this week based on what we learned?
Frequently Asked Questions
How long should a weekly sales activity report be?
Ideally one to two pages, or the equivalent in a dashboard format. The goal is a quick read that delivers clear insights. If the report takes more than five minutes to skim, it is too long and will not be read consistently.
How often should you update the metrics in the report?
Most metrics are captured weekly, but some, like lead response time and pipeline probability, should be tracked in real time and summarized for the weekly report. Use your CRM to automate as much data collection as possible.
What is the difference between a sales activity report and a sales performance report?
A sales activity report focuses on inputs: calls made, emails sent, meetings booked, proposals delivered. A sales performance report focuses on outputs: revenue, deals closed, quota attainment. The best weekly reports combine both so you can connect activities to outcomes.
What should I do if my team is resistant to tracking this much data?
Start with the five or six metrics that matter most to your team’s goals and build from there. When reps see that the data is used to coach and support them, not punish them, resistance usually drops. Transparency goes both ways: share the results openly with the whole team.
Can a weekly sales report replace one-on-one meetings?
No. The report informs the one-on-ones and makes them more productive. Instead of spending time on status updates, you can use that meeting time to discuss strategy, coaching, and problem-solving because the data is already visible to everyone.
Conclusion
A weekly sales activity report is only as valuable as the decisions it drives. The 14 elements covered in this guide give you a complete picture of your team’s performance: where revenue is coming from, where it is being lost, how efficiently your team is working, and what the pipeline tells you about the weeks ahead.
The teams that win are not the ones with the most impressive-looking reports. They are the ones who look at their numbers honestly every week, spot problems early, and adjust course before a rough patch becomes a real crisis.
Start with the metrics that matter most for your business. Build the habit of reviewing them weekly. And make sure every report ends with actions, not just analysis.Ready to Pitch Investors with Absolute Confidence? Top-tier investors don’t just back great ideas, they back teams that know their numbers inside and out. Let our professional fundraising services help you translate your weekly sales momentum into a bulletproof, investor-ready growth story that secures the capital you need. Schedule your free fundraising strategy session.