Top Automotive Industry Financial Metrics
Automotive Industry Financial Metrics You Actually Need to Know
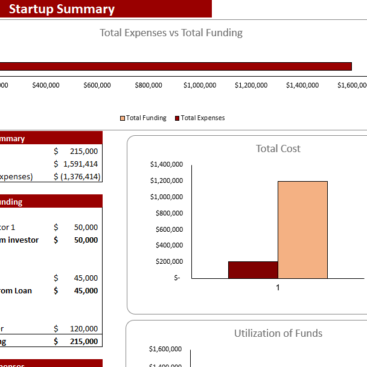
If you have ever tried to evaluate an automaker or a car dealership purely from gut feel, you already know how fast that goes sideways. The automotive business looks simple from the outside: build cars, sell cars, count money. In reality it is one of the most capital-heavy, margin-sensitive, and operationally complex industries on the planet. A single misread metric can cost an investor millions or lead a dealer to stock the wrong vehicles for an entire quarter.
This guide walks you through every major financial metric that matters in automotive, from the broad ratios investors use to size up OEMs, all the way down to the per-unit numbers that keep a car dealership alive week to week. Whether you are analyzing a manufacturer, running a dealership, or advising one, these are the numbers you need to be comfortable with.
A Quick Note on the Industry Before the Numbers
The automotive sector has a total global market value north of $2 trillion. It produces over 65 million vehicles annually and employs millions of people across three distinct business layers: OEMs (Original Equipment Manufacturers) who design and assemble vehicles, Tier-1 and Tier-2 parts suppliers who feed those OEMs, and dealerships who move finished vehicles to consumers.
Each layer faces different financial pressures. OEMs wrestle with massive capital expenditure cycles, union agreements, and platform development costs. Suppliers deal with thin margins and long payment terms. Dealers carry enormous inventory on borrowed money and make most of their real profit not from selling cars but from financing those sales and running service bays.
The metrics you need for each layer are somewhat different, but several core ratios cut across all three.
Part One: Macro Financial Ratios for OEMs and Investors
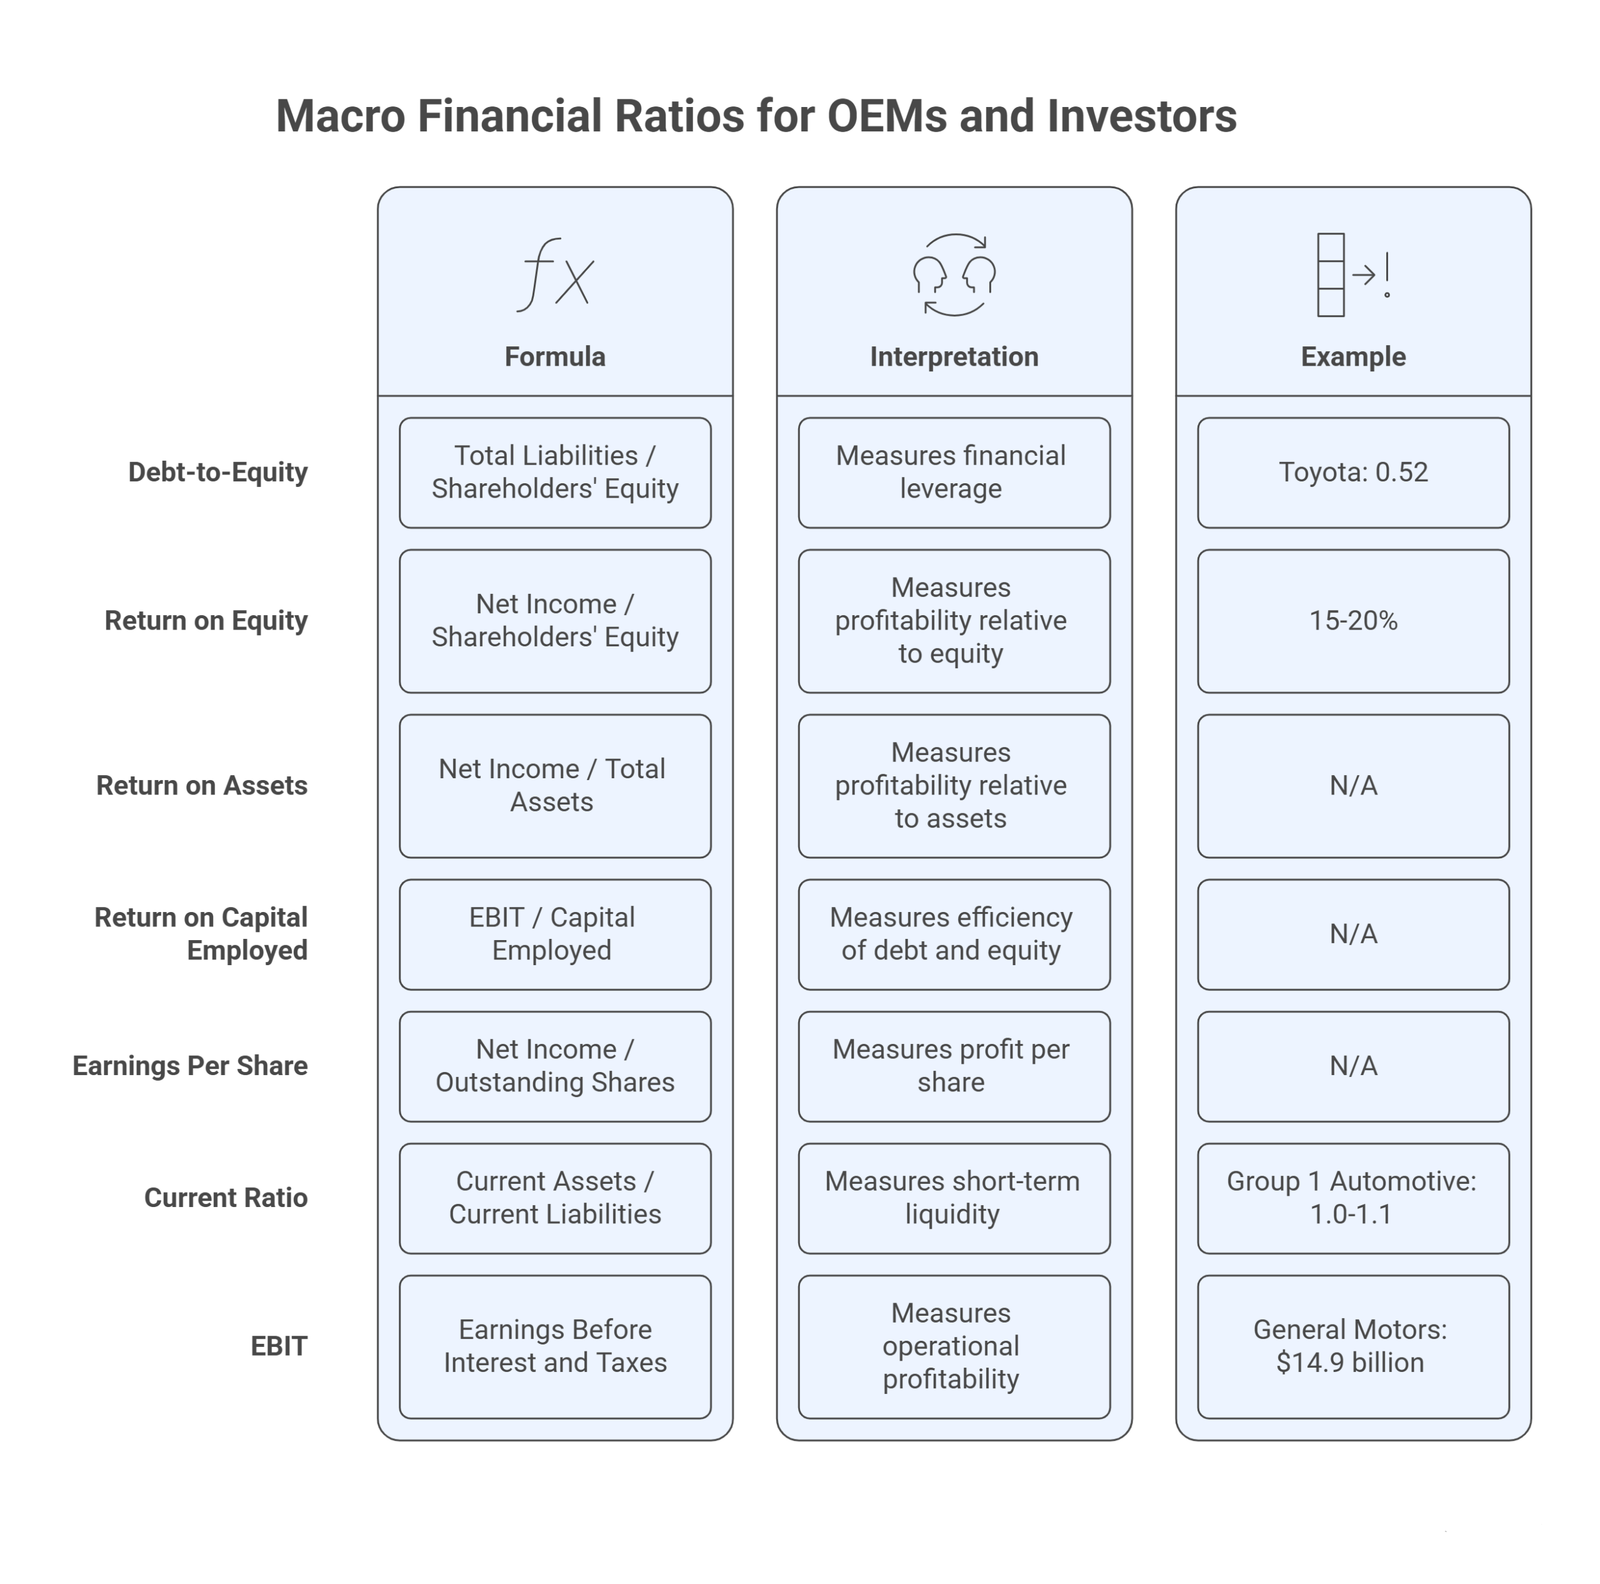
These are the ratios financial analysts reach for first when evaluating any automotive company at scale.
Debt-to-Equity Ratio
The automotive industry is capital-intensive almost by definition. Building assembly plants, retooling production lines, and funding new platform development requires billions in upfront spending. That reality makes the Debt-to-Equity ratio (D/E) one of the most watched figures in the sector.
The formula is straightforward:
D/E Ratio = Total Liabilities / Shareholders’ Equity
A D/E of 1.0 means debt equals equity. A D/E of 2.0 means the company carries twice as much debt as the value of equity on its books. As a general rule, staying below 2.0 is considered reasonable, though the actual comfort zone varies by company and market cycle.
To put some real numbers on it: Toyota historically runs a D/E around 0.52, which is conservative for an automaker and reflects decades of disciplined balance-sheet management. General Motors has historically sat around 1.43, and BMW around 1.24. These are not alarming numbers for an industry that routinely borrows to fund the next generation of platforms, but they do mean that a prolonged downturn puts pressure on debt service fast.
Investors generally prefer lower D/E ratios because high leverage amplifies both gains and losses. When auto sales drop, a highly leveraged OEM burns cash servicing debt even as revenue falls.
Return on Equity (ROE)
ROE measures how efficiently a company turns shareholder investment into profit.
ROE = Net Income / Shareholders’ Equity
A healthy ROE for a well-run automotive company typically sits in the 15 to 20 percent range. Numbers above that suggest the business is generating strong returns relative to the equity invested. Numbers persistently below 10 percent often indicate the company is not deploying its capital effectively.
ROE is a favorite metric among investors because it strips away company size and makes comparison easier. A small regional OEM with a 20 percent ROE is in better shape relative to its capital base than a giant manufacturer running 8 percent.
A few related metrics that often come up alongside ROE:
Return on Assets (ROA) measures how much profit a company squeezes from its total asset base, which matters enormously in an industry where factories, tooling, and inventory tie up enormous amounts of capital.
Return on Capital Employed (ROCE) goes a step further by factoring in how efficiently both debt and equity capital are put to work. It is particularly useful when comparing OEMs with very different leverage structures.
Earnings Per Share (EPS) tells investors how much net income is attributable to each outstanding share, a number that feeds directly into valuation and dividend conversations.
Current Ratio and Liquidity
The current ratio measures a company’s ability to cover short-term obligations with short-term assets:
Current Ratio = Current Assets / Current Liabilities
For most automotive companies, a current ratio above 1.0 signals reasonable short-term liquidity. Group 1 Automotive, one of the largest US dealer groups, has historically maintained a current ratio between 1.0 and 1.1, which is considered adequate given the high inventory turnover typical of well-run operations.
A ratio significantly below 1.0 should raise flags. It means the company may struggle to meet near-term obligations without selling longer-term assets or drawing on credit lines.
EBIT and EBIT-Adjusted
Earnings Before Interest and Taxes (EBIT), often referred to in automotive as “EBIT-adjusted” when one-time charges are stripped out, has become a standard reporting metric for large OEMs. General Motors, for example, reported an EBIT-adjusted of $14.9 billion for full-year 2024. This metric allows apples-to-apples comparison across manufacturers with different debt loads and tax positions by focusing purely on operational profitability.
Investors increasingly track EBIT-adjusted alongside free cash flow because it captures recurring earning power without the noise of restructuring charges, asset write-downs, or currency swings.
Part Two: Dealership-Specific Financial Metrics
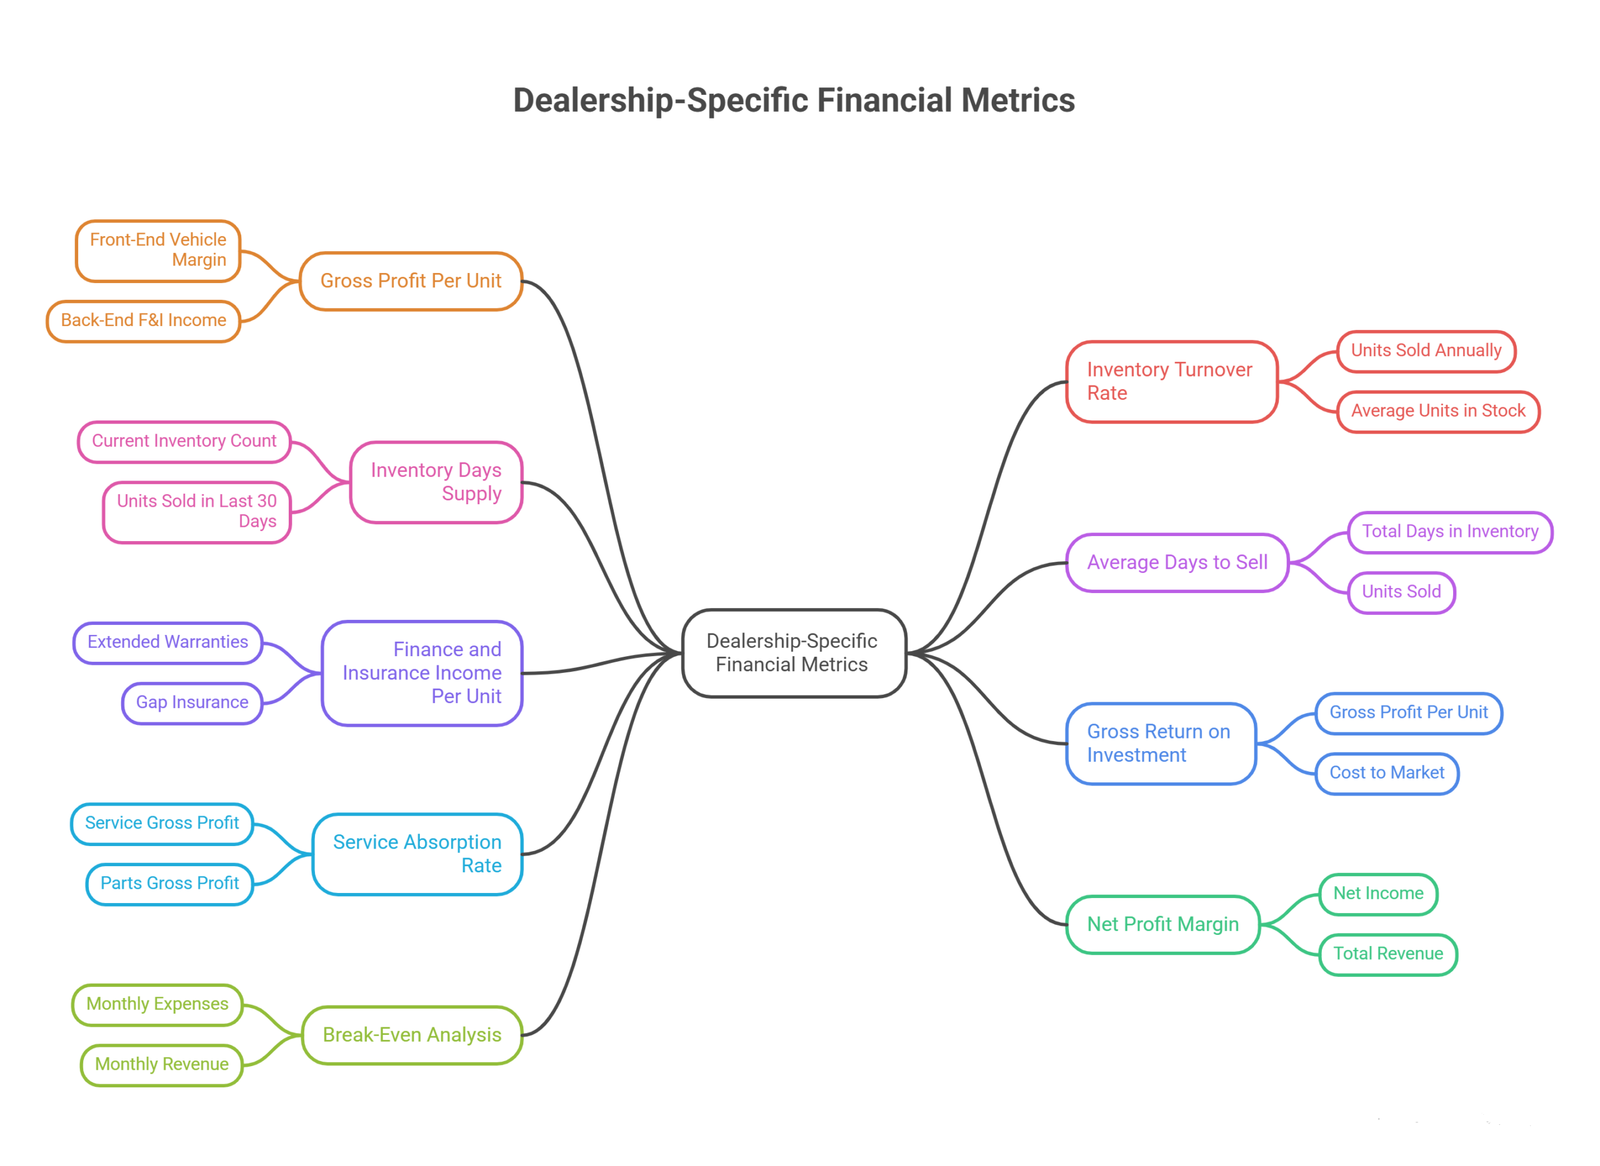
Dealerships operate under a completely different financial model from OEMs. A dealer buys vehicles on credit (called floorplan financing), carries them as inventory, and makes money by selling those vehicles plus a suite of ancillary products. The financial metrics that matter at this level are granular, operational, and often tracked daily rather than quarterly.
Gross Profit Per Unit (GPU)
If there is one metric that defines dealership financial health, it is Gross Profit Per Unit. It tells you exactly how much margin the dealership is generating per vehicle sold after the direct cost of acquiring and preparing that vehicle.
GPU = (Total Revenue from Vehicle Sale – Cost of Goods Sold) / Units Sold
In 2023, the average total gross profit per new vehicle retailed in the US was approximately $5,000, which includes both front-end vehicle margin and back-end Finance and Insurance income. For used vehicles, the average front-end gross profit was around $2,338. Those numbers may shift significantly with market conditions, but they provide a baseline for what healthy GPU looks like.
GPU should ideally be reviewed daily, not monthly. Inventory moves fast, and one bad pricing week can erode margins that are hard to recover later in the month. Dealers who segment GPU by vehicle category, new, used, certified pre-owned, wholesale, gain much cleaner insight into which parts of the business are carrying their weight.
A useful rule of thumb for new vehicle sales: GPU typically falls between 8 and 12 percent of the selling price. Anything below that range puts heavy pressure on the dealer to make up the difference through volume or back-end products.
Inventory Turnover Rate
This is the rate at which a dealership clears its entire lot. It directly determines how efficiently the business converts its borrowed inventory money back into cash.
Inventory Turnover Rate = Units Sold Annually / Average Units in Stock
A dealership that sells 600 vehicles per year while carrying an average of 50 units on hand is turning its inventory 12 times per year, or roughly once every 30 days. That is generally considered a solid benchmark.
The highest-performing dealerships turn inventory every 20 days or faster. Slow turns create a compounding problem: floorplan interest accrues daily on every vehicle sitting on the lot, depreciation erodes value, and floor space and management attention get tied up in aged units that become progressively harder to sell profitably.
Industry benchmarks treat 60 days of supply as a warning threshold. Once inventory sits beyond that point, it is a signal that something, pricing, sourcing, demand forecasting, or all three needs attention.
Inventory Days Supply (IDS)
Related to turnover but expressed differently, Inventory Days Supply tells a dealer how many days their current stock will last at the current sales pace.
IDS = (Current Inventory Count / Units Sold in Last 30 Days) x 30
The target for most new vehicle departments is 45 to 60 days. Going significantly above that number means carrying more inventory than demand supports. Going below 30 days risks running out of popular models and losing sales to competitors.
Average Days to Sell (ADS)
This measures how long a specific vehicle sits in inventory from the day it arrives to the day it is sold.
ADS = Total Days in Inventory / Units Sold
Industry best practice targets ADS at or below 45 days. Once a vehicle crosses the 45-day mark, it becomes progressively more expensive to carry and harder to sell at a healthy margin. Many top-performing dealers use the 45-day mark as an automatic trigger to reassess pricing and consider markdowns before the unit becomes truly aged.
ADS should be tracked by vehicle tier and acquisition channel. A $15,000 trade-in and a $65,000 certified pre-owned SUV have very different optimal holding periods and margin profiles.
Finance and Insurance (F&I) Income Per Unit
The F&I department is often the most profitable operation inside a dealership, and most people who have only looked at the vehicle sales line have no idea. F&I covers extended warranties, gap insurance, service contracts, paint protection packages, and financing products — all of which carry dramatically higher margins than the cars themselves.
In 2023, average F&I income per new vehicle retailed exceeded $2,400. Extended warranties alone can generate 50 to 70 percent profit margins. Gap insurance typically adds $300 to $600 per transaction. Service contracts and aftermarket accessories run 30 to 50 percent margins.
F&I Income Per Unit = Total F&I Revenue / Total Units Sold
A penetration rate above 70 percent, meaning F&I products are sold on more than 70 percent of transactions, is the benchmark top-performing dealers target. When F&I penetration drops, GPU suffers, often more than the vehicle sales line would suggest.
Gross Return on Investment (GROI)
GROI is a metric that combines profitability and speed of turn. It captures not just how much you made on a vehicle but how quickly you made it.
GROI = (Gross Profit Per Unit / Cost to Market) x Turn Rate
If a $10,000 vehicle generates $1,000 profit and sells in 30 days (a 12-turn equivalent), the GROI is 120. If it takes a full year to sell (a 1-turn equivalent), the GROI is 10. The minimum viable GROI most industry analysts point to is 120. Anything consistently below that suggests the dealership is either paying too much for inventory, pricing too aggressively on the sell side, or both.
Service Absorption Rate
This metric tells you what percentage of the dealership’s total fixed overhead expenses are covered by gross profit generated in the service and parts departments alone.
Service Absorption Rate = (Service + Parts Gross Profit) / Total Fixed Overhead
A service absorption rate of 70 percent or higher is the widely cited industry target. At 100 percent, the service and parts departments are covering all overhead by themselves, which means vehicle sales become almost entirely incremental profit. Dealers who hit or exceed 100 percent absorption are among the most resilient businesses in the sector because they can weather weak vehicle sales cycles without going underwater.
NADA data indicates that personnel expenses alone can consume more than 50 percent of a dealership’s total gross profit, which underscores why covering overhead through service revenue is so valuable.
Net Profit Margin
After everything, cost of vehicles, service expenses, floorplan interest, personnel, advertising, and facility costs, net profit margin is what the owner actually takes home.
Net Profit Margin = Net Income / Total Revenue
For a well-performing dealership, net profit margin typically runs 1 to 3 percent of total revenue, with 2 to 4 percent being the benchmark for a genuinely strong operation. That sounds razor thin, and it is, which is exactly why F&I income, service revenue, and inventory velocity are so critical. A dealership running 2 percent net margin on $50 million in revenue is generating $1 million in annual profit. That same dealer running at 1 percent is generating $500,000 and is far more exposed to any cost increase or demand slowdown.
New vehicle sales themselves typically generate gross margins of only 2 to 5 percent. Used vehicle departments do better at 10 to 12 percent. Service and parts departments are in a different league entirely at 40 to 50 percent gross margin on labor and parts.
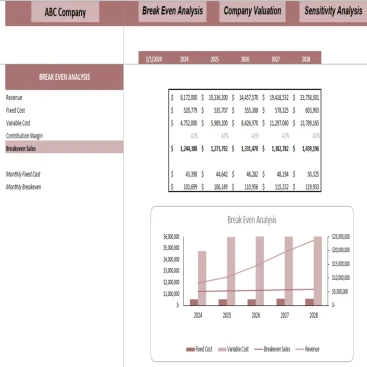
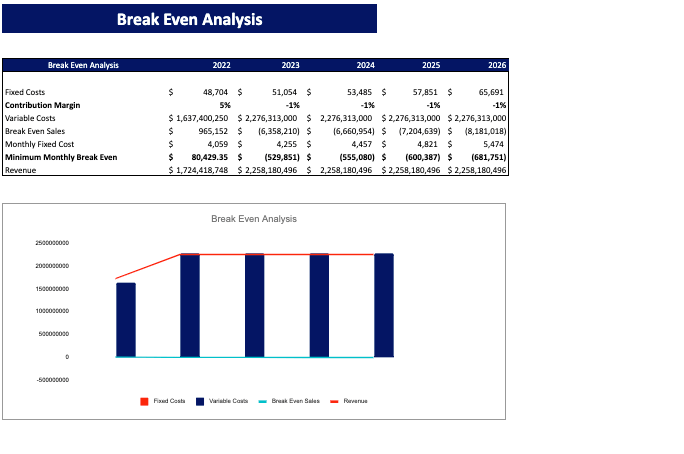
Break-Even Analysis
Dealerships acquire fresh inventory constantly, often monthly, and they need to break even within each period to sustain operations. The break-even calculation ties directly into both inventory turnover and service absorption.
Days to Break Even = (Monthly Expenses / Monthly Revenue) x 30.4
A dealership with $86,000 in monthly expenses against $100,000 in revenue breaks even at around day 26. That leaves four days of the month generating actual profit. The faster the inventory turns and the stronger the service absorption rate, the shorter this break-even window becomes.
Part Three: Manufacturing and Operational Metrics for OEMs
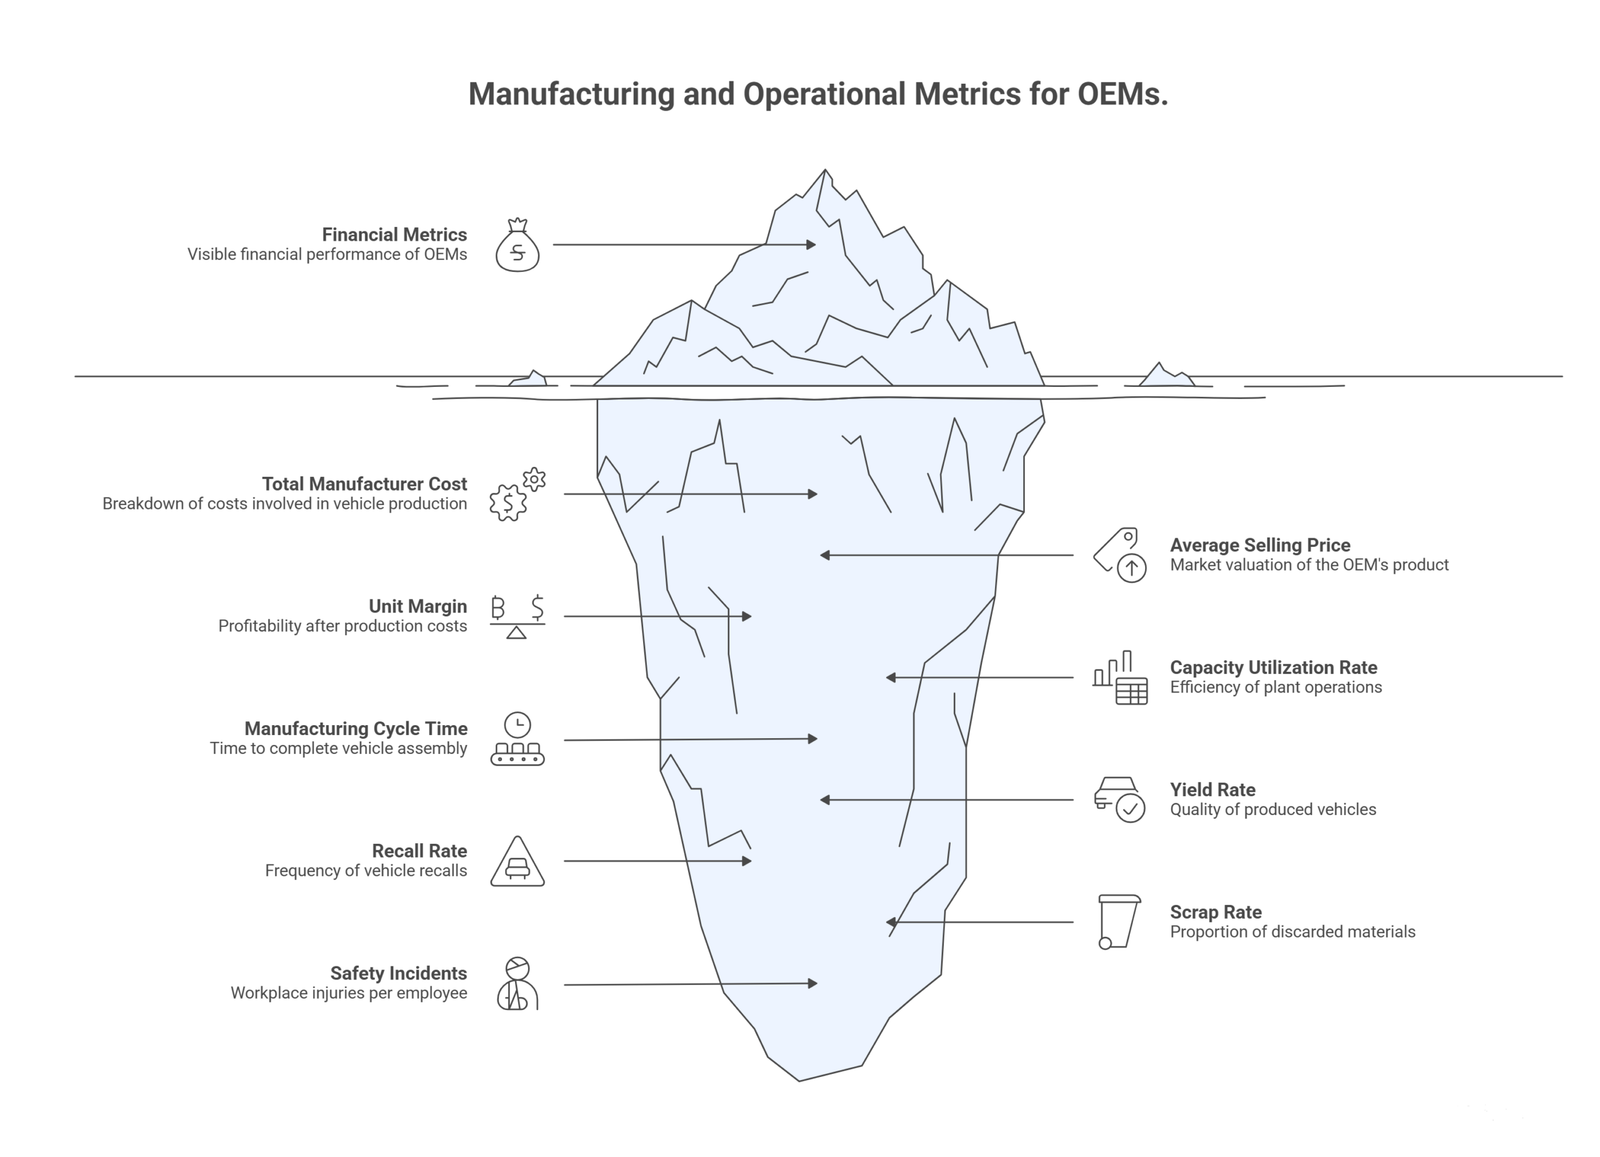
For OEMs and their analysts, the financial picture extends beyond the income statement into the factory floor. These metrics tell the real story of production efficiency, quality control, and operational health.
Total Manufacturer Cost Breakdown
Understanding what it actually costs to build a vehicle is fundamental to analyzing an automaker’s competitiveness. Total manufacturer cost is typically broken into:
Material costs (raw materials, purchased components), labor costs, assembly costs, distribution costs, and overhead costs (utilities, depreciation on plant and equipment, administrative expenses).
When any of these cost lines rises unexpectedly, it compresses margin and often signals a deeper operational issue. A spike in material costs during a commodity cycle, for example, was one of the factors that eroded industry profitability significantly during the 2021 to 2023 supply disruption period.
Average Selling Price and Unit Margin
Unit Margin = Average Selling Price – Total Cost Per Unit
Average selling price tells you where the market values the product. Unit margin tells you whether that valuation leaves enough room after production costs. These two figures together define the fundamental economics of any OEM’s product line.
When average selling prices fall without a corresponding reduction in per-unit cost, margins compress. When they rise, as they did dramatically for many manufacturers during the inventory shortage of 2021 and 2022, even modest efficiency improvements produce outsized profitability.
Capacity Utilization Rate
Utilization Rate = Manufactured Units / Maximum Possible Units in Period
A low utilization rate is expensive. Fixed costs, plant depreciation, facility overhead, skeleton workforce costs, continue regardless of output. An OEM running its plants at 60 percent capacity is effectively paying full overhead for 40 percent of its productive capacity that is generating zero revenue. The sweet spot for most large assembly operations is typically 80 to 85 percent utilization, which balances efficiency against the flexibility needed to handle demand swings.
Manufacturing Cycle Time
This is the time it takes to move a vehicle from the beginning of the assembly process to completion. Shorter cycle times mean more units can be produced in a given period and that demand can be met faster.
Cycle Time = Total Production Time / Units Produced Per Day
Automakers with shorter cycle times have a structural cost advantage: the same plant capacity generates more revenue. They also carry less work-in-process inventory at any given moment, reducing the capital tied up in unfinished goods.
Yield Rate and Recall Rate
Yield Rate = Good Units Produced / Total Units Produced
A high yield rate means most vehicles coming off the line meet quality specifications on the first pass. A low yield rate means significant rework, which eats time, labor, and materials.
The recall rate is essentially the inverse concern applied after vehicles reach customers. A rising recall rate signals quality control failure at scale. Beyond the obvious reputational damage, recalls are brutally expensive, they involve logistics, parts, labor, and regulatory oversight costs that can run into billions for large-scale events.
Scrap Rate
Scrap rate measures the proportion of raw materials that are discarded due to defects or production errors.
Thus, Scrap Rate = Total Scrapped Materials / Total Materials Used
A high scrap rate is a direct hit to material costs and a signal of process inefficiency. In an industry where material costs represent the single largest component of total manufacturing cost, even small improvements in scrap rate translate directly to better margins.
Safety Incidents Per Employee
This metric is operational rather than purely financial, but it connects to financial outcomes in several ways: workplace injuries increase costs through compensation claims, productivity losses, regulatory fines, and higher insurance premiums. Beyond that, high incident rates often correlate with poor workforce morale, elevated absenteeism, and turnover — all of which reduce effective production capacity.
Frequently Asked Questions
What is the most important financial metric for an automotive OEM?
There is no single answer, but most analysts start with the Debt-to-Equity ratio to understand leverage risk, then move to EBIT-adjusted and ROE to assess operational profitability. Together these three give you a fast read on financial health before diving deeper.
What is a good D/E ratio for an automaker?
Because the industry is capital-intensive, a D/E below 2.0 is generally considered acceptable. Toyota’s historically conservative ratio of around 0.52 is unusually low for the sector. Most major OEMs sit between 1.0 and 1.5, which is workable as long as revenue stays stable.
Why do car dealerships have such thin net profit margins?
Vehicle sales themselves carry very low gross margins, typically 2 to 5 percent on new cars. The real profit comes from Finance and Insurance products, service departments, and parts sales, which carry margins of 40 to 70 percent. When those back-end operations underperform, the overall dealership net margin (usually 1 to 3 percent of revenue) gets squeezed fast.
What is Gross Profit Per Unit and why do dealers track it daily?
GPU measures how much margin a dealership earns per vehicle sold after acquisition and preparation costs. Dealers track it daily because inventory depreciates, floorplan interest accrues, and pricing decisions made on Monday affect the whole month’s margin. Waiting until month-end to review GPU means problems compound before anyone catches them.
Putting It All Together
No single ratio tells the full story of an automotive business. The D/E ratio tells you about leverage but says nothing about how efficiently assets are deployed. ROE captures profitability relative to equity but misses the quality of that earnings stream. GPU at a dealership is essential but meaningless without knowing what inventory turnover and F&I penetration are doing alongside it.
The most useful approach is to look at these metrics as a system. A dealership with strong GPU but weak service absorption is fragile because it depends on vehicle sales margin in a business where those margins are inherently volatile. An OEM with a low D/E ratio but declining utilization rates and rising cycle time is burning efficiency even as its balance sheet looks clean.
When the metrics point in different directions, that tension is usually where the most important insights live. Healthy businesses tend to show coherence across the financial ratios: leverage is appropriate for the capital cycle, margins are stable, turnover rates are efficient, and operational metrics reinforce rather than contradict the financial picture.
The automotive industry rewards people who look past the headline numbers and understand what is driving them.