Electric Bike Dealer Excel Financial Model: Overview
The Electric Bike Dealer Excel Financial Model Excel Template is a practical and easy-to-understand tool built for business owners operating in the electric bicycle industry. With rising interest in eco-friendly transportation, electric bikes are rapidly gaining market share over traditional bicycles. This template helps business owners navigate their financial planning by offering clear future projections, income statement insights, and cash flow projections. Whether you’re applying for bank loans, optimizing pricing strategies, or evaluating your financial position, this model offers the structure to support confident business decisions. By forecasting cash flow, evaluating capital expenditures, and assessing operational costs, the model ensures that business owners are equipped to grow with confidence, avoid financial shortfalls, and stay prepared for peak seasons.
Key Components
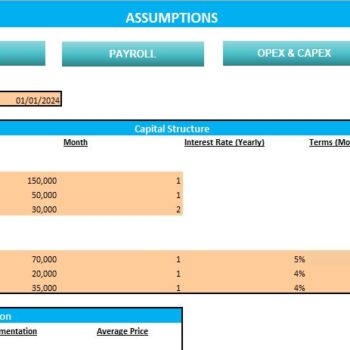
Input Sheet
The input sheet is where users set assumptions and customize the model for their own e-bike company. This includes key variables like:
-
Revenue
-
Monthly and annual sales projections
-
Sales from electric bicycles, maintenance services, and accessories
-
Expected level of sales based on market conditions
-
Price per unit and expected sales volume
-
Inclusion of income from traditional bicycles if applicable
-
-
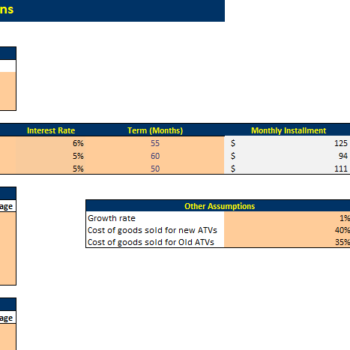
Cost Structure
-
Fixed and variable operational costs
-
Marketing expenses including online ads and social media presence
-
Insurance costs, rent, and maintenance expenses
-
Estimated capital expenditures and startup inventory
-
Revenue Analysis
Understanding revenue drivers is a critical component of financial forecasting. This model allows you to analyze:
-
Revenue split by product category (e-bikes vs. traditional bicycles)
-
Seasonal peaks and their effect on sales
-
Growth rates based on past performance and future expectations
-
Impact of pricing strategies on overall profit margins
Income Statement
-
Forecast-ready structure for 5 years
-
Breaks down revenue, gross profit, and net profit margins
-
Useful for tracking actuals vs. forecast
-
Helps understand Profit & Loss over time
Cashflow Statement
-
Includes monthly cash flow forecast
-
Highlights financing cash flow and potential cash crisis
-
Tracks repayment of loans from banks and other financing sources
-
Shows cumulative profits and working capital flow
Balance Sheet
-
Displays your financial position at a glance
-
Includes capital requirement and operating expenses
-
Tracks banking fees, debt repayment, and credit card processing costs
-
Useful for loan application or presenting to financial institutions
Company Evaluation
Evaluating the company through the lens of financial metrics and industry benchmarks, this section delves into the valuation of the e-bike dealership, considering factors like market position, revenue potential, and profitability forecasts. It’s a strategic exercise in understanding the company’s worth in the competitive landscape of the e-bike industry.
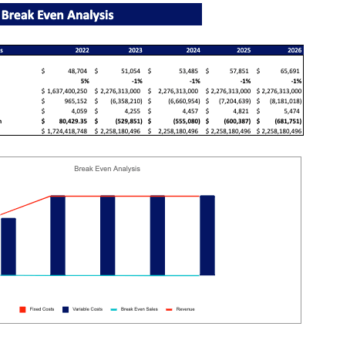
Break-even Analysis
The Break-even Analysis illuminates the threshold at which the business ceases to operate at a loss and begins to turn a profit. This critical analysis aids in understanding the volume of sales necessary to cover costs, highlighting the path to financial sustainability.
Sensitivity Analysis
Sensitivity Analysis ventures into the realm of what-ifs, exploring how different scenarios impact the financial health of the business. It assesses the resilience of the business model against fluctuations in key variables such as sales volumes, pricing strategies, and cost structures.
KPIs and Ratios
Key performance indicators offer clear financial metrics to measure the health of your e-bike business. These include:
-
Gross profit margins
-
Monthly break-even analysis
-
Operating Expenses as a percentage of revenue
-
Debt coverage ratios
-
Profitability by retail location or product line
Dashboard
The Dashboard presents a visual summary of the business’s financial health and operational efficiency, offering a quick-glance view of key metrics and trends. It’s designed to provide immediate insights, allowing for swift decision-making and strategic adjustments.
FAQs
Q: Can I use this model for a retail shop and online store?
Yes, the input sheet allows you to customize multiple revenue streams, including physical and digital channels.
Q: Will this help with loan applications from financial institutions?
Definitely — it provides a complete financial blueprint including income statement, cash flow statements, and balance sheet.
Q: What if my business deals only in traditional bicycles?
You can adjust the revenue assumptions to reflect your product mix and market strategy.
Q: Can I assess if my cash flow can support debt repayment?
Yes, the model includes cash flow projections and breakeven analysis to evaluate this.
Terms of Use:
Oak Business Consultant and our range of products, including this financial model template, are not endorsed by or officially connected to any specific software or platform unless explicitly stated. Your purchase allows you a single license for personal or business use, exclusive to your individual or company needs. Redistribution, resale, or sharing of the files and templates is strictly prohibited. Please direct others to our shop if you find our financial model valuable and wish to recommend it.
Note:
Our product is a digital Excel file. Due to the nature of digital products, we cannot offer returns or exchanges. We encourage you to address any queries or seek clarification before finalizing your purchase.
Need More Help?
Email us at info@oakbusinessconsultant.com to get a customized Electric Bike dealer Excel financial model Projection Template