


Tire Dealer Financial Model Excel Template


Original price was: $180.$108Current price is: $108.
The Financial Analysts at Oak Business Consultant have made this complete, dynamic tire dealer financial model excel template for your total financial planning needs. The model has a 5-year financial projection plan to track steady growth and profitability. It can also estimate ongoing operating expenses, monthly sales revenue, and startup investment requirements. With this easy-to-use template, there is no further need for complex calculation, you need to add numbers, and you are all set.
Frequently Bought Together
- Description
- Reviews (9)
Description
Tire Dealer Financial Model Excel Template
Introduction
In the ever-evolving landscape of the automotive industry, tire dealers face unique challenges in managing their finances effectively. Whether it’s projecting revenues, analyzing inventory, or evaluating profitability, having a robust financial model is crucial for informed decision-making and sustainable growth. This article delves into the utilization of the Tire Dealer Financial Model Excel Template, a comprehensive tool designed to streamline financial planning for tire businesses.
Oak Business Consultant specializes in bespoke services, tailored to your specific needs. We offer personalized business plans, pitch decks, and financial models. Our focus on individuality sets us apart in the industry. We prioritize your satisfaction and look forward to proving our commitment.
Moreover, our experienced business and financial experts are ready to refine your financial model, pitch deck, or business plan. We can customize these essential tools to meet your precise requirements, ensuring the end product exceeds your expectations.
Utilizing the Tire Dealer Excel Financial Model
The Tire Dealer Excel Financial Model serves as a strategic blueprint for tire dealers, offering insights into key financial aspects such as revenue analysis, inventory management, and startup budgeting. By leveraging this tool, tire dealers can make data-driven decisions, optimize resource allocation, and maximize profitability.
Key Components
The Tire Dealer Excel Financial Model comprises various components essential for comprehensive financial planning:
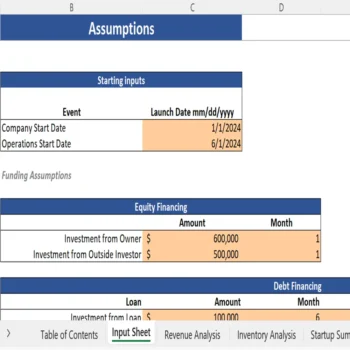
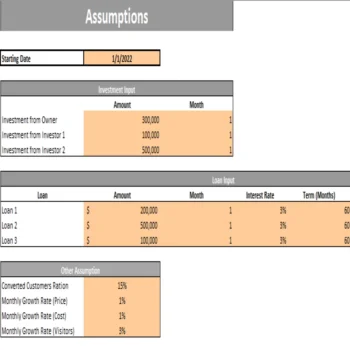
Input Sheet:
The Input Sheet serves as the foundation of the financial model, allowing users to input key parameters such as sales forecasts, pricing strategies, and operating expenses.

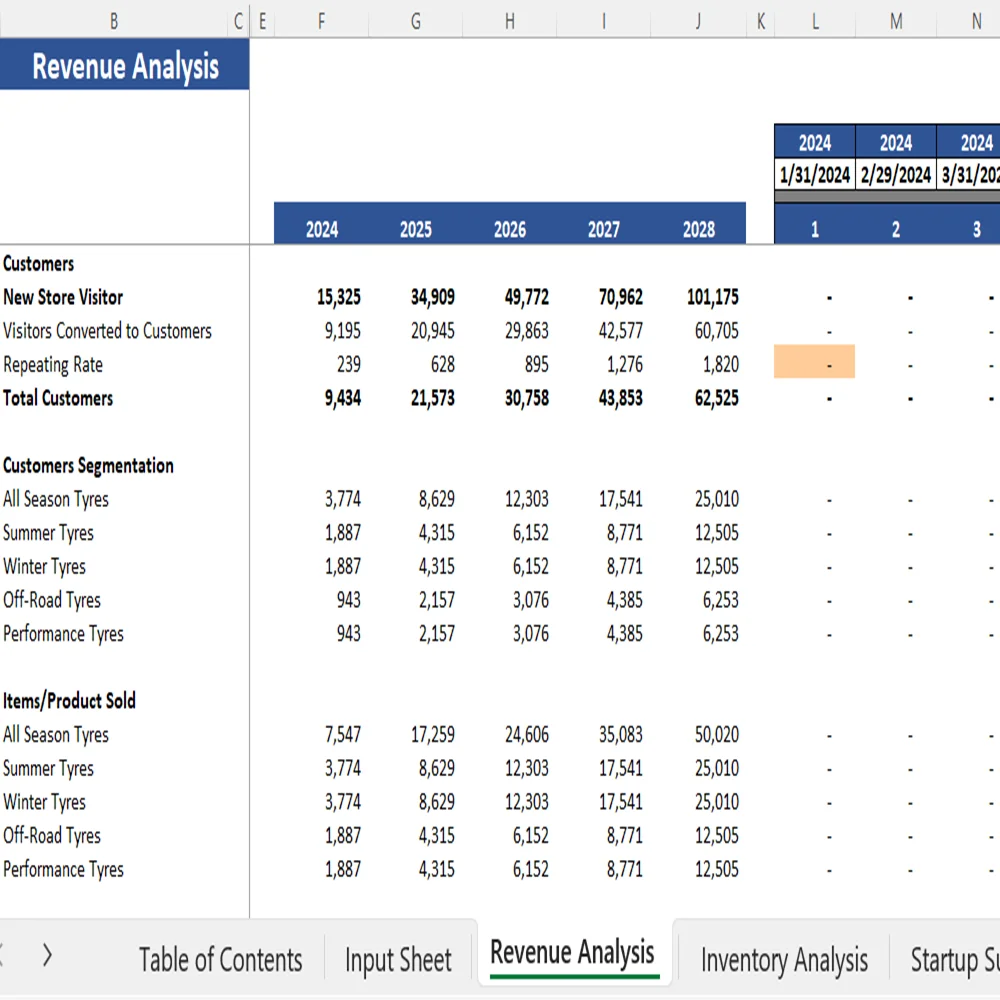
Revenue Analysis:
This section provides a breakdown of revenues, offering insights into sales trends, pricing dynamics, and customer segmentation. By analyzing revenue streams, tire dealers can identify growth opportunities and optimize pricing strategies.
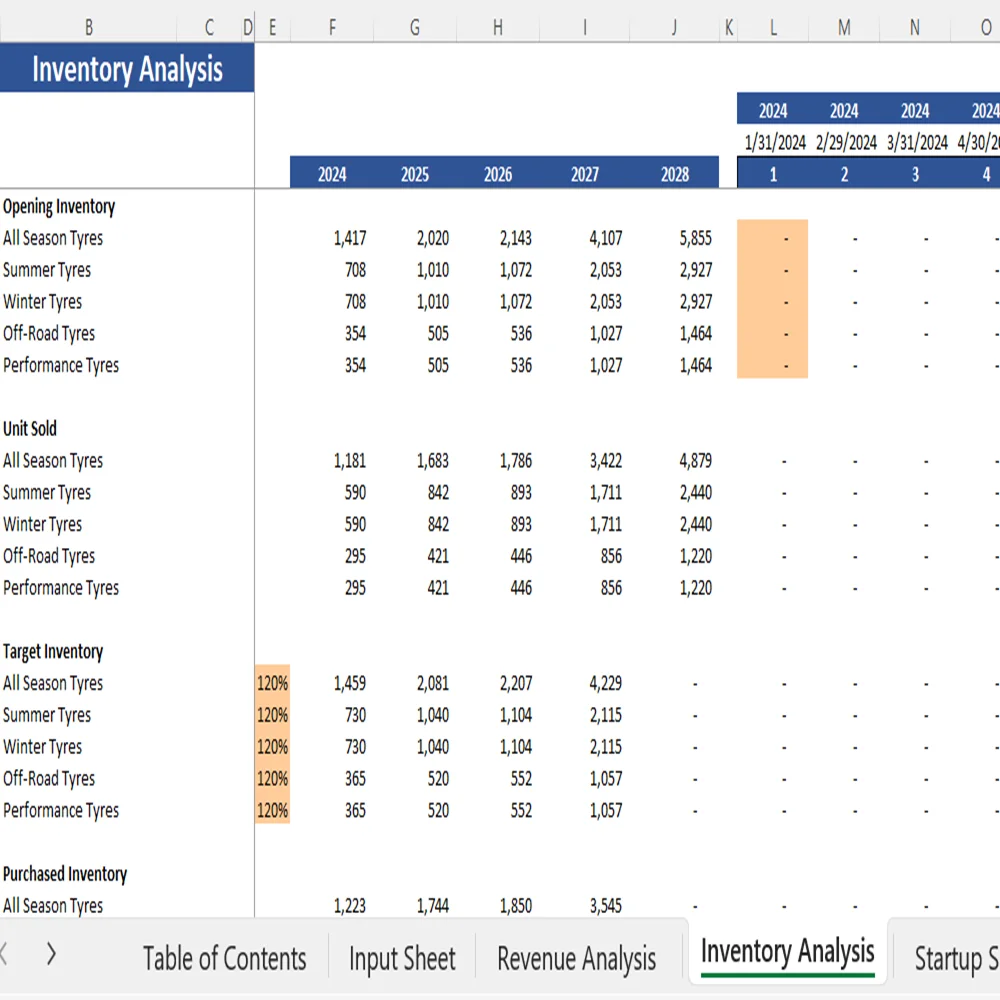
Inventory Analysis:
Effective inventory management is critical for tire dealers to minimize carrying costs and maximize turnover. The Inventory Analysis section helps users optimize inventory levels, forecast demand, and mitigate stockouts.
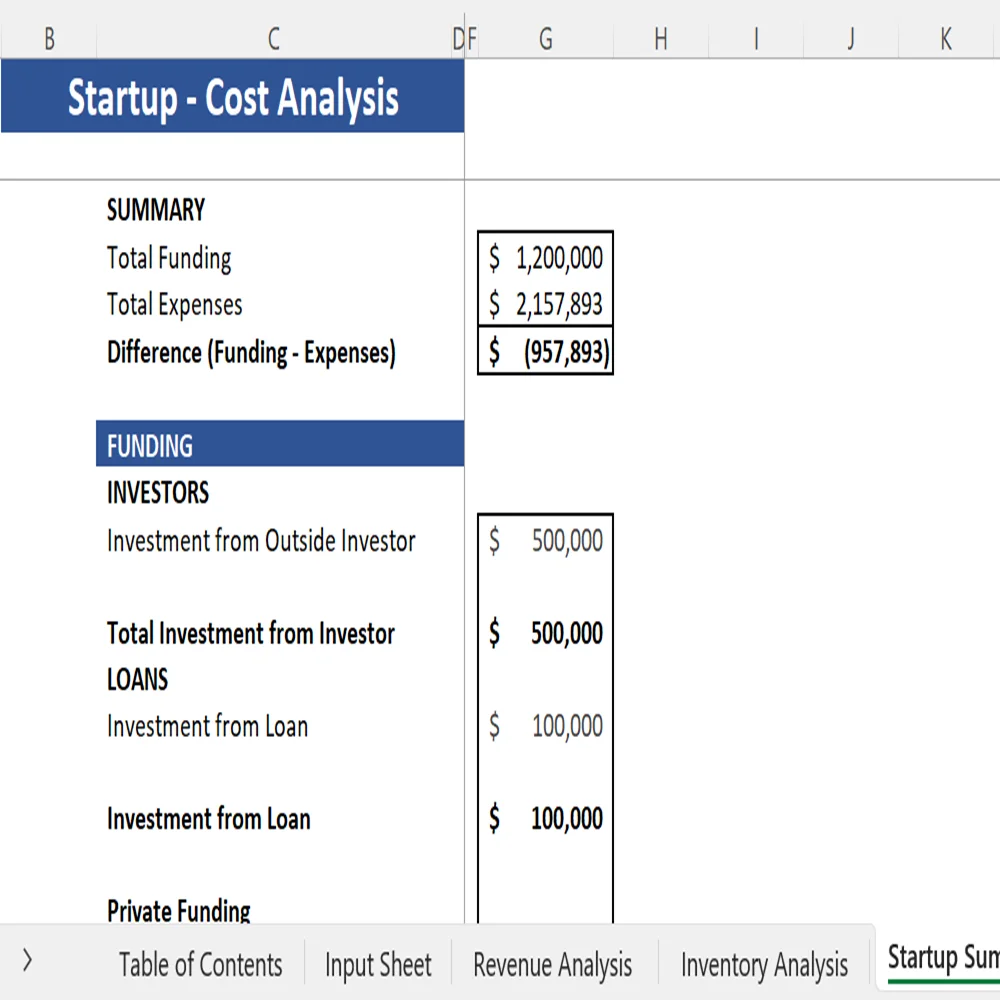
Startup Summary:
The Startup Summary outlines the initial costs associated with launching or expanding a tire business. From equipment purchases to lease agreements, this section provides a comprehensive overview of startup expenses.
Income Statement:
The Income Statement offers a detailed breakdown of revenues, expenses, and net income over a specified period. By analyzing profitability metrics such as gross margin and net profit margin, tire dealers can assess the financial health of their business.

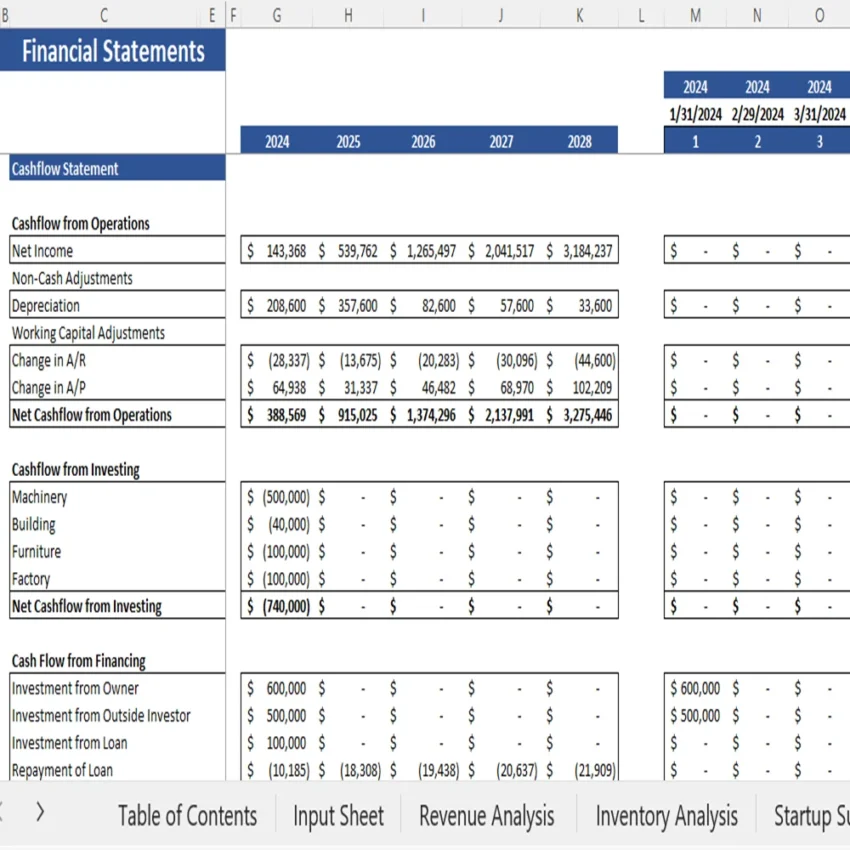
Cashflow Statement:
Cashflow management is essential for ensuring liquidity and financial stability. The Cashflow Statement tracks cash inflows and outflows, allowing tire dealers to forecast cash reserves, manage working capital, and plan for capital expenditures.

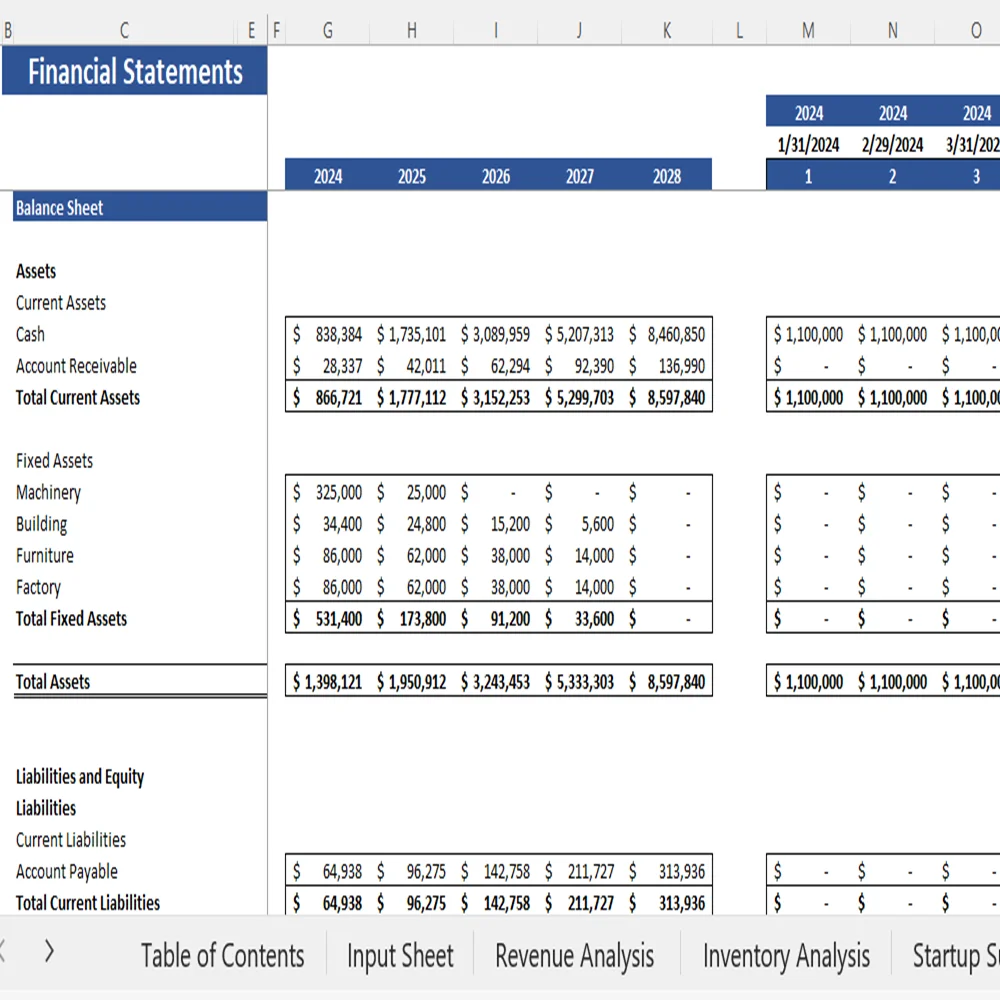
Balance Sheet:
The Balance Sheet provides a snapshot of the tire dealer’s financial position, including assets, liabilities, and equity. By analyzing key metrics such as the current ratio and debt-to-equity ratio, tire dealers can evaluate solvency and financial leverage.
Break-even Analysis:
The Break-even Analysis helps determine the point at which the tire dealer’s total revenues equal total expenses, signaling a neutral financial position. By identifying the break-even point, tire dealers can set pricing targets and assess profitability thresholds.

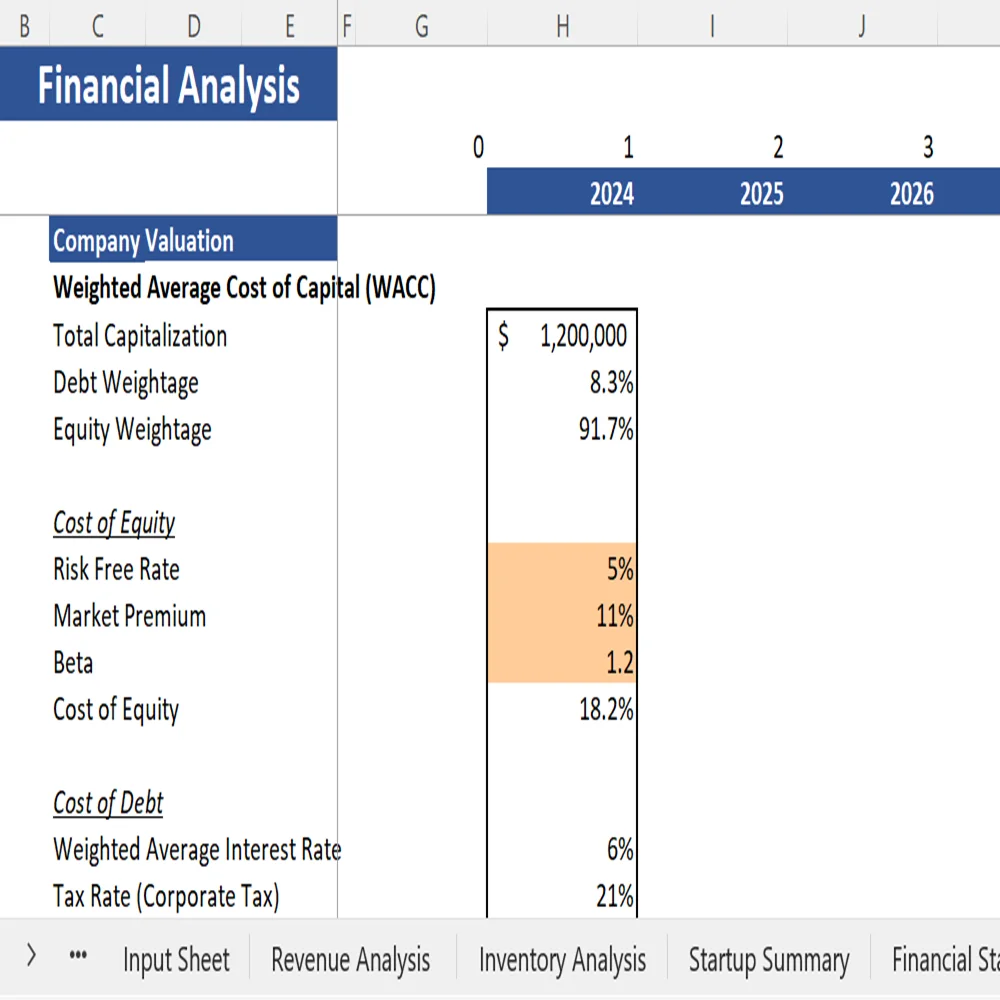
Company Evaluation:
This section provides a comprehensive assessment of the tire dealer’s financial performance, including profitability ratios, liquidity ratios, and efficiency ratios. By benchmarking against industry standards, tire dealers can identify areas for improvement and strategic growth initiatives.
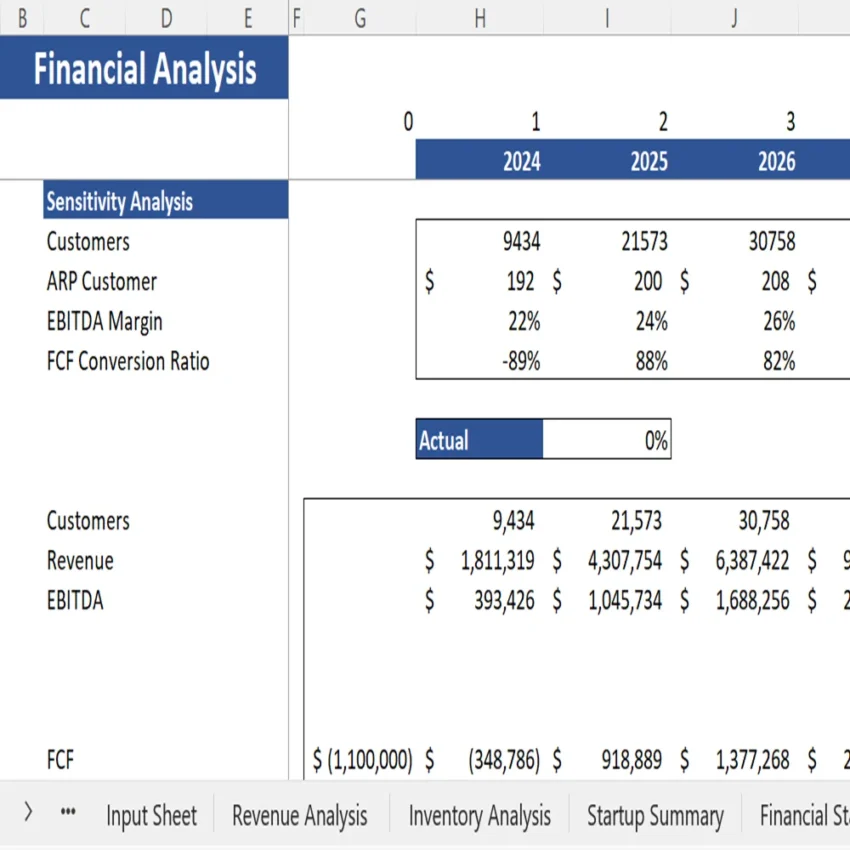
Sensitivity Analysis:
The Sensitivity Analysis evaluates the impact of changes in key assumptions on the tire dealer’s financial performance. By conducting scenario analysis and stress testing, tire dealers can assess the robustness of their financial model and mitigate risk.

KPIs and Ratios:
Key Performance Indicators (KPIs) and financial ratios provide valuable insights into the tire dealer’s operational efficiency and financial health. From inventory turnover to return on investment (ROI), monitoring KPIs and ratios enables tire dealers to track performance metrics and drive continuous improvement.

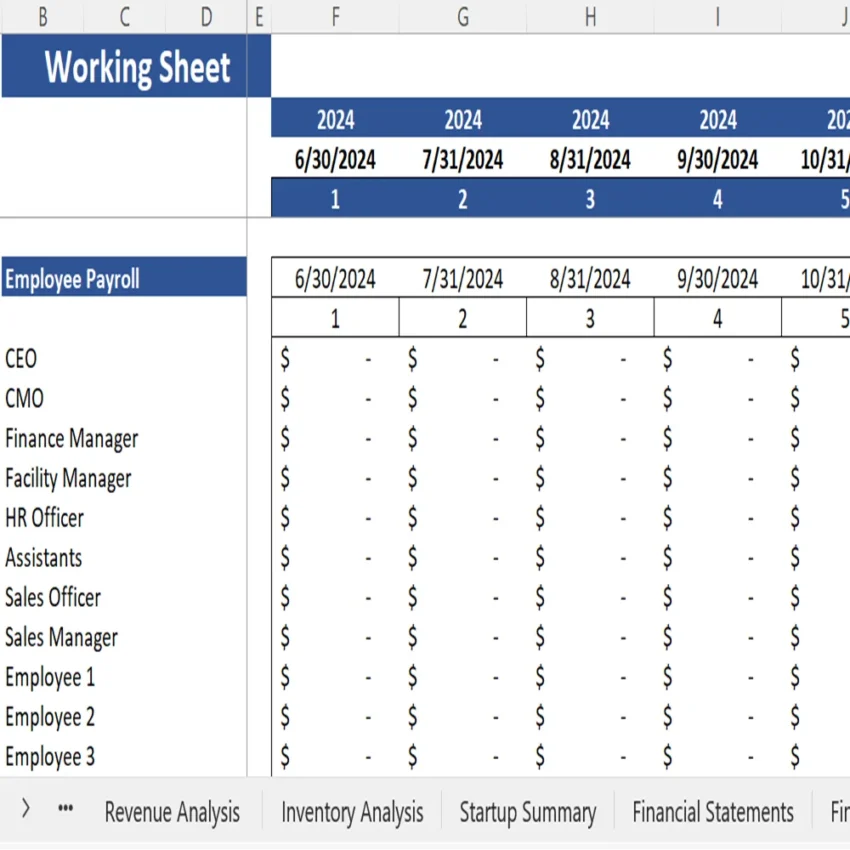
Working Sheet:
The Working Sheet serves as a dynamic workspace for scenario planning, sensitivity analysis, and financial modeling. By leveraging advanced functionalities such as scenario analysis and goal-seeking, tire dealers can simulate various business scenarios and optimize decision-making.

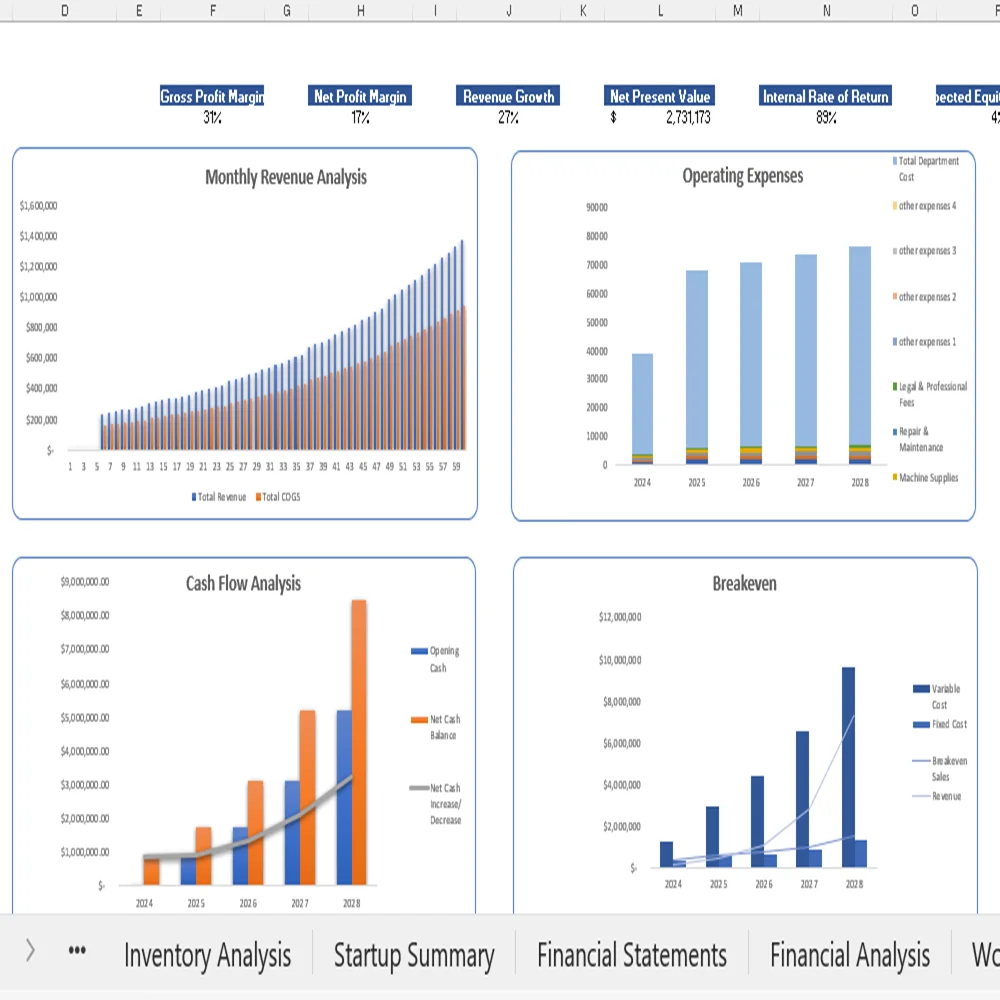
Dashboard:
The Dashboard provides a convenient graphical visualization of key financial metrics, allowing tire dealers to monitor performance trends, track KPIs, and make informed decisions at a glance.
Frequently Asked Questions
What are the projected revenues for the upcoming quarter/year based on this financial model?
The projected revenues are based on comprehensive sales forecasts, taking into account factors such as market demand, pricing strategies, and seasonality trends. By analyzing historical sales data and market dynamics, the financial model generates accurate revenue projections for informed decision-making.
How accurate are the assumptions used in this Excel financial model?
The assumptions used in the Excel financial model are meticulously researched and validated to ensure accuracy and reliability. From sales growth rates to cost projections, each assumption is carefully scrutinized and adjusted based on industry benchmarks, market research, and expert insights.
What is the projected gross margin percentage for tire sales?
The projected gross margin percentage for tire sales is calculated by subtracting the cost of goods sold (COGS) from total revenues and dividing by total revenues. This metric provides insights into the profitability of tire sales, taking into account factors such as pricing strategies, supplier costs, and inventory management.
Can you explain the factors influencing the projected net profit margin?
The projected net profit margin is influenced by various factors, including revenue growth, operating expenses, and cost efficiencies. By optimizing pricing strategies, controlling expenses, and maximizing operational efficiency, tire dealers can enhance their net profit margin and drive sustainable growth.
What is the expected return on investment (ROI) for investing in inventory based on this model?
The expected return on investment (ROI) for investing in inventory is calculated by dividing net profit attributable to inventory by the total investment in inventory. This metric provides insights into the profitability of inventory management, taking into account factors such as carrying costs, stockouts, and inventory turnover.
How does this financial model account for seasonality in tire sales?
The financial model accounts for seasonality in tire sales by incorporating historical sales data and seasonal trends into revenue forecasts. By analyzing patterns and fluctuations in demand, tire dealers can adjust inventory levels, pricing strategies, and marketing campaigns to capitalize on seasonal opportunities.
What are the key performance indicators (KPIs) tracked in this Excel model to monitor business performance?
The Excel model tracks key performance indicators (KPIs) such as inventory turnover, gross margin, net profit margin, return on investment (ROI), and break-even point. By monitoring these KPIs, tire dealers can assess operational efficiency, financial health, and overall business performance.
How sensitive is the projected profitability to changes in key assumptions such as tire prices or operating expenses?
The projected profitability is sensitive to changes in key assumptions such as tire prices, operating expenses, and sales volumes. Through sensitivity analysis and scenario planning, tire dealers can assess the impact of various factors on profitability and develop contingency plans to mitigate risks.
Can this financial model be customized to reflect different scenarios or business strategies?
Yes, the financial model can be customized to reflect different scenarios, business strategies, and market conditions. From adjusting pricing assumptions to simulating growth scenarios, tire dealers can tailor the financial model to their specific needs and objectives.
What financing options are available to support business growth as projected in this Excel financial model?
The Excel financial model provides insights into financing options such as equity financing, debt financing, and working capital loans. By analyzing cash flow projections, capital expenditure requirements, and financing costs, tire dealers can evaluate the most suitable financing options to support business growth.
Conclusion
In conclusion, the Tire Dealer Excel Financial Model offers a comprehensive framework for financial planning, analysis, and decision-making in the tire industry. By leveraging advanced functionalities such as revenue analysis, inventory management, and sensitivity
Walk-through video of the Tire Dealer Excel Financial Model
The following video will give you an overview of the different components of the financial model and will help you understand how it works.
9 reviews for Tire Dealer Financial Model Excel Template
Add a review
You must be logged in to post a review.


Gerald Diaz –
As an accountant specializing in small businesses, this model has saved my clients countless hours and dollars. It’s accurate and very professional.
Randy Rivera –
I highly suggest this tool to all my clients in the automotive industry. Its versatility, thoroughness, and clarity offer an excellent financial roadmap specifically tailored for tire dealership businesses.
Aaron Watson –
For industry analysis and financial forecasting, this tool is top-notch. It’s flexible yet detailed, providing all the necessary data points for comprehensive reviews.
Gerald Gray –
This model has revolutionized how we manage inventory and predict ordering needs. It’s incredibly accurate and easy to adjust as our business grows.
Jesse Ward –
Starting my own tire business was daunting, but this template has made the financial aspect so much more manageable. It’s intuitive and covers all bases. Five stars!
Barry West –
I used this template to assess the viability of expanding our services. The detailed projections and customizable features provided exactly what I needed to make informed decisions. Excellent tool!
Dean Cole –
I’ve been in the industry for years, and this is by far the best financial model I’ve used. It helps me keep track of sales trends and manage costs effectively. Great product!
Ryan Cooper –
With multiple locations to manage, this template has made financial reporting so much simpler and more accurate. It’s clearly designed with the user in mind. A must-have for anyone in the tire business!
Asif Hameed –
As a Independent Tire Shop Owner, This model has taken the guesswork out of my inventory and sales projections. It’s incredibly user-friendly and has been a game-changer for my business planning. Highly recommend!