How to do Project Evaluation?
Introduction: What Is Project Evaluation?
Every business decision that involves committing capital to a new initiative, product line, expansion, or acquisition is a project evaluation problem. Project evaluation is the structured process of assessing whether a proposed investment will generate sufficient financial returns to justify its cost, and whether it represents the best possible use of the organization’s scarce resources.
A rigorous project evaluation answers three fundamental questions. First, will this project generate a return above the minimum acceptable threshold? Second, how does it compare to alternative uses of the same capital? Third, what risks could prevent it from delivering the projected returns?
Without a disciplined evaluation framework, organizations routinely fund projects that destroy value, delay projects that would create it, and fail to anticipate the cash demands that new initiatives place on the business. According to capital budgeting research, even companies that run sophisticated financial analyses frequently make errors when they set an inappropriate discount rate, misestimate cash flows, or apply financial criteria in isolation without qualitative judgment.
This guide covers every dimension of project evaluation: the cost of capital, the three primary financial evaluation methods, cash burn analysis, sensitivity and risk assessment, and how to combine quantitative results with qualitative judgment to make sound investment decisions.
The Purpose of Project Evaluation
The purpose of financial analysis in project evaluation is not merely to generate a number. It is to give decision-makers a structured, defensible basis for answering whether to proceed, modify, defer, or abandon a proposed investment.
Specifically, project evaluation serves to:
- Determine whether a project is expected to generate a return above the cost of capital, thus creating rather than destroying value
- Compare mutually exclusive alternatives objectively, so the organization chooses the best available option rather than simply a good one
- Identify the key variables that most significantly affect project outcomes, so management can focus attention and resources on controlling them
- Establish financial targets and milestones against which actual project performance can be measured once implementation begins
- Communicate the investment case to stakeholders, boards, and investors in a structured and credible way
Cost-benefit analysis is the backbone of project evaluation. Every cash outflow associated with the project, whether upfront investment, ongoing operating costs, or terminal costs, must be weighed against every cash inflow the project is expected to generate across its full life. This analysis must account for the time value of money, because a dollar received three years from now is worth less than a dollar received today.
The Cost of Capital and the Hurdle Rate
Before any calculation can be performed, the evaluator must establish the minimum acceptable rate of return for the project. This is called the hurdle rate, and for most companies it is anchored to the Weighted Average Cost of Capital (WACC).
What Is WACC?
WACC is the blended cost of all capital a company uses, combining the cost of equity (what shareholders require as a return) and the after-tax cost of debt (what lenders charge), weighted by the proportion each contributes to the total capital structure.
WACC Formula: WACC = (E/V) x Re + (D/V) x Rd x (1 – Tc)
Where E is the market value of equity, D is the market value of debt, V is total capital (E + D), Re is the cost of equity, Rd is the cost of debt, and Tc is the marginal corporate tax rate.
WACC represents the minimum return the company must earn on its investments to satisfy both its equity investors and its debt holders. Any project that earns less than the WACC destroys shareholder value, regardless of whether it shows an accounting profit.
Setting the Hurdle Rate
Most organizations set their project hurdle rate at or above the WACC, then adjust it upward for projects carrying higher risk than the company’s typical operations. A high-risk technology project in a new market might carry a hurdle rate 3 to 5 percentage points above the base WACC, while a low-risk capacity expansion in a proven business might use WACC directly.
Setting the hurdle rate too high causes the organization to reject profitable projects. Setting it too low causes the organization to approve value-destroying investments. Getting this rate right is one of the most consequential financial decisions in the project evaluation process.
For companies financed entirely by debt, the after-tax cost of debt serves as the hurdle rate. For companies with both debt and equity, the WACC is the appropriate starting point.
Key Criteria for Project Evaluation
Two foundational factors must be established before applying any quantitative method.
Project Cost: The evaluator must develop a complete picture of total project investment, including initial capital outlay, working capital requirements, implementation costs, and any one-time setup or licensing costs. An incomplete cost estimate is among the most common causes of project financial disappointment.
Time Value of Money: A core principle of all project evaluation is that cash flows occurring at different points in time cannot be directly compared without adjustment. Money available today can be invested to earn returns; therefore, future cash flows are worth less than present ones in proportion to the discount rate and the length of time. All serious project evaluation methods account for this principle.
The Three Core Project Evaluation Methods
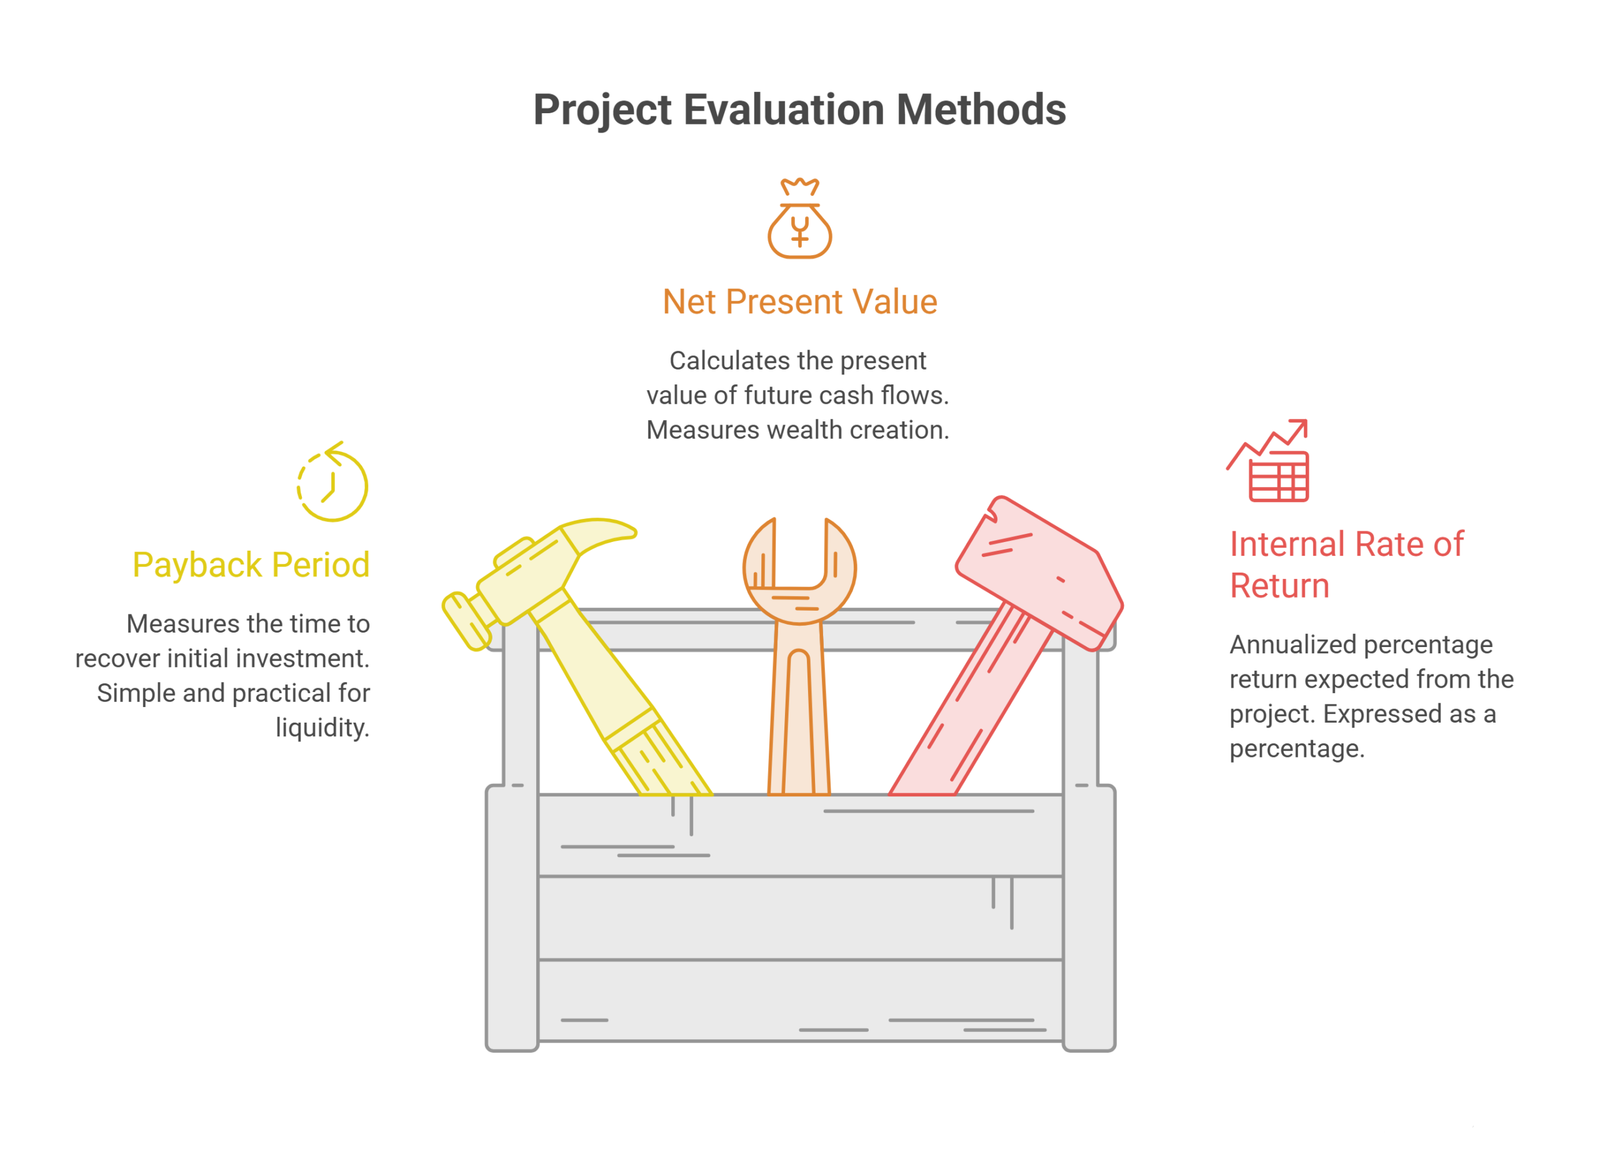
Financial theory and practice have converged on three primary methods for evaluating projects. Each provides a different lens on the investment opportunity, and their most effective use is in combination rather than individually.
1. Payback Period
Formula: Payback Period = Initial Investment / Annual Cash Inflows
The payback period measures the length of time required for a project to generate enough cumulative cash inflows to recover its initial investment. It is the simplest and most intuitively understood measure of project risk: a project that pays back in two years carries less risk of capital loss than one that pays back in eight, because less time is available for circumstances to change adversely.
How to interpret it: A payback period shorter than the organization’s maximum acceptable threshold is a condition for proceeding. Most organizations define cut-off periods of two to four years for standard projects, though capital-intensive industries with long asset lives may accept longer payback periods.
Strengths: Simple to calculate, easy to communicate, provides a practical liquidity check, and directly addresses the question of how quickly committed capital is at risk.
Limitations: The payback period ignores all cash flows that occur after the payback point, meaning a project with modest early returns but exceptional long-term value would be penalized. It also does not account for the time value of money, so two projects with the same payback period but different cash flow timing profiles are treated as equivalent when they are not.
For this reason, some organizations use the Discounted Payback Period, which applies time-value adjustments to each cash flow before calculating the cumulative recovery period. This hybrid metric preserves the simplicity and risk intuition of the payback period while correcting its most significant mathematical weakness.
Best use: As a screening tool for risk and liquidity, used alongside NPV and IRR rather than in isolation. It answers “how quickly do we get our money back?” but not “how much value does this project create?”
2. Net Present Value (NPV)
Formula: NPV = Sum of [Cash Flow / (1 + discount rate)^t] – Initial Investment
Net Present Value is widely regarded by financial theorists and practitioners as the single most reliable metric for project evaluation. It calculates the present value of all future net cash flows generated by the project, using the hurdle rate as the discount rate, and then subtracts the initial investment. The result is the dollar value of wealth the project is expected to create or destroy.
Decision rule:
- NPV greater than 0: the project is expected to generate returns above the cost of capital and should be accepted
- NPV equal to 0: the project is expected to exactly recover the cost of capital with no surplus value created
- NPV less than 0: the project destroys value and should be rejected unless compelling strategic reasons exist
For mutually exclusive projects (where only one can be selected), the project with the highest positive NPV creates the most value and should be chosen, even if a competing project has a higher percentage return.
Strengths: NPV accounts for the time value of money across the full project life, directly measures the dollar value of wealth creation, and handles any cash flow pattern including irregular, negative, or declining flows. It is the theoretically correct approach to ca pital budgeting.
Limitations: NPV is highly sensitive to the discount rate assumption. A discount rate that is 2 percentage points too high or too low can significantly change whether a long-duration project appears value-creating or value-destroying. It also requires accurate long-term cash flow forecasts, which carry inherent uncertainty, especially for novel or complex projects.
Key insight: NPV greater than zero does not mean the project is profitable in an accounting sense. It means the project is expected to earn more than the minimum required return embedded in the discount rate. This distinction matters when communicating results to non-financial stakeholders.
3. Internal Rate of Return (IRR)
Formula: IRR is the discount rate at which NPV equals 0
The Internal Rate of Return is the annualized percentage return that the project is expected to generate over its life. It answers the question: “What rate of return does this investment actually deliver?” rather than “How much dollar value does it create?”
Decision rule:
- IRR greater than the hurdle rate: accept the project
- IRR less than the hurdle rate: reject the project
- For mutually exclusive projects: prefer the project with the higher IRR, but cross-check with NPV
Strengths: IRR is intuitive, expressed as a percentage return, and directly comparable to the cost of capital and to returns from alternative investments. It is widely understood by non-financial executives and investors, making it an effective communication tool.
Limitations: IRR can produce multiple solutions when project cash flows change sign more than once (for example, large cash inflows followed by decommissioning costs). For mutually exclusive projects, the highest IRR does not always identify the project that creates the most wealth: a smaller project with a higher IRR may be inferior to a larger project with a lower but still positive NPV contribution. When IRR and NPV conflict, NPV should generally take precedence.
NPV vs. IRR: These two metrics often agree, but when they conflict for mutually exclusive choices, the project that maximizes NPV is the correct selection. The goal is to maximize the absolute value of wealth created, not the percentage rate of return on any single investment.
What Is the Cash Burn Rate in Project Evaluation?
For startups and growth-stage companies, cash burn rate is one of the most critical project evaluation metrics because it determines how long the organization can fund operations before exhausting available capital.
Formula: Cash Burn Rate = (Ending Cash Balance – Beginning Cash Balance) / Number of Months
A negative result indicates net outflow, which is typical for early-stage ventures investing ahead of revenue.
The burn rate tells you not just how much cash is leaving the business but how fast. Combined with current cash reserves, it determines the runway: the number of months the company can continue operating before it must either reach profitability or secure additional funding.
Gross burn vs. net burn:
- Gross burn is the total monthly cash outflow across all expense categories
- Net burn is total monthly outflows minus total monthly revenue, representing the net cash consumed each month
A positive net burn rate means the company is consuming more cash than it generates, requiring the CFO or founder to take action: cut costs, accelerate revenue, or raise capital. A negative net burn rate means the business is self-sustaining.
Why it matters in project evaluation: When evaluating a new project, the incremental cash burn it introduces must be modeled alongside existing obligations. A project with a strong long-term NPV can still threaten the survival of the company if its near-term cash demands exceed available liquidity. Project evaluation must therefore consider not only long-run returns but the cash flow profile month by month through the investment and ramp-up period.
Benchmark: Most investors in growth-stage companies expect the burn rate to be sustainable relative to the cash runway remaining. A runway shorter than 12 months at current burn typically triggers immediate action. A runway of 18 to 24 months provides comfortable operational flexibility.
Sensitivity Analysis and Risk Assessment
No project evaluation is complete without examining how the conclusions change when key assumptions are wrong. Sensitivity analysis is the process of varying one input at a time to determine which variables most significantly affect the project’s NPV, IRR, or payback period.
Why Sensitivity Analysis Matters
Every project financial model relies on assumptions about future revenues, costs, growth rates, discount rates, and timing. None of these assumptions will be exactly right. Sensitivity analysis identifies which assumptions matter most, allowing management to focus monitoring and risk mitigation where they will have the greatest impact.
For example, if a 10 percent decline in revenue reduces the project’s NPV by 80 percent, then revenue growth is a critical risk factor that deserves intensive focus in the business plan, in sales execution, and in contingency planning. If a similar cost overrun reduces NPV by only 5 percent, cost management is a lower priority risk.
Scenario Planning
Beyond single-variable sensitivity analysis, scenario planning creates distinct financial projections under defined combinations of assumptions:
- Base case: the most probable outcome given reasonable assumptions
- Upside case: outcomes assuming favorable conditions materialize, such as faster market adoption or lower costs
- Downside or stress case: outcomes under adverse conditions, such as a market downturn, cost overrun, or delayed revenue
Each scenario should be internally consistent rather than simply applying uniform percentage adjustments to all inputs. A recession scenario, for instance, affects revenue, pricing power, collection periods, and cost inflation simultaneously and in ways that are interrelated.
Key Risk Factors to Evaluate
- Revenue forecast accuracy, including the assumptions underpinning sales volume and pricing
- Cost structure stability, particularly for projects with significant variable cost components
- Timing risk, since delays in project completion or revenue generation can materially reduce NPV even when eventual cash flows materialize as planned
- Market and competitive risk, including the possibility that competitive responses erode projected market share or margins
- Regulatory and compliance risk, especially for projects in regulated industries or geographies
- Execution risk, which reflects the organization’s track record in delivering similar initiatives on time and on budget
Qualitative Factors in Project Evaluation
Financial metrics provide an essential foundation, but they are never the sole basis for project decisions. Organizations frequently pursue projects with sub-threshold financial returns because of strategic positioning, competitive necessity, or organizational capability-building. Equally, organizations sometimes pass on financially attractive projects because of ethical concerns, strategic misalignment, or resource constraints not captured in the numbers.
Qualitative factors that should be considered alongside financial metrics include:
Strategic alignment: Does the project advance the organization’s stated long-term strategy, or does it represent a distraction from the core business?
Competitive necessity: Is this investment required to maintain competitive parity, regardless of its standalone financial return? Failing to modernize systems or match a competitor’s service offering may have a greater cost than the measured NPV of the investment.
Organizational capability: Does the company have the talent, systems, and management bandwidth to execute this project successfully? A technically sound project that exceeds the organization’s execution capability is a worse investment than a less ambitious project that the team can deliver with excellence.
Optionality value: Some projects create strategic options, the ability to pursue larger future opportunities, that are not captured in the base case financial model. Real options analysis is a formal method for quantifying this value, though qualitative recognition of optionality is valuable even without the formal calculation.
Stakeholder and reputation effects: The impact of a project on customer relationships, employee engagement, supplier trust, and community standing can be economically significant even when not easily quantifiable.
Selecting the Right Evaluation Method
No single evaluation method is universally superior in all situations. The choice of method, and how heavily to weight each metric, depends on the nature of the project, the organization’s financial position, and the purpose of the evaluation.
| Situation | Recommended Approach |
| Screening large numbers of projects quickly | Payback Period as initial filter |
| Choosing between mutually exclusive alternatives | NPV as primary criterion, IRR for context |
| Communicating investment case to non-financial executives | IRR alongside NPV |
| Evaluating projects with irregular or multi-stage cash flows | NPV with detailed cash flow modeling |
| Early-stage startups with capital constraints | Cash burn rate and payback period alongside NPV |
| Projects with strategic value beyond financial returns | NPV combined with qualitative scoring framework |
In practice, rigorous project evaluation uses all three primary financial metrics together, supplemented by cash burn analysis where liquidity is a concern, and integrated with a structured qualitative assessment for major strategic investments.
Practical Steps: How to Conduct a Project Evaluation
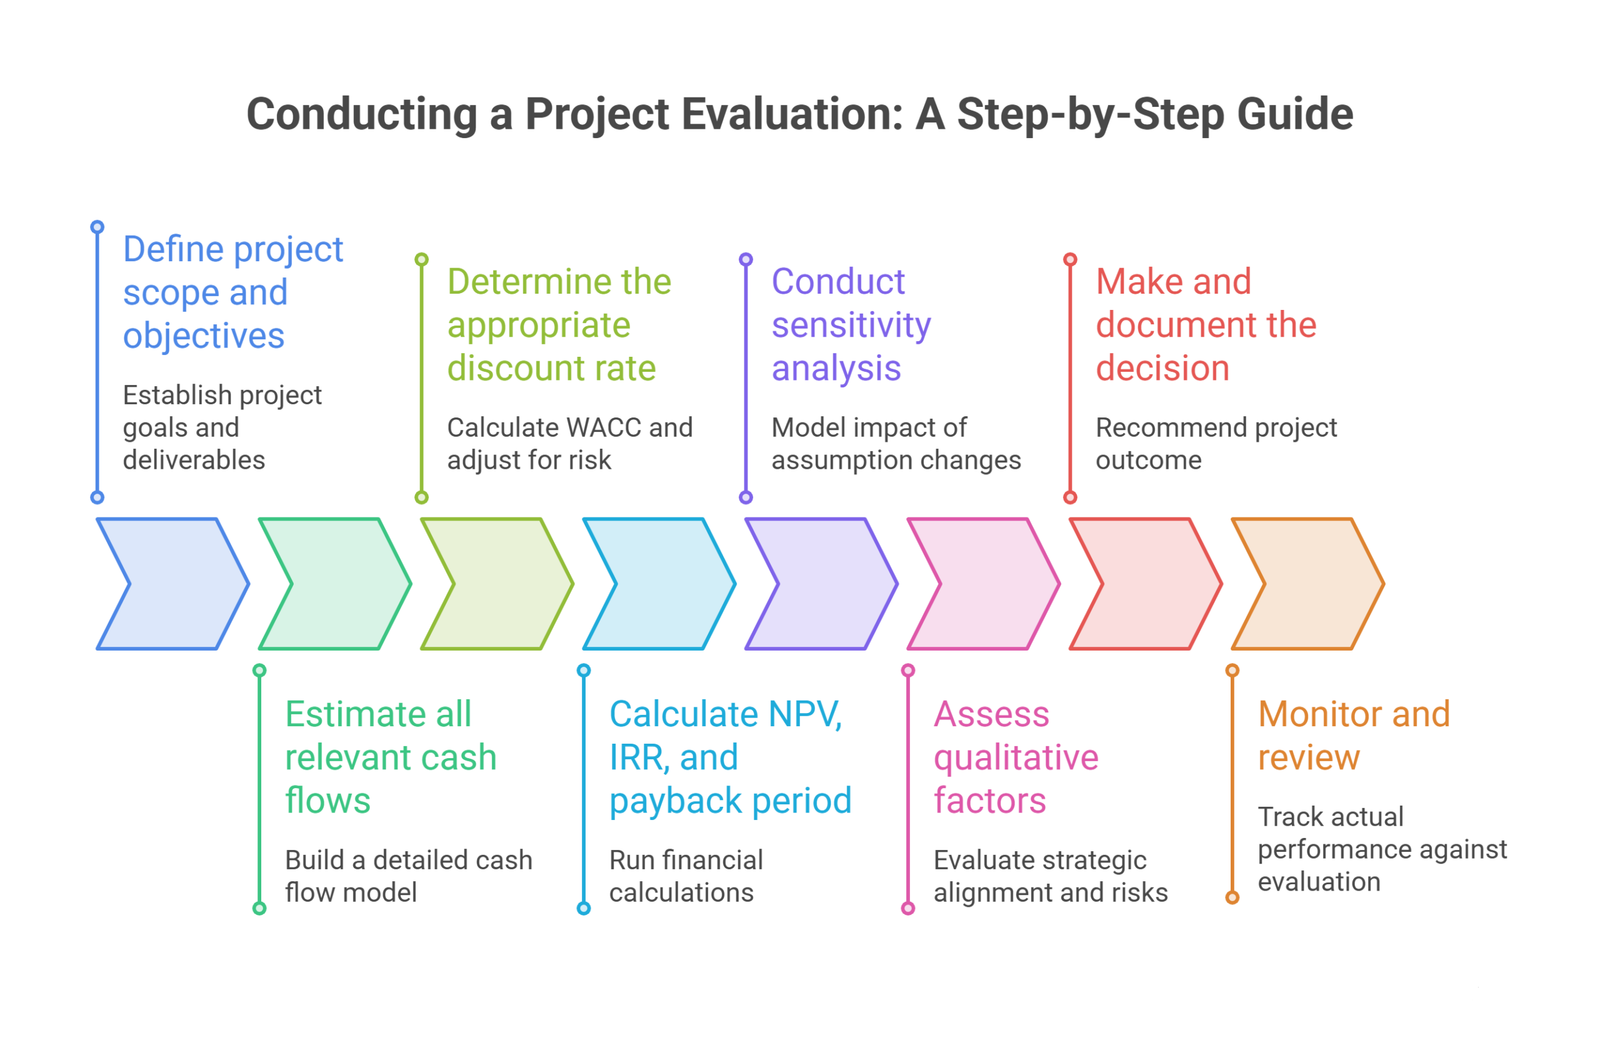
A well-structured project evaluation follows a consistent sequence regardless of project type or size.
Step 1: Define project scope and objectives. Establish exactly what the project will deliver, what it will cost, and what success looks like in measurable terms. Ambiguity at this stage propagates into every subsequent calculation.
Step 2: Estimate all relevant cash flows. Build a detailed cash flow model covering the full project life, including initial investment, operating cash flows in each period, working capital changes, and terminal or residual value. Be conservative in revenue estimates and thorough in identifying costs.
Step 3: Determine the appropriate discount rate. Calculate the company’s WACC and adjust for project-specific risk. Document the basis for this rate so that it can be reviewed and challenged.
Step 4: Calculate NPV, IRR, and payback period. Run all three calculations on the projected cash flows and document the results clearly.
Step 5: Conduct sensitivity analysis. Identify the top three to five assumptions that most significantly affect NPV. Model the impact of adverse changes in each, both individually and in combination.
Step 6: Assess qualitative factors. Evaluate strategic alignment, execution risk, competitive necessity, and optionality against a consistent qualitative framework.
Step 7: Make and document the decision. Based on the combined financial and qualitative assessment, make a clear recommendation to proceed, modify, defer, or reject the project. Document the basis for the decision so that future reviews can compare actual outcomes to the original investment thesis.
Step 8: Monitor and review. Once a project is approved and implemented, track actual cash flows and key metrics against the evaluation model. Variance analysis reveals where assumptions were wrong and builds institutional knowledge that improves future evaluations.
Frequently Asked Questions
Which method is best: NPV, IRR, or payback period?
NPV is theoretically superior because it measures absolute dollar value created and accounts for the full project life. IRR is useful for communication and comparison but can mislead on mutually exclusive choices. Payback period is a practical risk and liquidity screen. Use all three together rather than relying on any single metric.
What discount rate should I use for NPV?
Start with the company’s WACC, which represents the blended cost of equity and debt capital. Adjust upward for projects with higher-than-average risk. The hurdle rate should reflect the opportunity cost of committing that capital rather than deploying it elsewhere.
What is a good IRR for a project?
Any IRR above the hurdle rate is technically acceptable. In practice, most organizations prefer a margin of safety, so an IRR meaningfully above the WACC, commonly 3 to 5 percentage points or more, provides confidence that the project remains viable even if assumptions prove slightly optimistic.
When should a company use payback period over NPV?
Payback period is most useful when liquidity is constrained and recovery speed matters more than total return, or as a quick screen to eliminate obviously unattractive projects before conducting a full NPV analysis. It should supplement NPV rather than replace it.
What is cash burn rate and why does it matter in project evaluation?
Burn rate measures the net cash a business consumes per month. In project evaluation, it determines whether the company can sustain the project’s cash demands until it reaches self-funding. Even a high-NPV project can threaten solvency if its near-term burn is unmanageable relative to available cash reserves.
Conclusion
Project evaluation is one of the highest-leverage activities in financial management. A disciplined approach that combines a correctly calibrated hurdle rate, rigorous NPV, IRR, and payback period analysis, honest cash burn assessment, thorough sensitivity testing, and informed qualitative judgment gives organizations the foundation to allocate capital where it creates the most value.
No financial model predicts the future with certainty. The purpose of project evaluation is not to eliminate uncertainty but to understand it, quantify it, and make decisions that are robust across a realistic range of outcomes. Organizations that build this discipline into their investment processes consistently outperform those that make capital allocation decisions based on intuition or incomplete analysis alone.
The strongest investment decisions are those where the financial case is clear, the key risks are understood and manageable, and the project is aligned with the organization’s long-term strategy. Project evaluation is the structured process that makes this convergence possible.
A project can boast an exceptional long-term $IRR$ on paper, but if its near-term net cash burn exceeds your runway, it threatens the survival of your business. Balancing long-run returns with month-by-month cash constraints requires rigorous financial stewardship. Oak Business Consultant provides specialized Corporate Finance Consulting to help growth-stage companies run comprehensive cost-benefit analyses, map out discounted payback periods, and accurately forecast the true operational cash tail of new projects. Schedule a free capital allocation strategy session.