Modeling a Fintech for Africa’s Unbanked: a Financial Model Case Study
Client overview
A mobile banking startup for Africa’s unbanked faces a forecasting problem that most fintechs never meet. Each customer is small. Transactions are frequent but low in value. Many customers have never held a bank account, so nobody can say how they will behave. Investors still want a three-year model they can test line by line.
This client wanted to let people in underserved markets store, transfer and exchange digital assets from a mobile phone. It had seven months of financial data, most of it unstructured, and a funding round to prepare for.
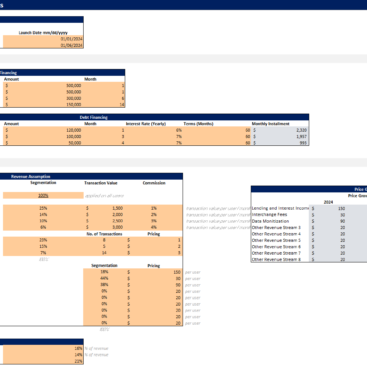
Oak built an investor-ready financial model around that thin record. The model was driver-based. Every revenue line, cost line and cash movement traced back to a short list of operating assumptions that the founders could change. Planning a payments and lending fintech instead? Read how Oak modeled debt versus equity funding for a peer payments startup.
Why unbanked-market fintechs are hard to model
Four features set this business apart from a standard app startup. A model that ignores them looks fine on paper and fails in the first year of trading.
Small tickets, high volume
Fee revenue is a percentage of small transactions. Average ticket size and transactions per user matter more than the number of sign-ups. A user who registers and never transacts earns nothing.
Activation matters more than acquisition
Where trust in financial products is still forming, many people sign up and never use the service. A model that counts sign-ups overstates revenue. It also understates what each active user really costs to win.
Cash still moves through people
If customers hold cash, the product usually relies on partners or agents to turn cash into digital balances and back. Those partners earn commissions, often serve several providers at once, and add fraud and compliance risk. Their economics belong in the model.
Revenue and costs sit in different currencies
Revenue arrives in local currency. Cloud services, vendors and some licenses are often priced in dollars. A currency move can change margins even when volumes stay flat.
Challenges faced by the client
The client had seven specific problems. Each one shaped how the model had to be built.
Limited historical data
Seven months of records is a short baseline, and much of it was unstructured. Before any forecasting, the team had to rebuild a clean income statement, cash flow statement and balance sheet from fragments.
Several revenue streams
Income came from transaction fees, commissions and subscriptions. Each stream had its own price and driver, and third-party integrations added fee structures that moved margins. One blended growth rate would have hidden all of that.
No acquisition cost framework
Without a customer acquisition cost (CAC) framework, nobody could judge customer lifetime value (CLV) or the CLV to CAC ratio. Investors look at that ratio early.
Investor-grade projections
The client needed IRR, NPV, burn rate and return on invested capital (ROIC) that an investor could trace back to assumptions. A simple revenue forecast would not do.
Moving operating costs
Compliance, platform development and customer onboarding costs were still changing. The model had to flex when they did, rather than lock in one guess.
Poor cash flow visibility
The team could not see cash inflows, cash gaps and capital spending in one place. Liquidity was hard to plan, and expansion was harder.
Market and regulatory uncertainty
Emerging markets bring uneven financial infrastructure and rules that change. The client needed to know how its finances would hold up if conditions turned.
How the financial model was built
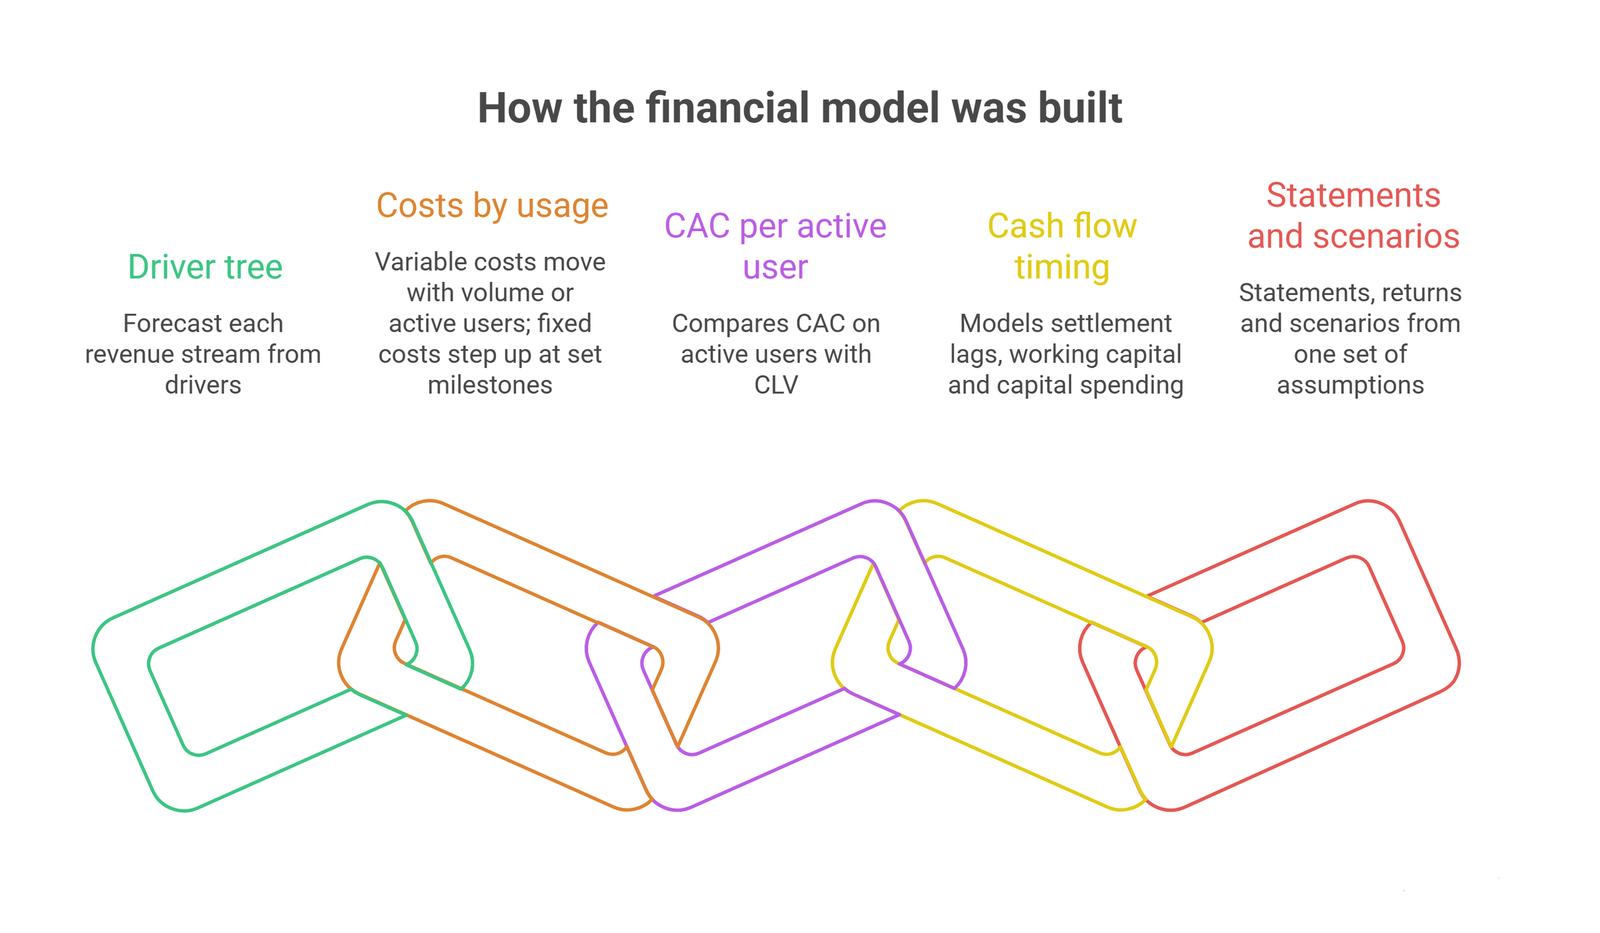
Oak started from the data, not from a template. The seven months of statements and transaction records were cleaned and loaded first, so the forecast began from what the business had actually done. Then the model was built in five layers.
Layer 1: a driver tree for each revenue stream
Each stream is forecast from drivers, not from a growth percentage.
| Revenue line | Drivers |
| Transaction fees | Active users x transactions per user x average ticket x fee rate |
| Partner commissions | Referred volume x commission rate |
| Subscriptions | Subscribers by tier x monthly price x retention |
Active users come from sign-ups multiplied by an activation rate, then reduced by monthly churn. That one step separates a sign-up forecast from a revenue forecast.
Layer 2: costs that scale with usage
Variable costs move with volume or active users. These include partner and processing fees, KYC checks, support and fraud losses. Fixed costs, such as platform development, licenses and core staff, step up at set milestones. Splitting the two shows the volume at which the business breaks even.
Layer 3: CAC measured per active user
The model calculates CAC on active users, not on sign-ups. It includes marketing, onboarding and KYC costs, plus any incentives paid to partners. It then compares that figure with CLV, built from contribution margin per user rather than revenue.
Layer 4: cash flow with timing
Revenue and cash do not arrive together. The cash flow statement models settlement lags with partners, the working capital the business must keep available, and capital spending on the platform. The output is a monthly cash balance and the lowest point it reaches.
Layer 5: statements, returns and scenarios
The income statement, cash flow statement and balance sheet update from one set of assumptions. IRR, NPV, burn rate and ROIC come from the same model. A KPI dashboard shows burn rate, cash gaps and monthly growth in one view.
Why activation drives payback
Oak measures CAC per active user because the two ratios behave very differently.
CAC per active user = CAC per sign-up / activation rate
Payback period = CAC per active user / monthly contribution margin per active user
Contribution margin here is fee revenue minus partner and processing fees, support and fraud losses. It is not revenue. If the activation rate halves, the cost of each active user doubles, and payback doubles with it. Nothing about the product or the marketing spend has changed.
That is why the model treats activation as its own driver and why the sensitivity analysis starts with it. Transactions per user and the fee rate come next.
Scenarios that matter for this market
Scenario analysis tested operating expenses, market conditions and conversion rates. For a fintech in an emerging market, four shocks are worth running:
- Activation falls below plan because trust builds slower than expected
- Partner fees or commissions rise because partners also serve competitors
- A license or regulatory approval slips by several months while costs keep running
- The local currency weakens against the dollar while vendor costs stay in dollars
Each shock shows up in the same three places: the lowest cash balance, the month of breakeven and the funding the business needs. Founders can then size a raise against the downside case instead of the base case.
Outcome
The client received an investor-ready model that tied revenue, costs and cash into one set of statements. Because assumptions fed every statement, the founders could change an activation rate and watch the cash flow update.
With seven months of actual data as the baseline, the team could show investors which numbers came from history and which were estimates. Burn rate and cash gaps were visible month by month. The CLV to CAC view gave marketing spend a measurable test, and the funding ask could be sized against the downside case. The model became a tool for running the business as well as raising money for it.
Five modeling mistakes to avoid in an emerging-market fintech
- Counting sign-ups as customers. Model activation and churn, and measure CAC on active users.
- Forecasting from market share. “One percent of the market” is not a forecast. Build revenue from users, transactions and fees.
- Leaving partner economics out. Commissions, settlement lags and multi-provider agents all change margin and cash.
- Ignoring currency. If costs are in dollars and revenue is local, test a weaker local currency.
- Treating compliance as a one-time cost. Licensing, audits and reporting recur, so give them their own lines.
What’s in it for you?
A weak model shows up later as flawed budgets, surprise compliance bills and investors who cannot see how the business scales. Founders in emerging markets face the same gaps this client did.
Start with the assumptions you can defend from real data. Mark the rest as estimates and test them. Oak’s fintech Excel financial model is a good starting point if you want a template before commissioning a custom build. For another Africa-based payments business, see Oak’s digital payment case study.
Frequently Asked Questions
How do you build a fintech financial model with only a few months of data?
Use the actual months as the baseline and label everything else as an assumption. Extend the data with benchmarks, then run scenarios to show how far the forecast moves if an assumption is wrong. Investors tend to accept thin data when the gaps are visible.
Why measure CAC per active user instead of per sign-up?
Only active users generate fee revenue. The true cost of an active user is the cost of a sign-up divided by the activation rate, so it is always higher. Measuring on sign-ups makes payback look shorter than it is.
Which revenue streams should a mobile banking fintech model separately?
Any stream with its own price or driver. That usually means transaction fees, commissions, subscriptions and lending income, if the product offers it. Splitting them shows which stream carries recurring revenue and which depends on third-party fees.
What investor metrics belong in a fintech financial model?
IRR, NPV, burn rate, ROIC, monthly recurring revenue and the CLV to CAC ratio. Add cash runway and the lowest cash balance in the downside case. In emerging markets, investors also look at the discount rate used in NPV, so state it and explain it.
How do you model regulatory uncertainty?
Enter licensing, legal and audit costs as their own inputs. Then run a scenario where those costs rise or a launch slips by several months. The result shows how much cash buffer the business needs.
How often should a fintech update its financial model?
Monthly at minimum. Compare actual results with the forecast and revise the assumptions that missed. Update it more often during a fundraising round.
Conclusion
Thin data does not rule out a credible model. It rules out false precision. Seven months of records could not predict three years, but they could anchor a forecast, and scenario analysis showed where that forecast was most likely to break. A model that admits what it does not know is easier for an investor to trust.
Build a fintech model investors can test
Oak builds dynamic financial models for fintech founders, from first forecast to investor-ready statements. Book a free consultation to review your assumptions, or explore Oak’s financial modeling services.