


Fintech Financial Model Template


Original price was: $300.$150Current price is: $150.
A simple to use Fintech Financial Model Template for those who have just entered into the market. The Fintech Model template includes multiple revenue inputs and separate tables for expenses. A great tool for forecasting and financial planning. The excel template will enable you to check whether the company is profitable and under what circumstances the business might face losses.
Frequently Bought Together
- Description
- Reviews (7)
Description
Unlock Your Fintech SaaS Startup’s Financial Potential
Navigating the financial complexities of a fintech startup requires more than just a great idea – it demands a solid foundation and a robust financial roadmap. Our expert-built 5-year Excel financial model is your comprehensive forecasting tool, designed to provide accurate financial projections and optimize your business model.
What Can You Calculate?
This powerful easy-to-use fintech financial model empowers you to:
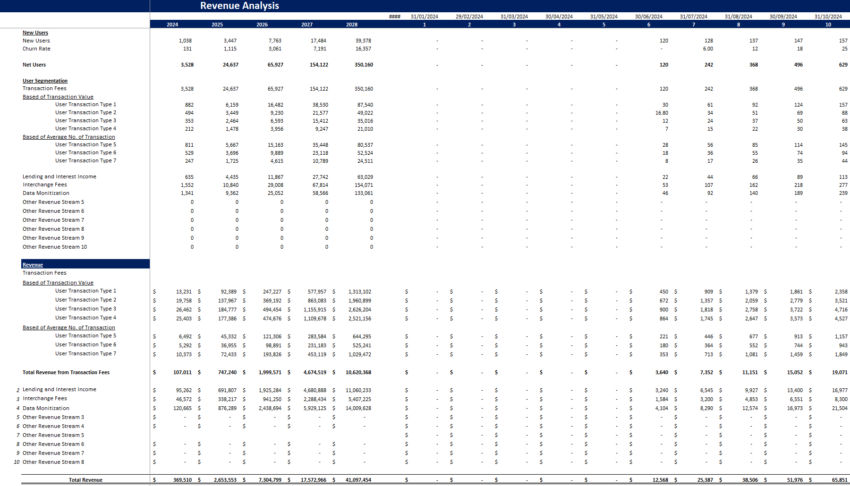
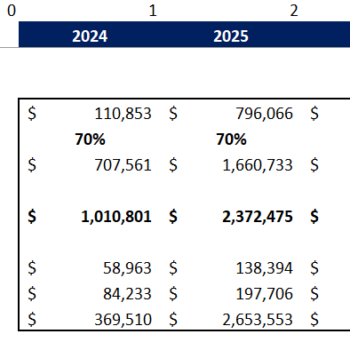
- Project Revenue & Growth: Accurately forecast revenue streams, track revenue growth rate, and understand future revenue drivers with our detailed revenue analysis sheet.
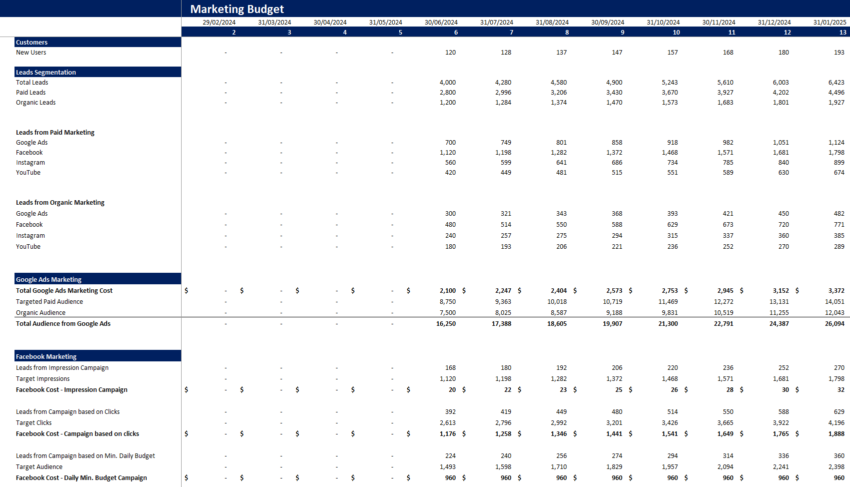
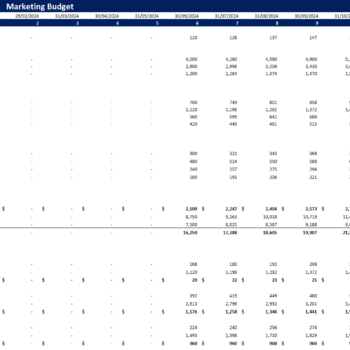
- Manage Marketing Spend: Optimize your marketing budget, track campaign performance, and understand customer acquisition costs and onboarding costs.
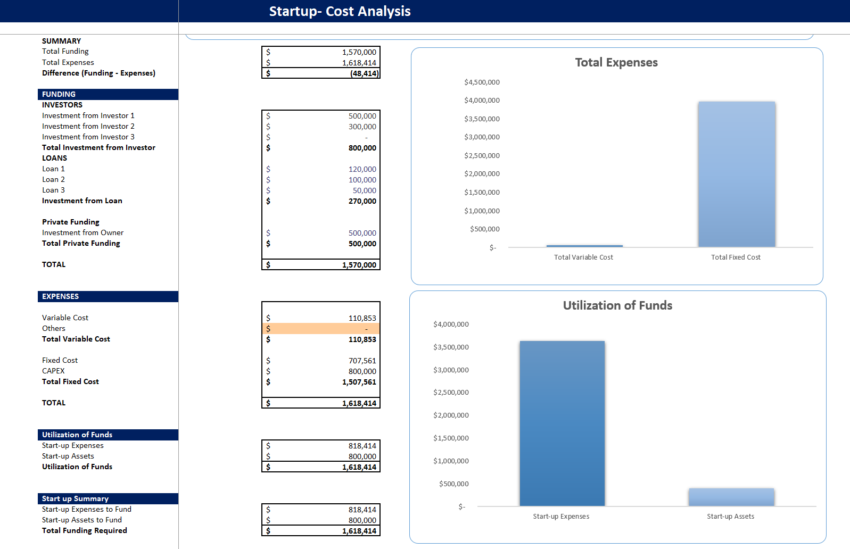
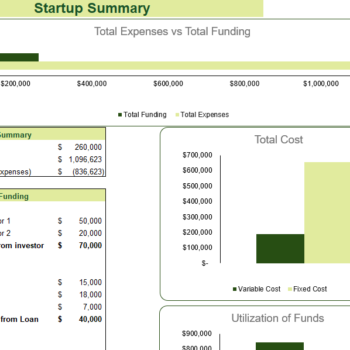
- Assess Startup Costs: Visualize initial funding, direct costs, overhead costs, and expense categories, identifying cash gaps early.
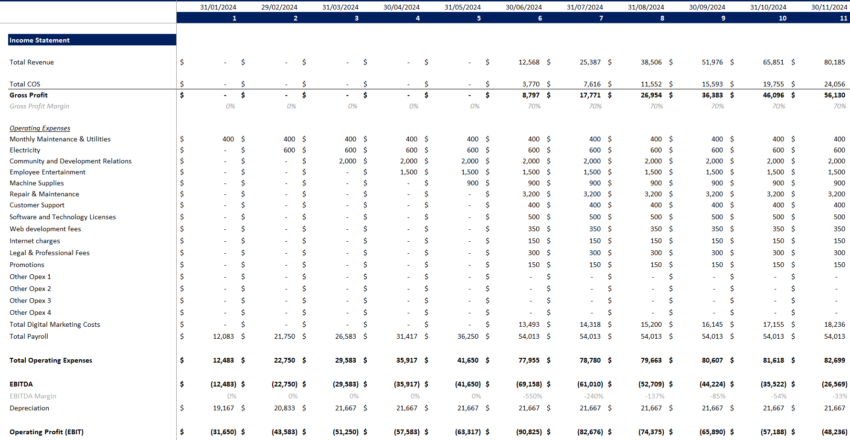
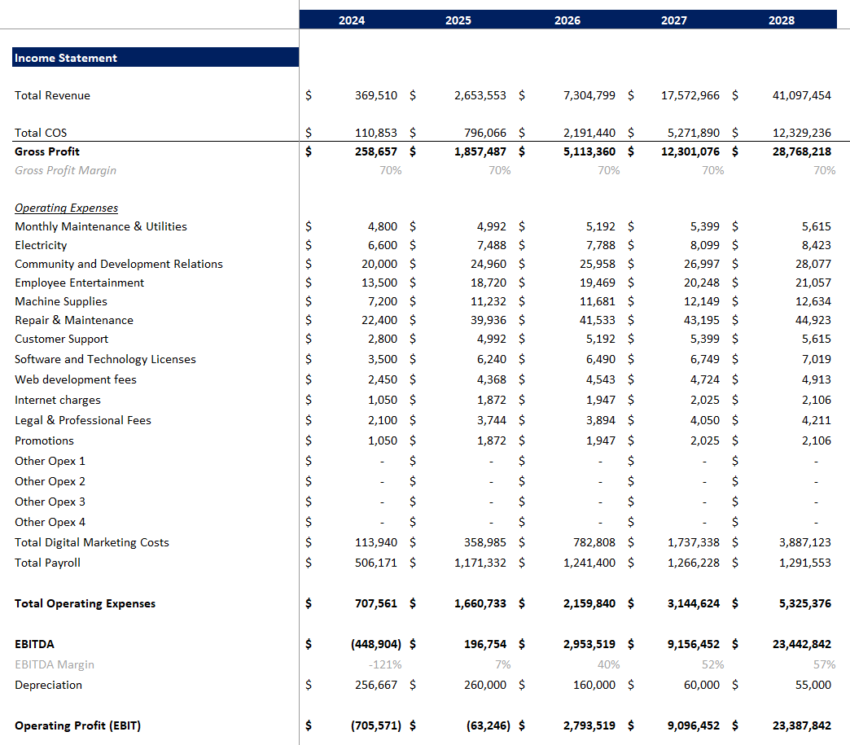
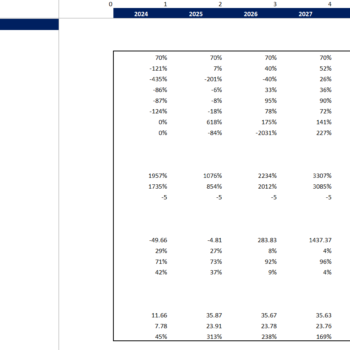
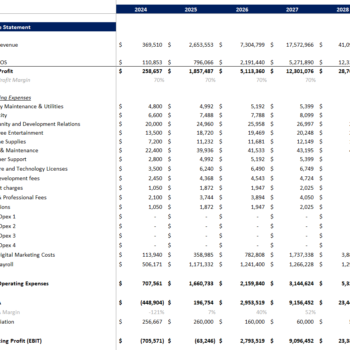
- Track Profitability: Monitor profitability ratios and key metrics like operating profit, profit after tax, EBITDA, net income, and margins, understanding your financial performance.
- Analyze Financial Position: Gain a snapshot of your current assets, operating assets, liabilities, and equity with detailed balance sheets.
- Determine Break-Even Point: Calculate the monthly sales revenue needed to achieve profitability with our Breakeven Analysis, crucial for strategic planning.
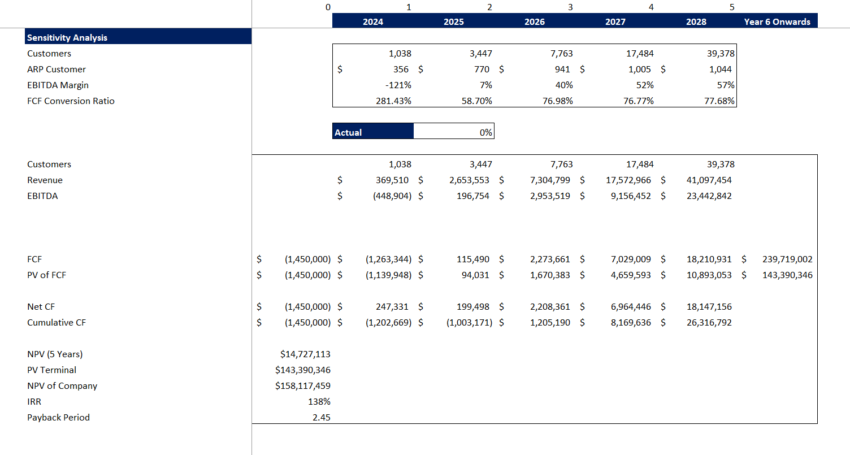
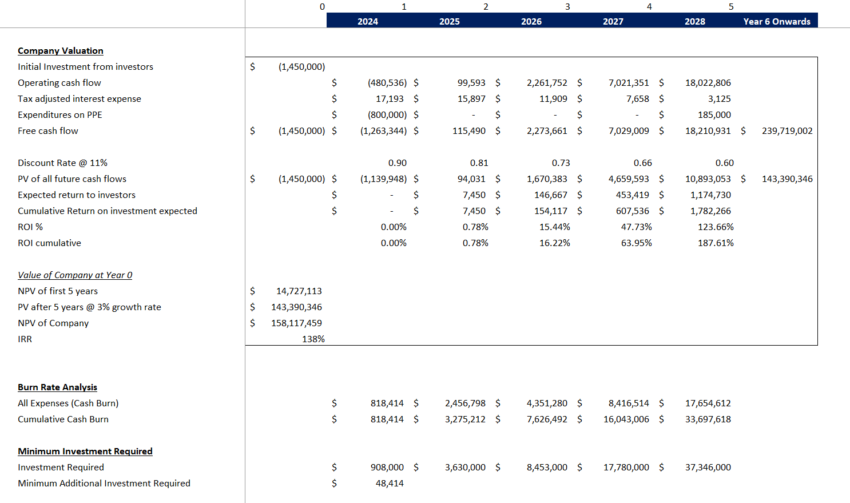
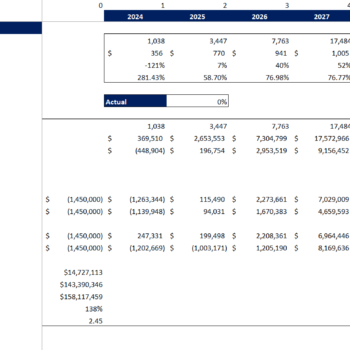
- Evaluate Company Valuation: Estimate your company valuation using industry-standard methods, essential for fundraising.
- Identify Risk Factors: Understand the impact of changing key assumptions and market conditions on your financial forecasts with sensitivity analysis.
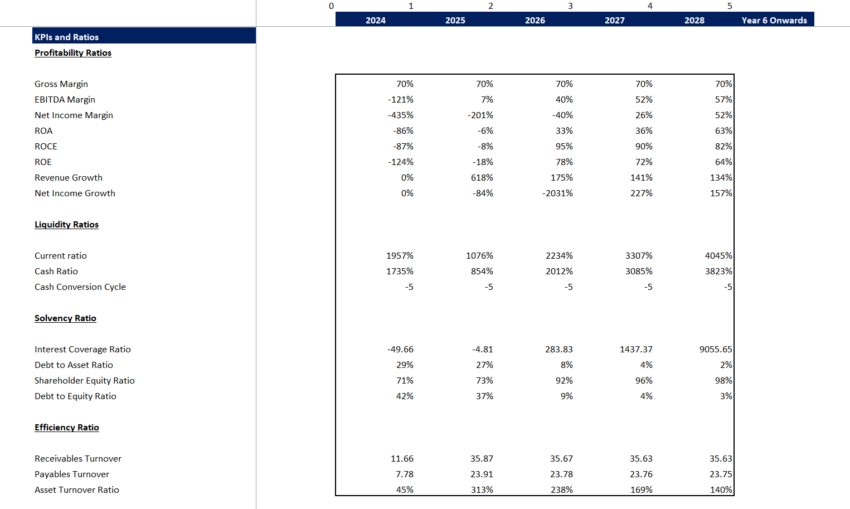
- Analyze Financial Performance: Assess profitability, liquidity, solvency, and efficiency with financial ratio analysis.
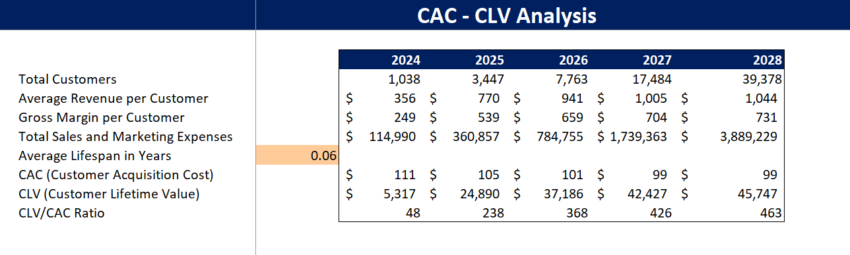
- Optimize Customer Economics: Analyze CAC and CLV to understand customer profitability and optimize acquisition strategies.
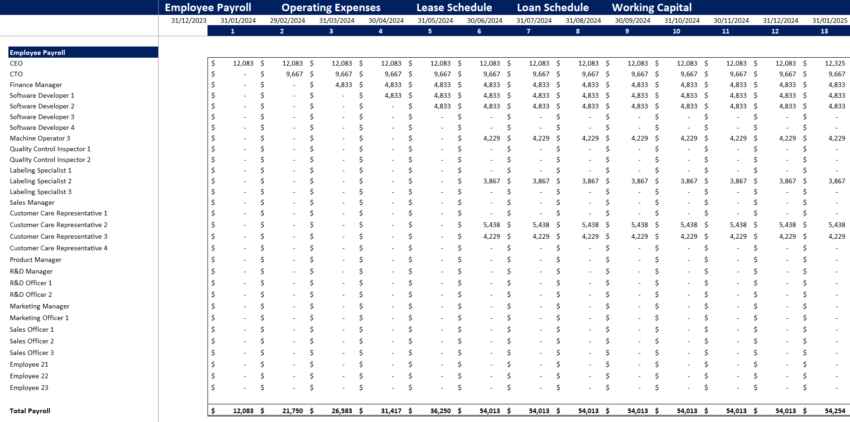
- Manage Operational Data: Track payroll, operational expenses, administrative expenses, leases, loans, and working capital with detailed calculations.
- Visualize Financial Insights: Gain a clear overview of your financial performance with a dynamic dashboard, highlighting key performance indicators.
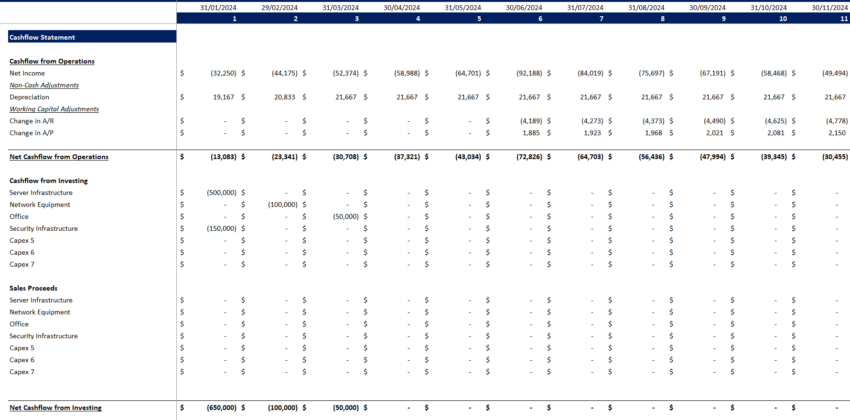
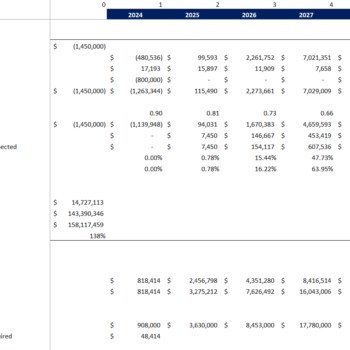
- Analyze Cash Flow: Monitor cash inflows and cash outflows with detailed cash flow analysis and cash flow projections, including monthly cash flow statements and cash balance.
Key Features of the Template:
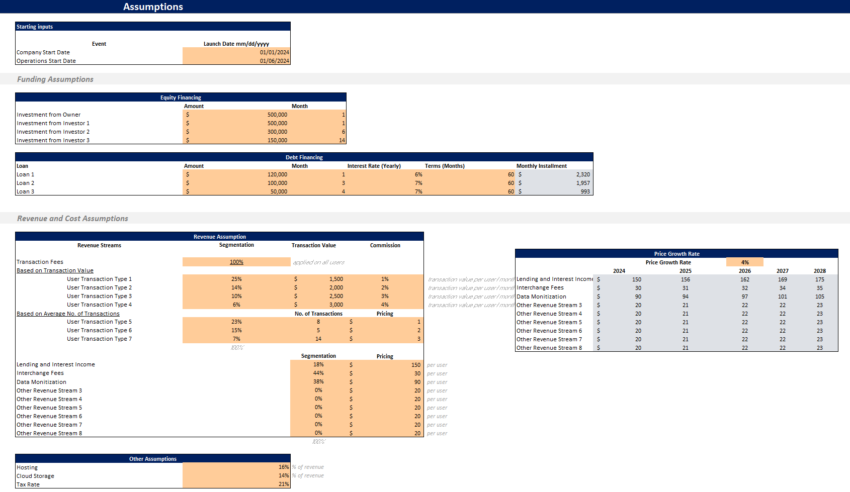
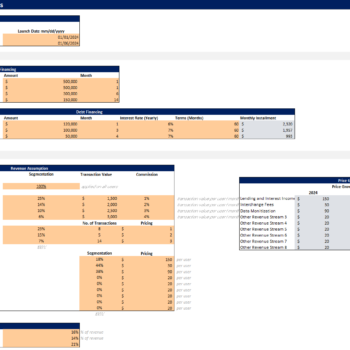
- Input Sheet: Customize the model with your specific model assumptions, average cost, hourly cost, and percentage of revenues, from funding to operational costs.
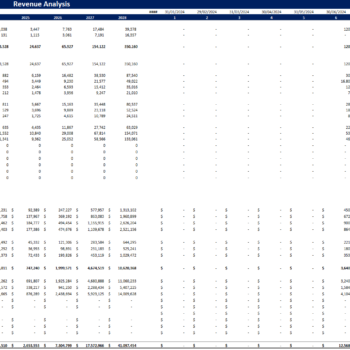
- Revenue Analysis: Visualize and analyze your customizable revenue streams with detailed monthly and annual projections for income statements.
- Marketing Budget: Track and optimize your monthly marketing budget across various channels and campaigns.
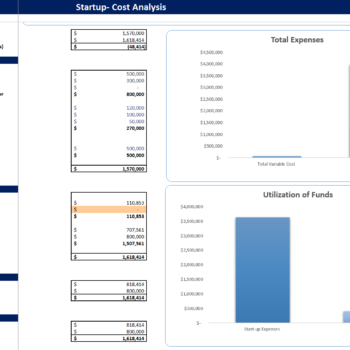
- Startup & Cost Analysis: Gain a clear picture of your initial financial position and funding needs.
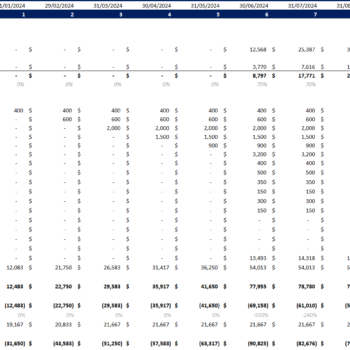
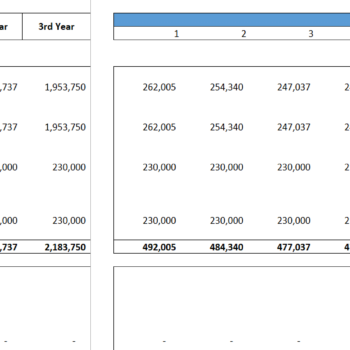
- Financial Statements (Income Statement, Balance Sheet, Cash Flow): Track profitability, financial position, and cash flow statements with detailed monthly and yearly views.
- Break-Even Analysis: Determine the variable costs and sales volume needed to achieve profitability.
- Company Valuation: Estimate your business’s worth using industry-standard methods.
- Sensitivity Analysis: Understand the impact of changing assumptions and market trends on your projections.
- Financial Ratios: Analyze financial metrics to assess performance.
- CAC & CLV Analysis: Optimize customer service and retention strategies.
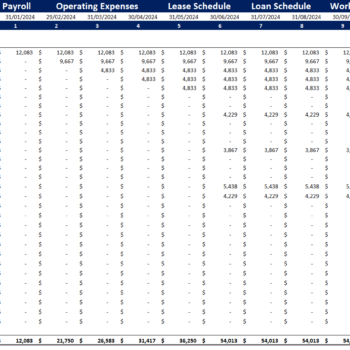
- Working Sheet: Access detailed calculations for payroll, cost of services, ongoing operating expenses, leases, loans, and working capital.
- Dashboard: Visualize key metrics and performance indicators with dynamic charts and graphs, showing progress over time and steady growth.
Who is this for?
- Fintech SaaS Startup Founders & CEOs: Gain financial control, deep understanding, and strategic insights for early-stage technology startups.
- Finance Managers & Analysts: Streamline financial modeling and reporting processes, making informed decisions based on financial analysis.
- Investors & VCs: Evaluate investment opportunities with confidence and precision, having access to accurate financial forecasts.
- Potential Customers: Looking for a comprehensive forecasting tool in the fintech industry.
- Startup founder: Looking to improve their marketing strategy and business strategies.
Empower your financial technology company with the financial clarity and strategic insights you need to succeed. Our Fintech Financial Projection Template is your essential tool for building a sustainable and profitable business.
TERMS OF USE:
Oak Business Consultant and our range of products, including this financial model template, are not endorsed by or officially connected to any specific software or platform unless explicitly stated. Your purchase allows you a SINGLE LICENSE FOR PERSONAL OR BUSINESS USE, exclusive to your individual or company needs. Redistribution, resale, or sharing of the files and templates is strictly prohibited. If you find our financial model valuable and wish to recommend it, please direct others to our shop.
NOTE:
Our product is a digital Excel file. Due to the nature of digital products, we cannot offer returns or exchanges. We encourage you to address any queries or seek clarifications before finalizing your purchase.
Walkthrough Video For The Fintect Excel Financial Model Template


Mila Thornton –
The level of detail in this financial model is amazing. It’s helped us analyze different revenue streams and test various scenarios for growth.
Ethan Kingsley –
This model simplified our budgeting process and provided a clear picture of customer lifetime value and acquisition costs.
Sanderson Mill –
The Fintech Excel Financial Model allowed us to clearly present our financial strategy to investors. It’s comprehensive, professional, and easy to use.
Sophie Lington –
As a founder, having accurate financial projections is crucial, and this model exceeded my expectations. The clarity and structure it offers are unparalleled.
Liam Prescott –
This model was a lifesaver! It’s user-friendly and provides detailed insights into cash flow, profitability, and customer acquisition costs.
Emma Brad –
The Fintech Excel Financial Model is an excellent tool for projecting financials in the fintech industry. The built-in KPIs and forecasting capabilities helped us prepare for investor meetings with confidence. Highly recommended
Marin Davis –
It exceeded my expectations. As someone who is new to the market, I found the template to be incredibly user-friendly and easy to navigate.