


Website Designing Financial Model


Original price was: $300.$100Current price is: $100.
The Website Designing Financial Model provides you a dynamic dashboard and useful financial performance tools that are handy and provide a clear depiction of your company’s financial health. Also, this model has a 5-year financial projection plan to ensure steady growth and profitability. It can also estimate ongoing operating expenses, monthly sales revenue, startup investment requirements, and inventory.
Moreover, this Financial model helps your businesses to mitigate financial risks by following up the fact that if you do this, then this would happen. With this model, you can know the impact of marketing campaigns, and the cost of entering a market, price variations on the business, and much more. By smart use of tables, graphs, and financial, Pro-forma can make your Financial Plan clear and easy to follow by comprehending every detail of your business operations.
Frequently Bought Together
- Description
- Reviews (1)
Description
Strategic Financial Modeling Framework for your Web Designing Business
The Website Designing Excel Financial Model prepared by Oak Business Consultants includes a complete financial framework to make solid financial plans and projections. This financial Model consists of all relevant financial statements and performance metrics, which enable the user to make sound decisions by considering all operational and financial risk factors.
The Website Designing Excel Financial Model is highly adaptable and dynamic for forming a 5-years monthly and yearly 3 projections (Income Statement, Balance Sheet, and Cashflow Statement) financial projection for a startup or existing agency. This model also consolidates a discounted cash flow valuation calculation by using the projected Free Cash Flows. The Website Designing Financial Model also calculates the main relevant financial performance ratios and KPIs required by banks and investors to estimate business profitability and liquidity.
One can easily edit our Website Design financial model with basic knowledge of excel and finance by adding information itself. All metrics will be updated automatically after made adjustments in the input sheet. Here you will find all the necessary financial and valuation reports, including Cash flow, break-even, Startup Cost plan, Balance sheet, and income statement. A high-quality financial model for an event agency makes it possible to foresee a profit for the future to come and enables the user to make wise decisions.
Key Inputs of Website Designing Excel Financial Model
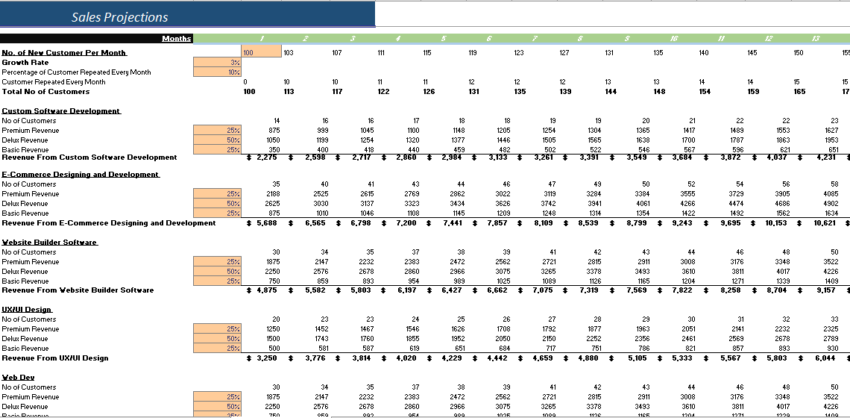
- The growth rate of Customers, at what percentage of your customers are purchasing your services.
- Percentage of Converted Repeat Customers – At what percentage of new total customers come to your website repeatedly.
- Average Payable and Receivable days your business is following.
- Cost of Good Services.
- Average Price of different categories of services.
- Percentage of each product category purchased by customers related to the total customers.
- The number of hours the average customer takes while taking brainstorming consultation.
- Tax Rate
Key Features of Website Designing Excel Financial Model
The following are the key features of this excel financial model template:
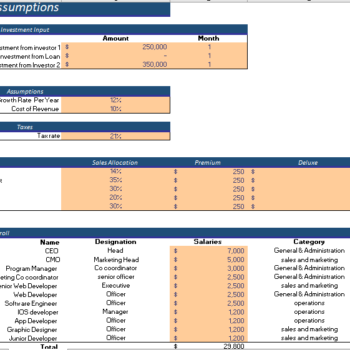
Input Sheet

This financial model template contains inputs that, when changed, impact the calculations and, therefore, the changes are applied to all relevant sheets. This financial model always has built-in flexibility to display different outcomes or final calculations based on this sheet’s changes.
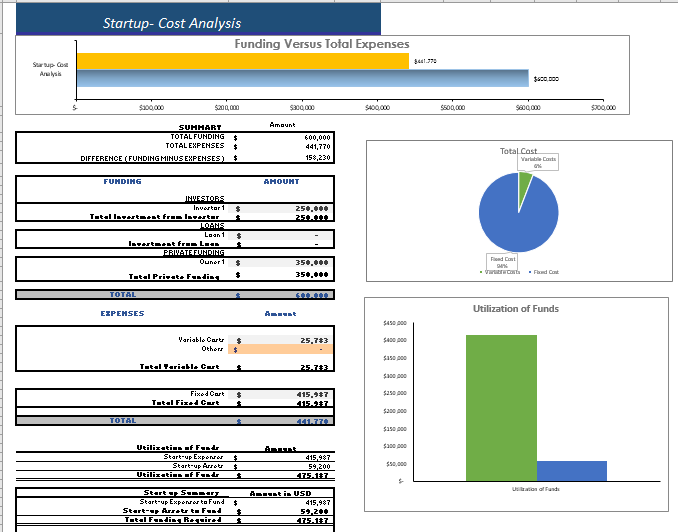
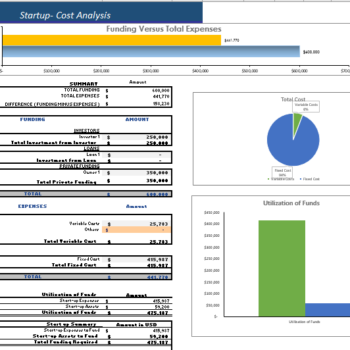
Startup Summary

This sheet provides you and your investors with an analysis of all the investment requirements of a new start-up. It helps the business present a snapshot of the company to prospective investors and raise capital.
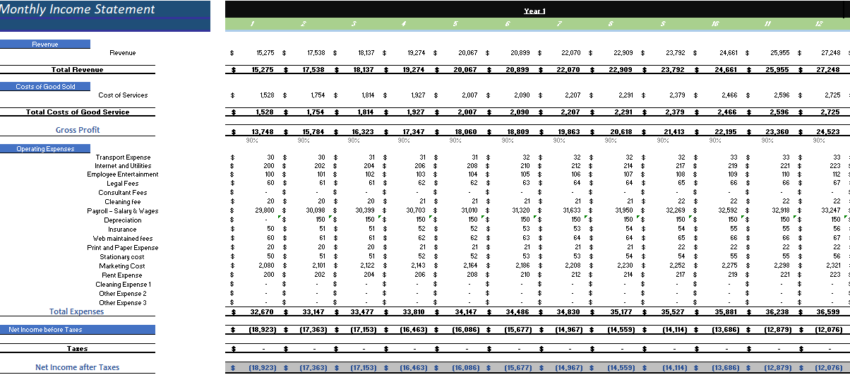
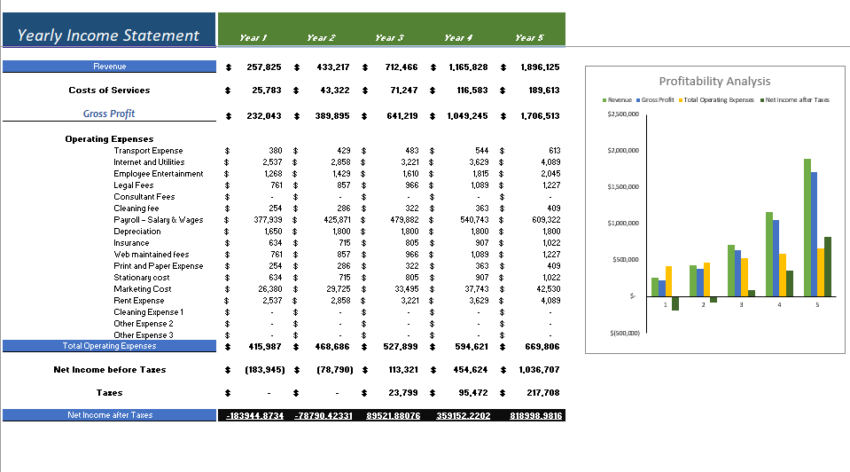
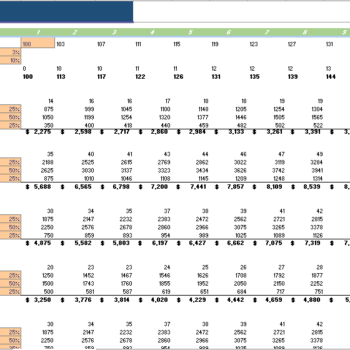
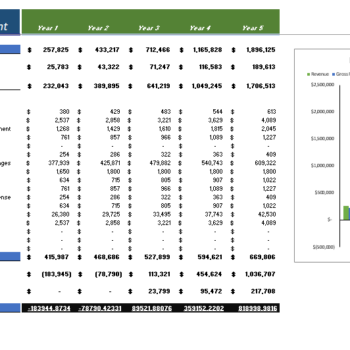
Monthly & Yearly Income Statement


The monthly Income Statement sheet of the Website Designing Excel Financial Model is perfect for those who require regular reporting and details. Additionally, Income Statement contains all revenue streamlines with gross earnings, and net earnings linked with a revenue analysis sheet to ensure accurate reporting. Oak Business Consultants understands every Website Designing business’s goal. Therefore, we have developed a mechanism that helps business owners determine whether they are making profits or otherwise.
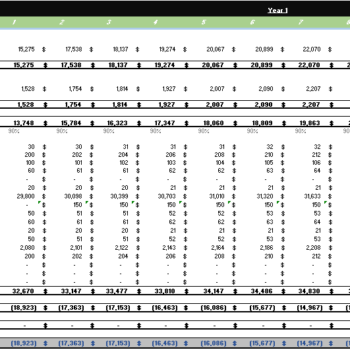
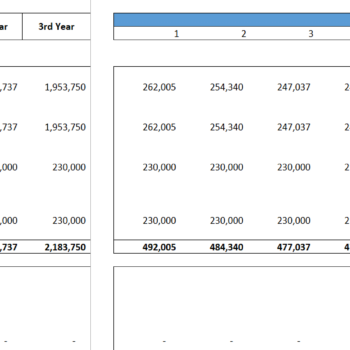
Furthermore, the Yearly Income Statement gives you complete insights into revenue and general & administrative expenses. The Yearly Income Statement also contains several graphs, assumptions, ratios, margins, net profit, earnings, cost of services, and profit after tax.
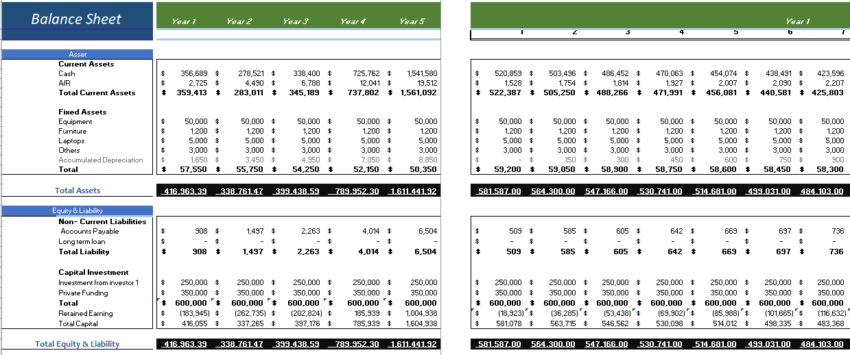
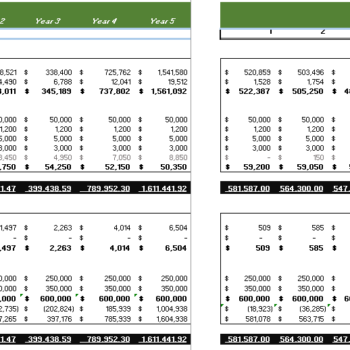
Balance Sheet

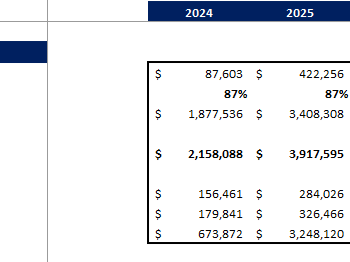
This balance sheet enables you to analyze your position of current assets, fixed assets, liabilities, and equity. This also allows you to monitor your accounts receivable, accounts payable, accrued expenses, etc. Therefore this specific, financial model gives you the perfect space to analyze your key financial balance accounts.
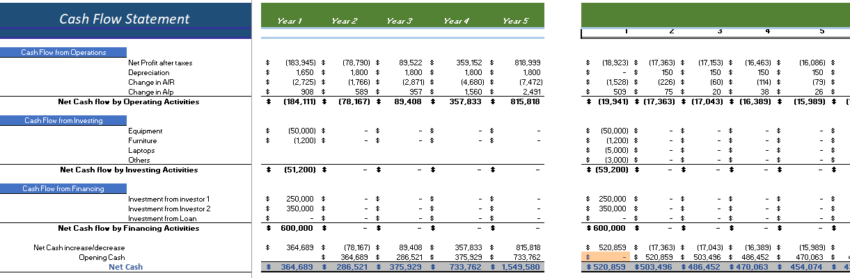
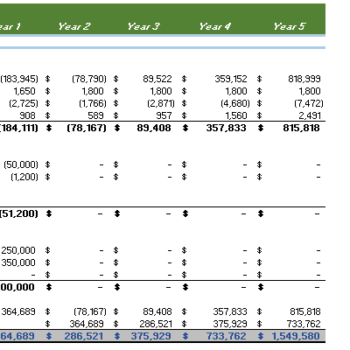
CashFlow

The Cash Flow statement is one of the most important financial statements because each business’s main goal is to generate cash flow. This shows how much business has consolidated money and how much is not enough to attract additional financing. This sheet also contains a dedicated sheet to monitor and analyze your company cash-ins and out. This cash flow statement is based on several key inputs, such as Payable and Receivable Days, yearly income, working capital, long-term debt, net cash, etc. This calculation then computes your net cash flow, and beginning and end cash balances. This is a perfect template for your company’s cash flow management.
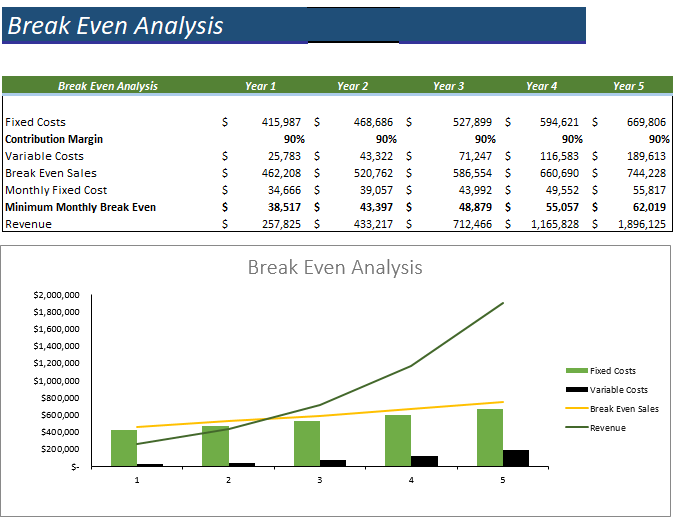
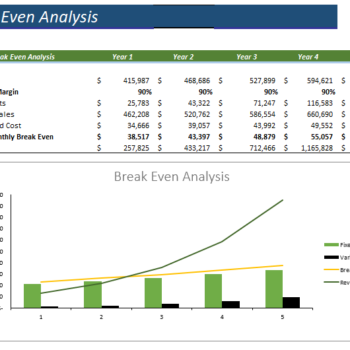
Break-Even Analysis

The break-even analysis will help you know at a glance, the profits generated at the various sales levels. The Break-Even Analysis refers to the point where your total sales contribution refers to fixed cost at zero profit and loss. This Technique is primarily based on marginal costing, which behaves differently at various levels of output activity.
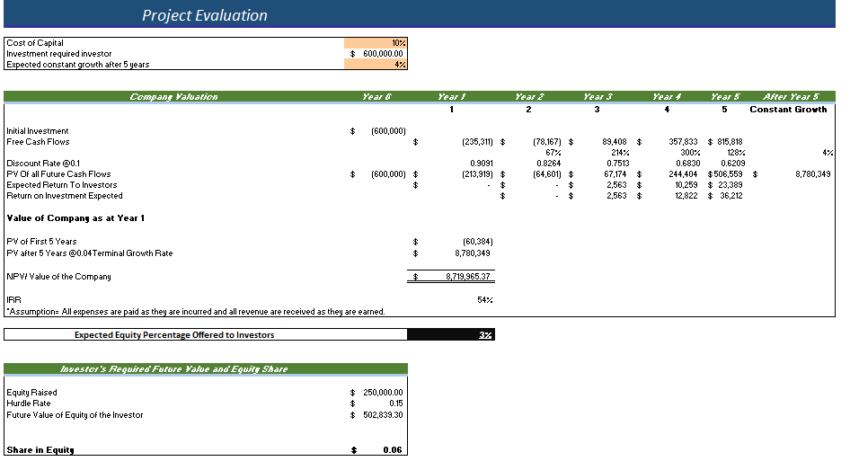
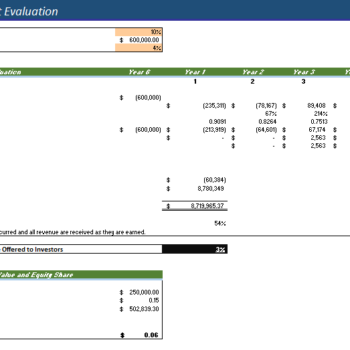
Project Evaluation

Since the table calculates Return on Investment, Investor’s Future Equity Share, and Cash Burn Rate Analysis, analyzing the company’s performance becomes easy to capture potential investors.
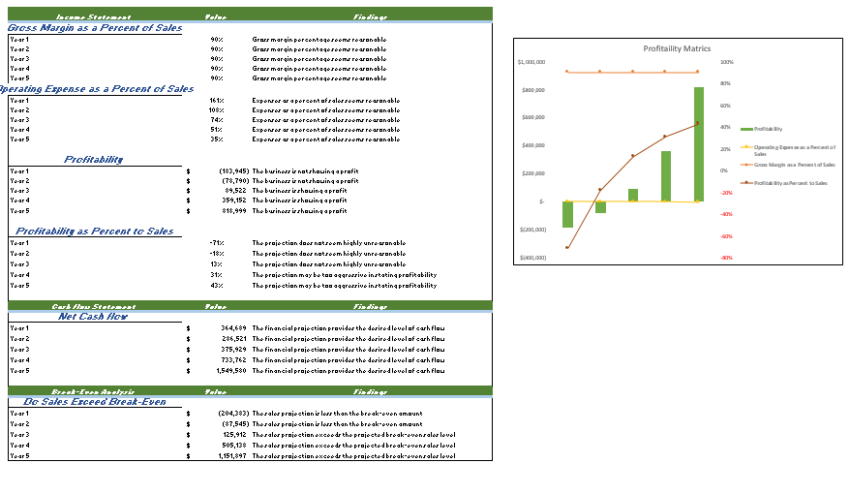
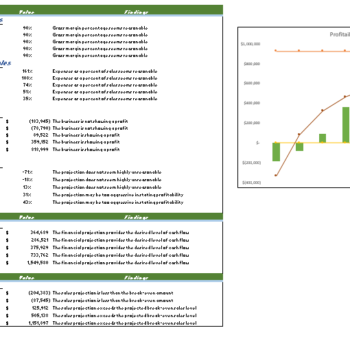
Diagnostic Sheet

This Diagnostic sheet automatically calculates the data such as the Profitability ratio, Net operating expense ratio to expense, etc., that will provide financial commentary about the company’s financials.
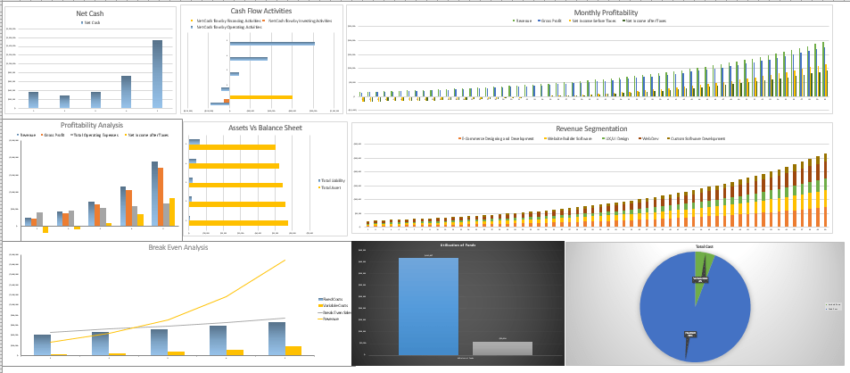
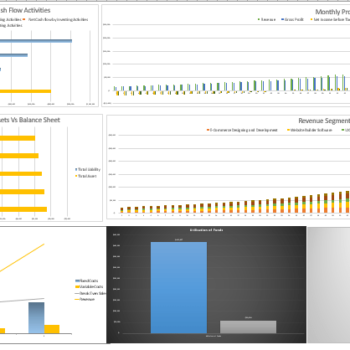
Dashboard

Users and readers respond and process visual graphs better than data. Furthermore, This dashboard provides you a graphical management tool that enables you to track all your relevant financial KPIs, improve cash flow management, and track expenses, sales, and net revenue in detail to meet and outperform the financial objectives of your business.
Benefits of Website Designing Excel Financial Model
- Encapsulate Company Performance- The Website Designing Financial Model analysis simplifies a company’s financial statements. It allows the user to express critical profitability and financial position information in just a few numbers. For example, the net profit margin of the Company encapsulates the net effect of a company’s revenues and all expenses. It will enable the user to conclude a company’s profitability without going through lengthy accounts statements.
- Bottom Line – An Website Design financial model can be the key to a better and informed future for your Company. Succeeding to plan your Company’s finances well will mean overall success in making wise investment decisions, purchasing the right operating assets, controlling costs, and determining company valuation.
- Accommodates Investors- This model provides valuation and performance analysis charts from projections. It enables the investors and banks to clearly determine the company’s actual worth considering lending funds to your company.
- Based on Financial Principles – After doing in-depth research on a Website Designing business model, this financial model has been created with logically correct financial and economic principles and assumptions.
Properly Integrated – The model assumptions and calculations are structurally integrated. So the change in the main sheet will automatically lead to the change in all related sheets easily. - Visualization Tool- This Financial model also prepares a clear communication of the quantitative outcomes. As obtained by calculations via various graphs and charts. Therefore, the user does not need to pay much attention to the inner workings of the financial model.


Frank –
I love it! Exceptional website design model coupled with a strong financial model that can drive success and growth for any business.