Debt or Equity? A Fintech Startup Financial Model Case Study
Client overview
Before a fintech startup raises its first round, it has to decide how to pay for growth. A company that offers both payments and loans faces a twist. It needs money for two different things. One is the burn: salaries, technology and marketing. The other is the loan book, because every dollar lent leaves the company before it returns with interest. Each need suits a different kind of capital.
This client was an early-stage fintech offering peer payments and personal loans. It planned to use AI and blockchain technology to modernize digital finance. It had no structured model, no payroll plan and no CAC or CLTV figures. It also could not say whether to raise equity or take on debt.
Oak built a dynamic financial model with full financial statements, scenario analysis and planning tools. Building a fintech for an underserved market instead? See how Oak modeled a mobile banking startup for Africa’s unbanked.
Why payments and lending need a funding model of their own
The funding question looks simple until the two product lines are modeled separately.
Two businesses in one model
Payments earn a small fee on each transaction and use little capital. Lending earns interest, but it ties up capital in the loan book and carries credit losses. A single blended growth rate hides which line pays for the other.
The loan book grows before it pays
A loan disbursed today returns principal and interest over many months. Faster lending growth therefore raises the cash need before it raises cash. A profitable lender can still run short of money while it grows.
Capital has a price, and the price depends on the use
Equity costs ownership. Debt costs interest and flexibility. Private loans and credit facilities cost more or less depending on their terms. The right mix depends on what the money will fund.
Challenges faced by the fintech startup
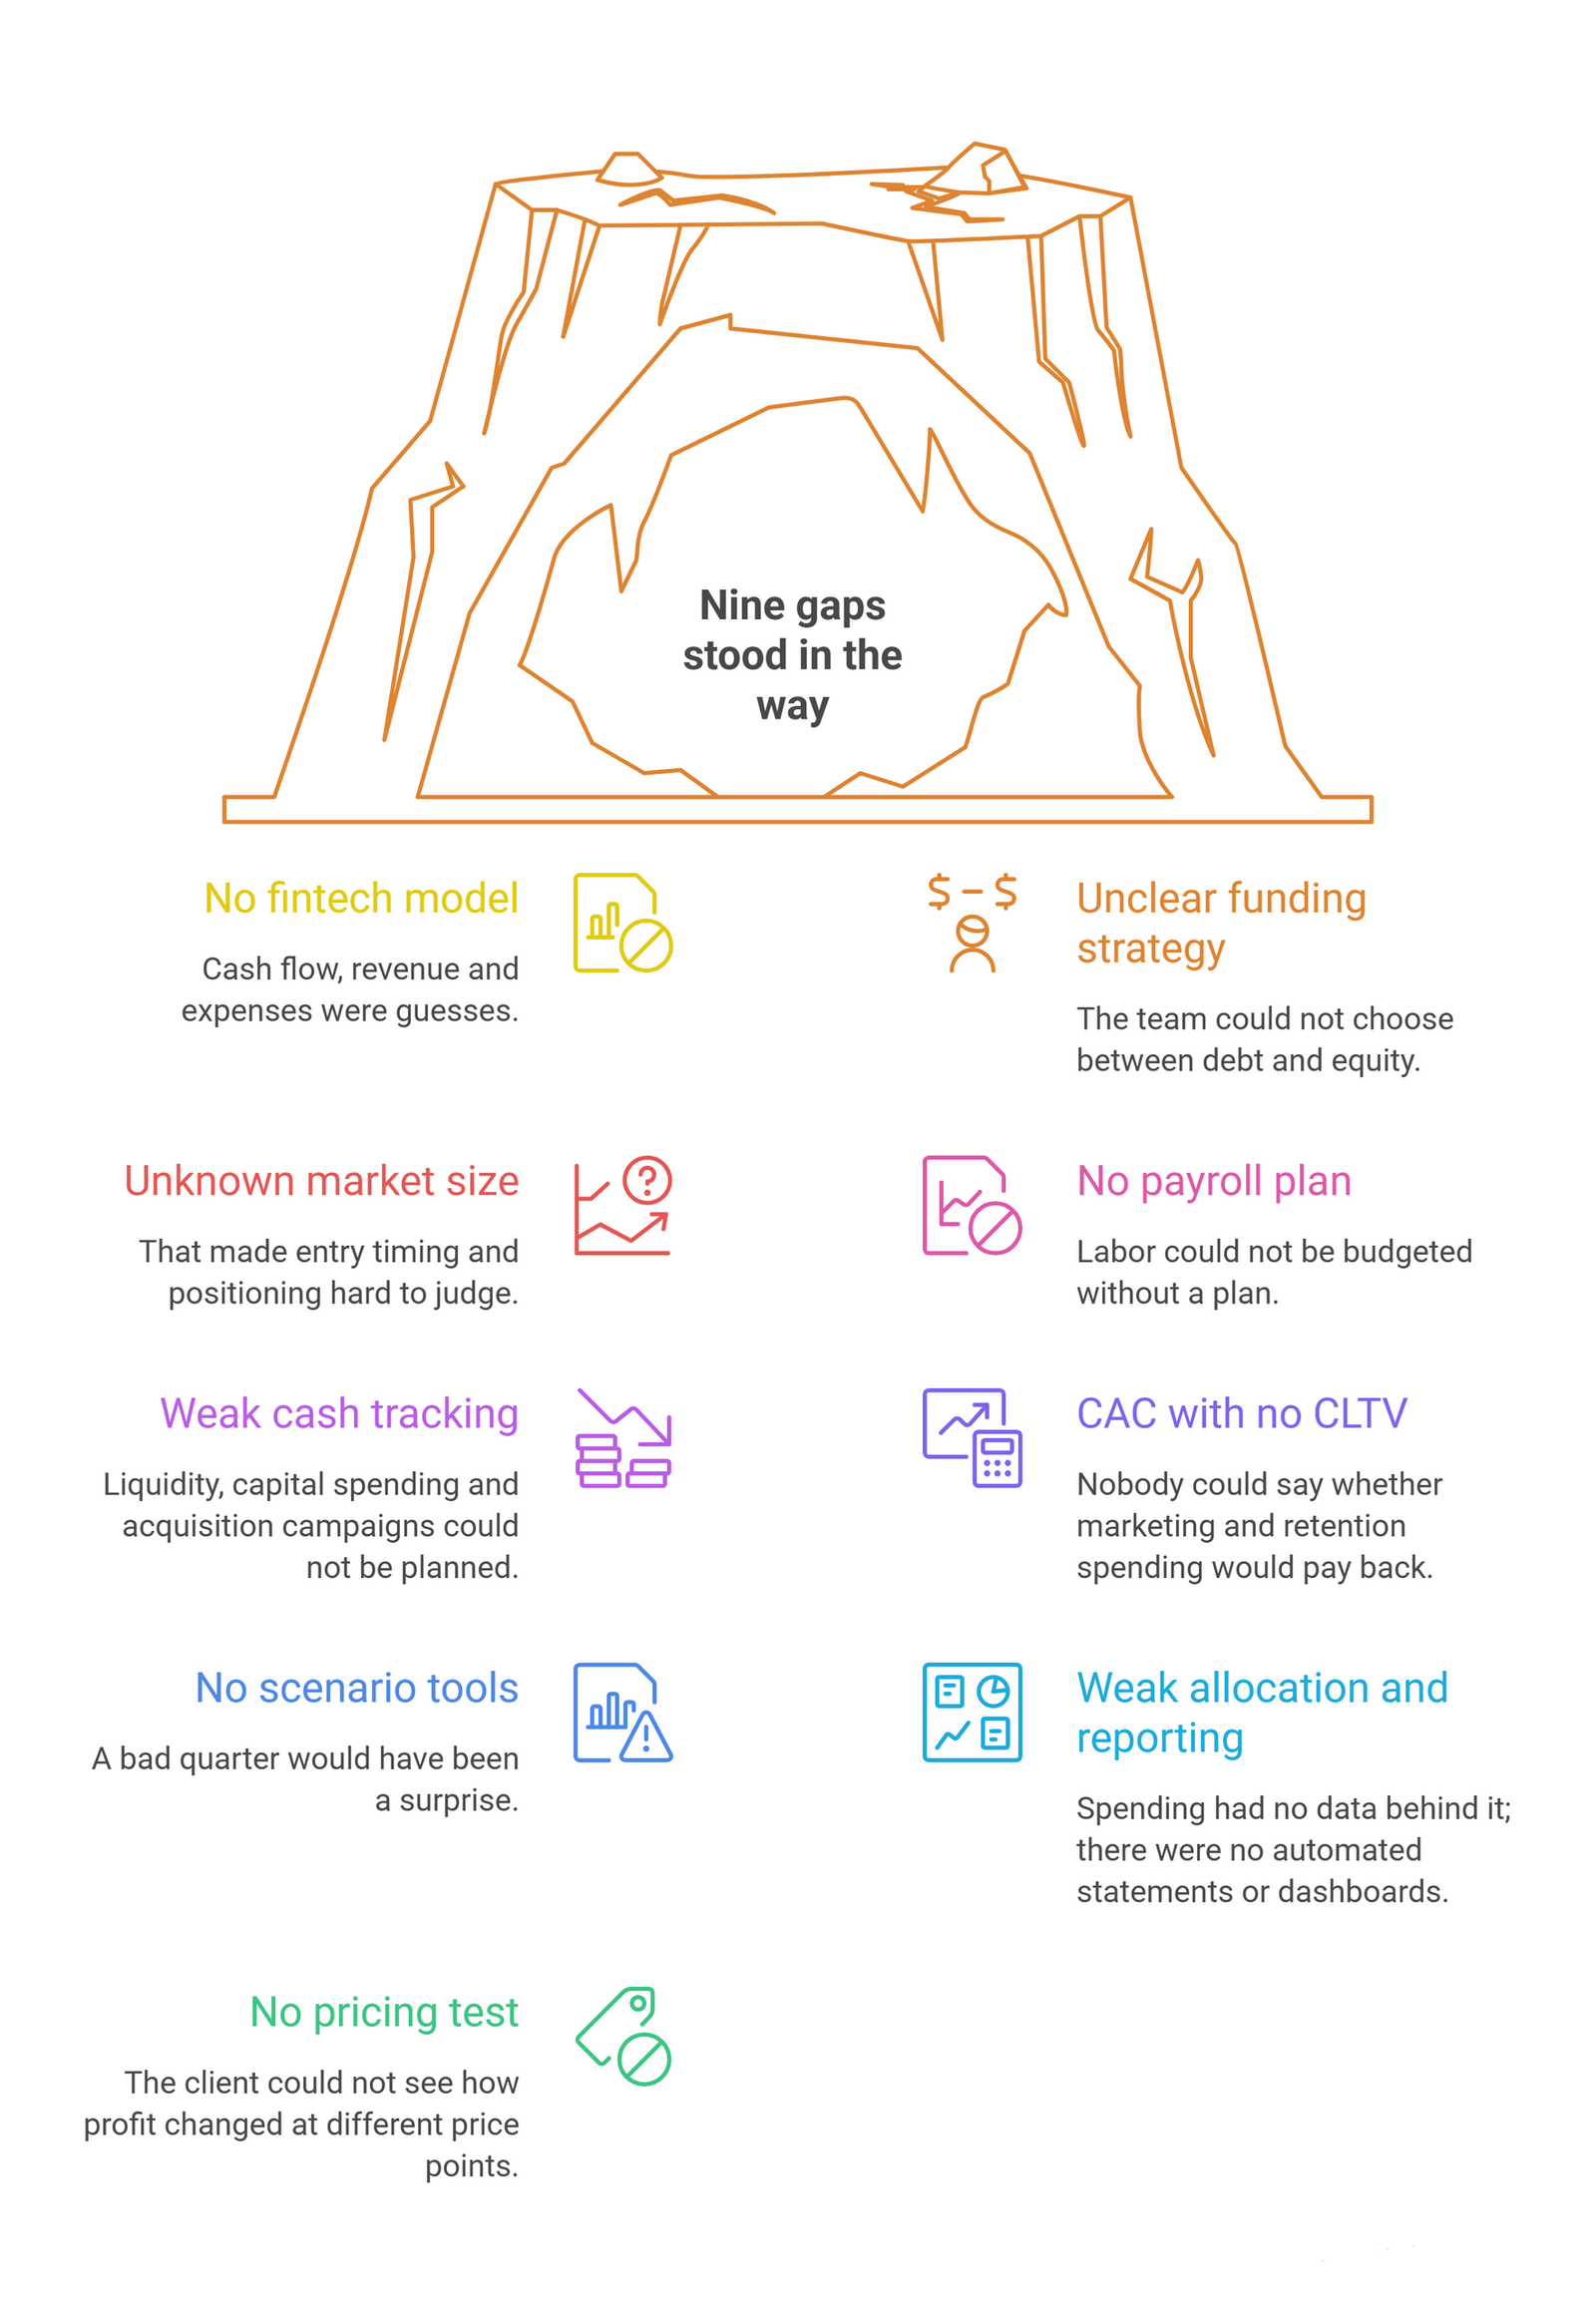
The client had a product idea and a clear market, but not the numbers to run or fund it. Nine gaps stood in the way.
1. No model built for fintech
Cash flow, revenue and expenses were guesses. Plans for digital lending and peer payments could not be tested.
2. An unclear funding strategy
The team could not choose between debt and equity. Venture capital, private equity, bank loans, crowdfunding and angel investors were all possible, each on different terms.
3. Unknown market size
The client could not size its total addressable market (TAM) or its serviceable obtainable market (SOM). That made entry timing and positioning hard to judge in a crowded field.
4. No payroll or hiring plan
Salaries, benefits and headcount were undecided. Labor is a significant cost for a young fintech, and it could not be budgeted without a plan.
5. Weak cash flow tracking
Nothing tracked cash coming in and going out. Liquidity, capital spending and acquisition campaigns could not be planned.
6. CAC with no CLTV
The client did not know what a customer cost to win or what a customer was worth over time. Nobody could say whether marketing and retention spending would pay back.
7. No scenario tools
Nothing simulated market swings, regulatory changes or shifts in revenue. A bad quarter would have been a surprise.
8. Weak capital allocation and reporting
Spending across product, compliance, technology and support had no data behind it. There were also no automated statements or dashboards to show investors.
9. No pricing test
Without sensitivity analysis, the client could not see how profit changed at different price points.
How the financial model was built
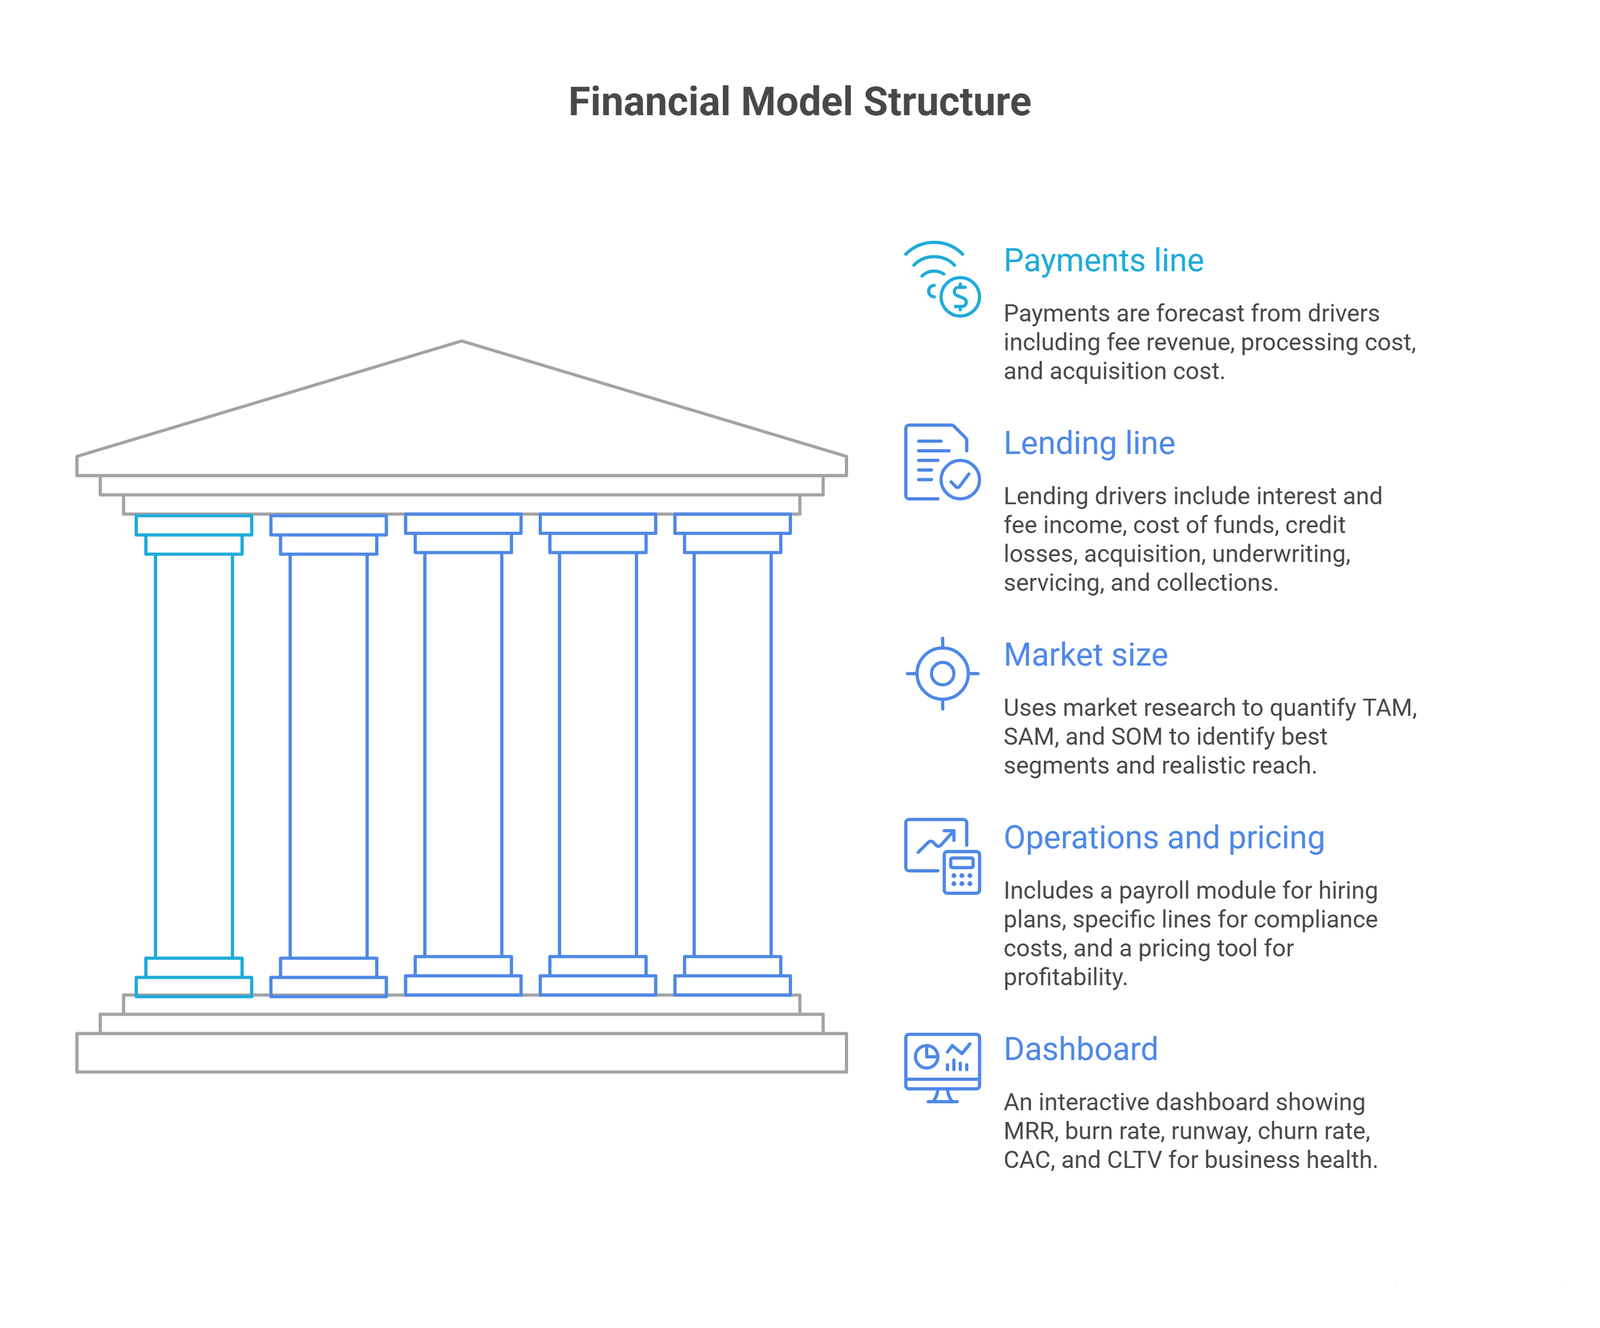
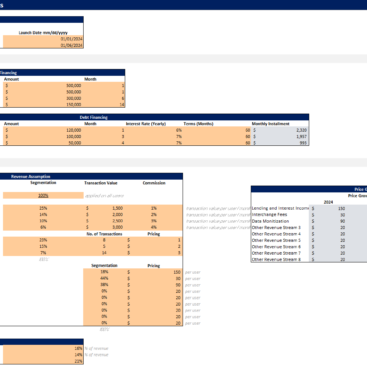
Oak designed the model around the decisions the founders faced. Inputs sit apart from calculations, so the finance team can update assumptions without breaking the logic. The model projects revenue, operating expenses, capital spending and cash flow, monthly and annually, over three years. The profit and loss statement, balance sheet and cash flow statement update automatically.
The payments line
Payments are forecast from drivers.
| Line | Drivers |
| Fee revenue | Active users x transactions per user x average value x fee rate |
| Processing cost | Transaction volume x processing rate |
| Acquisition cost | New users x CAC, measured on active users |
The lending line
Lending has more moving parts, so it gets its own set of drivers.
| Line | Drivers |
| Interest and fee income | Average loan balance x pricing, plus origination fees |
| Cost of funds | Average loan balance x funding rate |
| Credit losses | Loans disbursed x default rate x (1 – recovery rate) |
| Acquisition and underwriting | New borrowers x acquisition cost, plus data cost per loan |
| Servicing and collections | Active loans x servicing cost |
Market size and segments
The model uses market research to quantify TAM, serviceable available market (SAM) and SOM. That points the startup at its best segments and shows how much of the market it can realistically reach.
Payroll, compliance and pricing
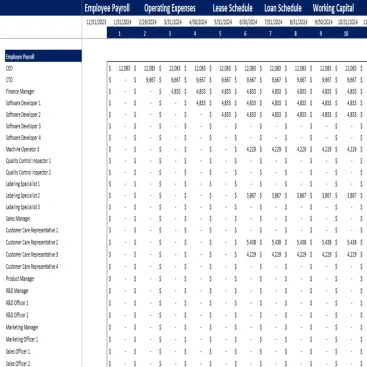
A payroll module simulates hiring plans, salary levels and benefit costs by month. Licensing fees, legal expenses and audit costs sit on their own lines from the start. A pricing tool tests different price levels against profitability. Oak also offers a standalone sensitivity analysis model for teams that want the same method in a smaller format.
Dashboard
An interactive dashboard shows monthly recurring revenue (MRR), burn rate, runway, churn rate, CAC and CLTV. Founders and investors can read the health of the business at a glance.
How funding cost and defaults drive the choice
Each loan earns a contribution that depends on five lines.
Contribution per loan = interest and fees – cost of funds – expected credit loss – acquisition and underwriting cost – servicing cost
Expected credit loss is the default rate multiplied by the amount lost after recoveries. In consumer lending, the spread between what a loan earns and what it costs is often thin. A small rise in defaults or in funding cost can remove most of the profit on a loan, and two moving together can turn it negative. So the funding decision cannot be separated from the credit assumptions.
First loans also tend to earn less than repeat loans. New borrowers often cost more to win and default more often, and profit comes from the borrowers who return. That is why the model tracks customers in cohorts, and why Oak’s fintech financial model with cohort analysis is built around retention.
Funding scenarios: debt or equity
The model compares each funding route on the same operating assumptions. Only the capital changes.
| Funding route | What the model measured | Where it can break |
| Equity investment | Ownership after each round, runway added | Dilution grows if growth targets slip and a later round is smaller |
| Bank debt | Repayment schedule, interest cover, cash after repayments | Repayments fall due in months when revenue is weakest |
| Private loans or credit facilities | Cost, advance rate against the loan book, covenants | Funding cost rises above what loans earn after losses |
On top of this, best-case, base-case and worst-case scenarios vary customer acquisition costs, regulatory changes and technology shifts. Founders can then apply three tests to every route:
- Does the downside case still cover the repayments?
- What is the lowest cash balance, and in which month?
- How much ownership is left after the next round?
A common pattern is to fund the burn with equity, because it carries no repayments. Debt then comes in against the loan book once cohort data proves the loss rate. The model lets founders test that pattern against their own numbers instead of assuming it.
Modeling AI and blockchain claims
This client planned to use AI and blockchain technology. Founders in that position should model those plans as assumptions, not as facts.
AI underwriting is a bet on a lower default rate, and it adds data and engineering cost. Blockchain settlement is a bet on lower processing cost or faster settlement, and it adds compliance cost. Oak’s scenario setup treats technology shifts as a variable, so a founder can show investors what happens if the technology delivers less than planned. Investors discount efficiency claims they cannot test.
Outcome
The client gained clear cash flow visibility and revenue forecasts across several streams. With CAC set against CLTV, the team could judge its acquisition spending and allocate resources with data.
The model also changed the funding conversation. Instead of arguing from instinct, the founders could compare dilution, repayment pressure and sustainability for each route. That strengthened the fundraising strategy and gave investors a clearer view of the business.
What investors will ask a payments and lending fintech
Investors tend to test a fintech model with a predictable set of questions. Build the answers before the first meeting:
- How does each revenue stream make money, and what drives it?
- What does it cost to win a customer, and how long do they stay?
- How do losses develop by cohort, and how does recovery work?
- What does the money cost, and what happens to margin if that cost rises?
- How long does the cash last, and what happens in a bad quarter?
- Which regulatory costs are already in the numbers?
A model that answers these before anyone asks them shortens the conversation. If you are preparing a round, Oak’s startup fundraising consultants can help. An investor-ready pitch deck then turns the model into a story investors can follow.
Frequently Asked Questions
Should a fintech startup raise debt or equity first?
It depends on how predictable the cash flow is and what the money funds. Equity has no repayments, so it suits uncertain revenue and operating burn, but it dilutes ownership. Debt suits steady cash flow and works best against a loan book with proven loss rates. Model both and compare dilution, cash impact and sustainability.
Why model payments and lending separately?
They have different economics. Payments are low-capital and fee-driven. Lending ties up capital and carries credit losses and funding costs. Separate models show which line is profitable and how much capital each one needs.
What default and recovery assumptions should a lending fintech use?
Use conservative figures, and base them on your own data once you have any. Rates differ widely by product, security and borrower type, so a generic benchmark is only a starting point. Always run a scenario with a higher default rate and a lower recovery rate.
How do you estimate TAM, SAM and SOM?
TAM is the total demand for the product. SAM is the part your product and region can reach. SOM is the share you can realistically win in the near term. Use market research to size each one, and test the penetration assumptions behind SOM.
What does pricing sensitivity analysis show?
It tests price levels against volume and margin. The result shows where a higher price starts costing more in lost customers than it earns, which matters for both fees and loan pricing.
Which regulatory costs belong in a fintech model?
Licensing fees, legal expenses and audit costs, each as a separate line. Separate lines make it easy to run a scenario where those costs rise or a license takes longer to arrive.
Conclusion
A fintech model earns its keep when it settles a decision. For this client, the decision was how to fund growth, and the model turned a debate into a comparison. The numbers will move as the company learns, which is why inputs sit apart from calculations and the model can be updated each month.
Build a fintech model that settles your funding question
Oak builds dynamic financial models for fintech founders, from revenue drivers to funding scenarios. Book a free consultation to talk through your assumptions, or explore Oak’s financial modeling services.