Healthcare Financial Model: Plan for the Payer Cash Lag
Introduction: Why Healthcare Needs Specialized Financial Models
A clinic delivers care today and gets paid weeks later. For a new practice the wait can be longer, because payer enrollment must finish before in-network claims pay. A model that books revenue on the day of the visit shows a profit while the bank balance falls.
Hospitals show how thin the cushion can be. Operating margins at many hospitals have sat in the low single digits for years. Outpatient practices have more room, but every provider follows the same path from charge to cash.
This guide covers ten healthcare sub-sectors and the one driver that shapes each model. Founders, clinic owners and investors can use it to test assumptions before committing capital.
From charge to cash: four steps a healthcare model must separate
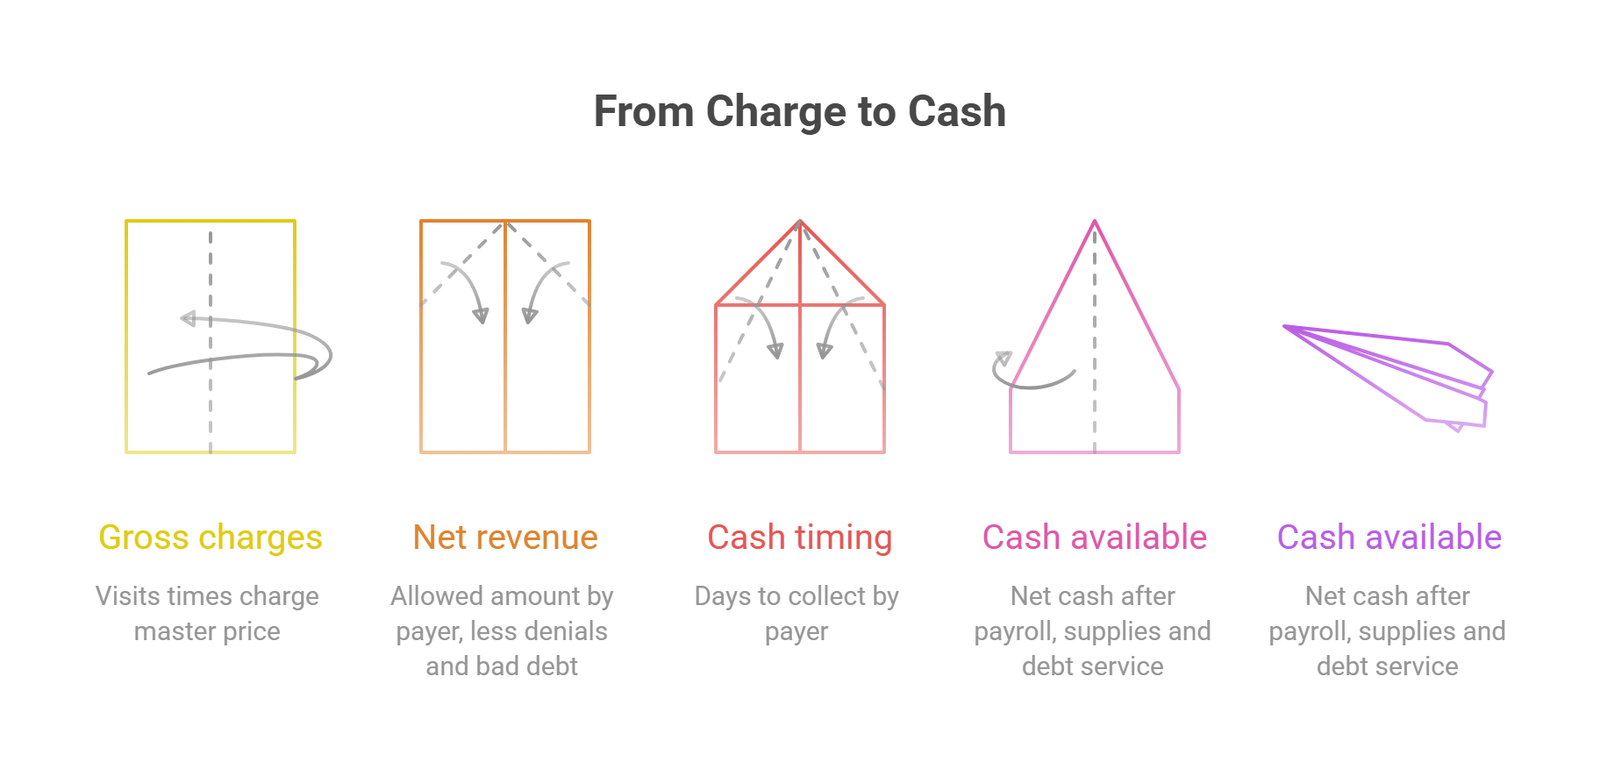
Generic templates treat price times volume as revenue. Healthcare needs four separate steps.
| Step | What the model needs | Where errors hide |
| Gross charges | Visits times charge master price | Treating charges as revenue |
| Net revenue | Allowed amount by payer, less denials and bad debt | One blended rate for every payer |
| Cash timing | Days to collect by payer | Assuming payment in the month of service |
| Cash available | Net cash after payroll, supplies and debt service | Ignoring the enrollment gap |
Three metrics control how fast and how fully a charge turns into cash: net collection rate, denial rate and days in accounts receivable. Initial denial rates often run near 10% or higher, while the best performers target under 5%. Model denials by payer, not as one flat rate. Oak’s healthcare financial metrics guide gives the formulas and benchmark ranges for all three.
Payer mix and the enrollment gap
Payer mix is the share of revenue from commercial insurance, Medicare, Medicaid and self-pay patients. The same visit pays a different amount under each. Build net revenue per visit for each payer, then weight it by the expected mix.
New practices face a second problem. Payer enrollment and credentialing can take months. Until it finishes, in-network visits may be delayed, reduced or paid late. Set the first month of in-network revenue from the payer’s actual timeline, not from the opening date.
Cash-pay services avoid this gap. Cosmetic dermatology, longevity programs and some behavioral health pay at the time of service. Model them as a separate line, because they shorten the cash trough.
A worked example: what a two-month enrollment delay costs
The figures below are illustrative, not client data. A new practice expects $80,000 of net insured revenue a month at maturity. It also earns $10,000 a month in cash-pay services from day one. Fixed costs run $60,000 a month, variable costs take 15% of revenue, and insurers pay one month after service.
After enrollment finishes, insured revenue ramps to 30%, 50%, 70%, 85% and then 100% of maturity over five months.
| Scenario | In-network revenue starts | Lowest cumulative cash | Month of the low point |
| Payer quotes three months | Month 4 | about -$269,000 | Month 7 |
| Enrollment runs five months | Month 6 | about -$372,000 | Month 9 |
Two extra months of delay add about $103,000 to the funding need. Each idle month costs roughly $51,500, because fixed costs keep running while insured revenue stays at zero.
Even at maturity, the practice nets only about $16,500 a month in this example. Recovering a $269,000 hole takes well over a year. A plan that books revenue from the opening date would show none of this. It would size the loan or equity raise far too small.
How much cash to raise
The lowest cumulative cash balance sets the minimum raise. Size it in three steps:
- Build the monthly forecast from the first day rent and payroll start, not the first day of visits.
- Find the lowest cumulative cash balance in the base case.
- Test a payer delay one or two months longer than the quote, then add a buffer.
In the example above, the three-month case needs about $269,000 and the five-month case needs about $372,000. A raise sized to the first number fails in the second.
Ten healthcare models at a glance
Each sub-sector has one constraint that matters more than the rest.
| Sub-sector | Capacity limit | Main cash source |
| Ophthalmology practice | Exam lanes, surgical block time | Insurers, plus self-pay for elective care |
| Dermatology center | Provider hours | Insurers for medical care, patients for cosmetic care |
| Mental health center | Clinician sessions per week | Insurers and self-pay |
| Telemedicine platform | Provider time slots | Insurers, employers, subscribers |
| Clinical laboratory | Analyzer throughput | Insurers and client facilities |
| Medical devices | Sales cycle and production | Hospitals, distributors, consumers |
| Sterilization products | Contract volume | Institutional buyers |
| Pharmacy | Prescriptions filled per day | Pharmacy benefit plans, over-the-counter sales |
| Smart hospital | Beds and operating rooms | Insurers and government programs |
| Longevity clinic | Provider time and diagnostics | Members and self-pay clients |
Ophthalmology practice

Eye care combines routine visits with surgery. Routine exams fill exam lanes and bring steady visits at lower value. Surgery brings higher revenue per case but depends on surgical block time and facility arrangements. Model the two lines separately, with their own pricing and payer mix.
Imaging devices and lasers drive startup capital. Add service contracts and a replacement date for each major device. Start with market research on local demand, competing practices and insurance coverage before setting visit volumes. If the practice sells eyewear, give optical retail its own margin line. Oak’s healthcare financial models overview walks through this split for an ophthalmologist business.
Dermatology center

Dermatology earns from two different payers. Insurance pays for medical care such as acne, eczema and psoriasis. Patients pay directly for cosmetic treatments. The cosmetic line avoids the payer lag, so a stronger cosmetic mix improves early cash.
Capacity is provider hours. Nurse practitioners and physician assistants can extend it, but they add supervision and payroll costs. Injectables and consumables need inventory and expiry tracking. Founders weighing an independent clinic against a franchise should model both. Franchise fees compress margin in exchange for brand and referrals.
Mental health center

Excel Financial Model – Product Image
Revenue equals clinician sessions times the net rate per session. Rates differ by license type, so model psychiatrists, psychologists and therapists separately. Each clinician needs payer credentialing, which delays in-network revenue.
No-shows and late cancellations reduce paid sessions, so use a realistic attendance rate. Cap weekly sessions at a level clinicians can sustain. Telehealth lowers space cost and widens the catchment area. Treat the telehealth share of visits as an input, alongside any cash-pay portion.
Telemedicine platform

A telemedicine model has two engines: consultations and subscribers. Revenue per consultation depends on whether insurers, employers or patients pay. Provider pay per visit and platform costs make up most of the direct cost.
Licensing rules by state or country limit which providers can see which patients, so model the rollout market by market. Payer coverage for virtual care also differs by plan and location. Add patient acquisition cost from the first month and test several channel mixes.
Clinical laboratory

Excel Financial Model
Revenue equals tests performed times reimbursement per test. Reimbursement varies by test and payer, so model a test menu rather than one average price. Analyzers can be bought or placed under reagent rental agreements, which trade capital for a higher cost per test.
Add accreditation costs, such as CLIA certification in the United States, plus quality control and courier logistics. The time between specimen collection and billing delays cash, so model it explicitly. Referring clinics and hospitals can account for a large share of volume, so test the loss of your largest client.
Medical devices business

Device companies earn from equipment, consumables and service. Model them as separate lines, because each behaves differently.
| Revenue line | Behavior | Model driver |
| Capital equipment | Lumpy, long sales cycle | Pipeline and win rate |
| Consumables | Recurring | Installed base times usage |
| Service contracts | Recurring | Renewal rate |
Regulatory clearance delays first revenue, so place the approval date in the timeline and fund the months before it. Direct sales and distributor sales carry different margins and payment terms. Inventory and warranty reserves belong in working capital.
Sterilization products business

Hospitals, dental clinics and surgical centers must sterilize equipment, which keeps demand steady. Revenue comes from supply contracts, consumables, equipment and service. Model contract price tiers by volume, and the renewal rate on each contract.
Chemical and consumable costs move with supply markets, so run a sensitivity test on input prices. Add validation and compliance costs. Institutional buyers often pay slowly, so size working capital for stock and receivables.
Pharmacy: online and drug store

Pharmacy margins are thin. Reimbursement from pharmacy benefit plans can fall close to acquisition cost on some drugs. Model margin by drug category rather than one blended rate. Over-the-counter and wellness products earn more per sale and balance the mix.
Inventory is the largest use of cash. Model stock turns, carrying cost and the days plans take to pay. Online pharmacies add packaging, shipping and licensing in each market served. They also carry acquisition costs by channel. Oak’s online pharmacy financial model covers these inputs.
Smart hospital

Hospital capacity is beds times occupancy, and revenue per bed depends on case mix and length of stay. Model departments separately, such as cardiology, neurology, orthopedics and oncology.
Smart hospital technology adds capital for patient monitoring, digital workflow and AI-assisted diagnostics. Those systems need software fees and replacement dates. Clinical and technology staff both belong in the staffing plan. A hospital takes years to ramp. The model must show financing needs through that period and the point where efficiency gains lift operating margin.
Longevity clinic

Longevity clinics sell programs, memberships and diagnostics, mostly to self-pay clients. Prepaid packages create deferred revenue, which is a liability until the services are delivered. Recognize that revenue by month so cash and revenue are not confused.
Provider time and diagnostic testing set capacity and direct cost. Give patient acquisition its own line, since referrals and reputation take time to build. Marketing and testing rules differ by jurisdiction, so budget for compliance review. Most revenue is cash-pay, so the payer lag is small. Demand then depends on household spending.
What lenders and investors want to see
Lenders read a healthcare model for three things. The first is the lowest cumulative cash balance. The second is the debt service coverage ratio once volume stabilizes. The third is how the plan holds up when denials rise or visits ramp slowly.
Show monthly detail for the first 24 to 36 months, with the enrollment timeline stated as an assumption. Add a sensitivity table on visit volume, net revenue per visit and staffing cost. Then size the credit line or equity raise to cover the lowest cumulative balance plus a buffer.
Why the chart of accounts matters to the model
A model is only as reliable as the accounts behind it. A healthcare chart of accounts separates revenue by service line or payer and tracks clinical costs apart from administration. It also gives medical waste and compliance their own lines.
That structure lets the model calculate gross margin by procedure and reconcile to the books each month. Set it up before building projections, so forecast lines match what the bookkeeper will report.
Five mistakes that distort healthcare projections
- Using charge master prices as revenue. Collected revenue is always lower.
- Starting in-network visits before enrollment finishes.
- Applying one denial rate and one collection lag to every payer.
- Leaving out equipment replacement and service contracts.
- Sizing cash reserves to the average month instead of the lowest cumulative balance.
Frequently Asked Questions
Why does healthcare need its own financial model?
Insurance reimbursement, payer mix, denials, collection delays, and regulated equipment and staffing all change revenue and cash. A generic template misses these steps and shows profit too early.
How long should a healthcare model project?
Monthly for the first 24 to 36 months, then annually to year five. The early months carry the enrollment gap, the visit ramp and the cash trough, so they need monthly detail.
What operating margin should a healthcare business expect?
Hospitals run thin, often in the low single digits. Clinics and specialty practices vary too widely for one figure. Build the margin from your own payer mix, staffing and rent, then compare it with published benchmarks for your specialty.
How do I model a payer enrollment delay?
Set the first month of in-network revenue from the payer’s actual timeline. Until then, include only cash-pay and out-of-network revenue. Keep full costs from the opening date. Then test a delay one or two months longer than the payer quotes.
How should cash-pay services be modeled?
Separately from insured care. They avoid the collection lag, but they still need acquisition costs, pricing tests and a view on how demand changes when household budgets tighten.
What is the difference between a financial model and a business plan?
The model holds projections, statements and scenarios. The business plan adds market analysis, strategy and operations. Most lenders and investors expect both.
Build the model around the gap
The healthcare model that earns trust shows the lowest cash balance before it shows the profit. Lenders look for that number first. Founders who find it early can fix the staffing plan, the credit line or the opening date while those choices are still cheap.
Oak builds healthcare models with payer mix, collection timing and capacity limits built in. Start with Oak’s financial modeling service. Practices that want ongoing oversight after launch can add Oak’s medical practice CFO services.