SDG 10: Reduced Inequalities, and the 1 in 5 People Still Facing Discrimination
SDG 10: reduced inequalities, ten years in
Nearly one in five people worldwide report facing discrimination personally. That is the UN’s own 2026 finding, a decade after SDG 10 was adopted. Women, people with disabilities, and lower-income groups carry most of that burden.
Some numbers have moved the wrong way. The global labor income share is still below its 2015 level. That is the portion of GDP going to workers rather than capital. Refugee numbers have more than doubled since 2015.
Other numbers have improved. Bank capital and asset quality have strengthened for a decade straight. Remittance costs, while still above target, keep falling slowly.
This guide covers what SDG 10 actually commits the world to. It covers where the 2026 reporting shows progress standing, country by country. That ranges from nations with the most equal income distribution to nations with the widest gaps. It also covers what businesses can realistically do about it.
What is SDG 10
SDG 10 is formally titled “Reduce inequality within and among countries.” It is the tenth of the 17 Sustainable Development Goals. All 193 UN member states adopted it in 2015. That happened as part of the 2030 Agenda.
The goal splits into two halves. One half is about inequality inside a country, income, discrimination, and political voice. The other half is about inequality between countries, trade rules, aid flows, and migration.
A country can grow its economy and still leave inequality untouched, or even widen it. Income can rise for everyone while the bottom 40% falls further behind the top. SDG 10 treats both dimensions as one goal. That is part of why its 2026 progress report describes results as “mixed” rather than simply good or bad.
The official targets and indicators behind SDG 10
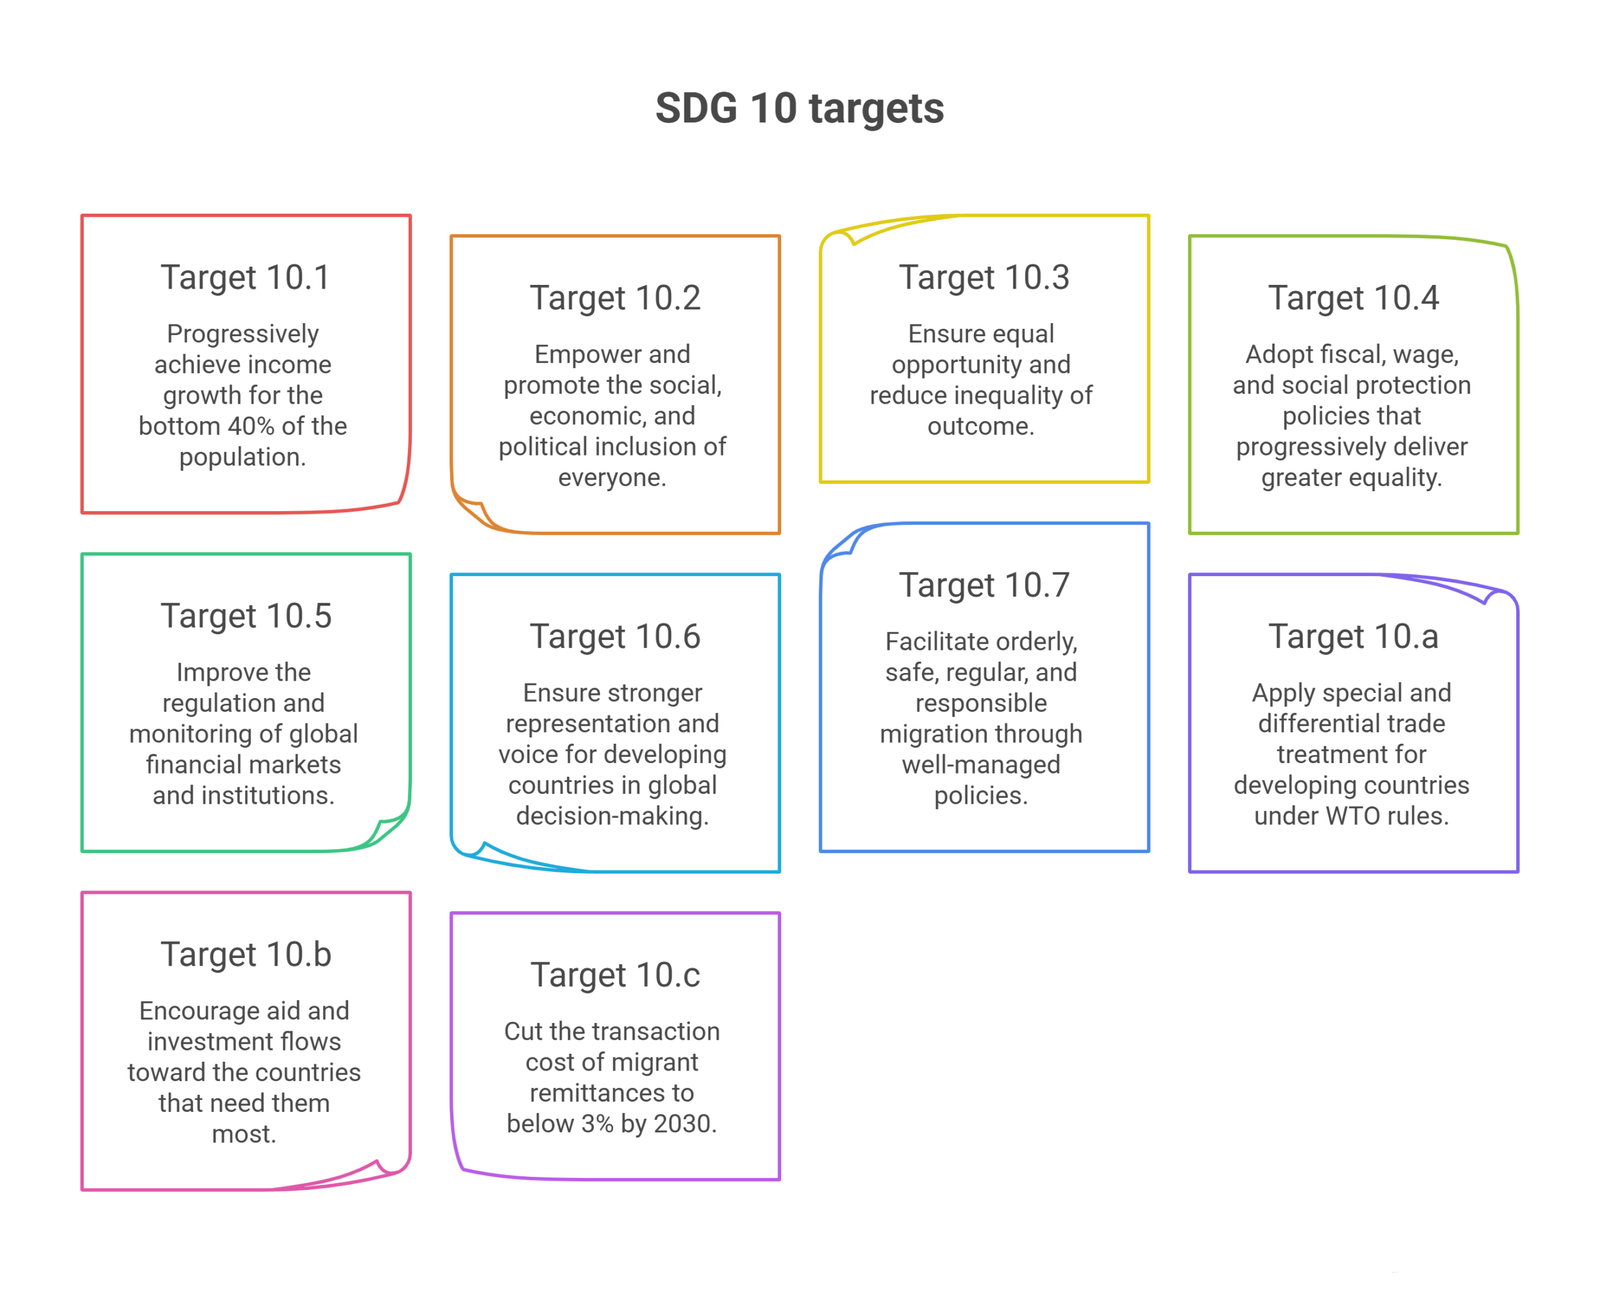
SDG 10 breaks down into 10 official targets. Seven are outcome targets, numbered 10.1 through 10.7. Three are means-of-implementation targets, numbered 10.a through 10.c.
Together they are tracked through 14 indicators, as set out on the UN’s SDG 10 page.
Target 10.1: Progressively achieve income growth for the bottom 40% of the population. That growth should beat the national average. Tracked through growth rates of household income or expenditure for that group versus the total population.
Target 10.2: Empower and promote the social, economic, and political inclusion of everyone. That includes people of every age, sex, disability, race, or status. Tracked through the share of people living below 50% of median income.
Target 10.3: Ensure equal opportunity and reduce inequality of outcome. This includes eliminating discriminatory laws and practices. Tracked through the share of the population reporting personal discrimination or harassment.
Target 10.4: Adopt fiscal, wage, and social protection policies that progressively deliver greater equality. Tracked through the labor share of GDP, and fiscal policy’s redistributive impact on the Gini index.
Target 10.5: Improve the regulation and monitoring of global financial markets and institutions. Tracked through Financial Soundness Indicators, covering bank capital, asset quality, and profitability.
Target 10.6: Ensure stronger representation and voice for developing countries in global decision-making. This covers economic and financial institutions. Tracked through the share of votes developing countries hold in international organizations.
Target 10.7: Facilitate orderly, safe, regular, and responsible migration through well-managed policies. Tracked through migrant recruitment costs, migration policy coverage, migrant deaths, and refugee shares by country of origin.
Target 10.a: Apply special and differential trade treatment for developing countries under WTO rules. This applies especially to least developed countries. Tracked through the share of duty-free tariff lines for their exports.
Target 10.b: Encourage aid and investment flows toward the countries that need them most. Tracked through total resource flows for development, including aid and foreign direct investment.
Target 10.c: Cut the transaction cost of migrant remittances to below 3% by 2030. Also eliminate corridors costing more than 5%. Tracked through remittance costs as a share of the amount sent.
Where global progress actually stands
The UN’s 2026 reporting calls this goal’s progress mixed, and the country-level split explains why. Most countries have improved on pro-poor growth and poverty reduction since 2015. Central and Southern Asia, and much of sub-Saharan Africa, have lagged behind.
Nearly 60% of countries saw pro-poor growth, meaning income for the bottom 40% grew faster than the national average. That is according to UN DESA’s Goal 10 tracker. That share has held roughly steady for years, but regional gaps are wide. Eastern and South-Eastern Asia, Europe, and Northern America post the strongest pro-poor growth rates.
Six in ten of 109 countries reduced the share of people living below 50% of median income since 2015. Even so, 13% of the global population still falls below that line. In Latin America and the Caribbean, that figure runs as high as 20%.
Discrimination remains widespread. Nearly one in five people globally report having personally experienced it in the past year. Women, people with lower incomes, people with less education, and people with disabilities are consistently the most affected groups.
Labor income has not recovered its pre-2015 share. The global labor income share stood at 52.6% in 2025, down 0.4 percentage points from a decade earlier. That decline puts upward pressure on inequality, since wages matter most to lower-income households.
Banking, by contrast, has strengthened steadily. The median Tier 1 capital ratio reached 17.09% in 2024, up from 16.73% the year before. Nonperforming loans fell to 2.95% of total loans, and median bank profitability stayed strong.
Migration and displacement paint the starkest picture. Global refugee density hit 440 per 100,000 people by mid-2025, more than double the 2015 rate of 214. The refugee population reached 37.8 million, driven largely by crises in Afghanistan, Syria, Ukraine, and Venezuela.
At least 7,900 people died or disappeared while migrating in 2025. That is down from a record 9,197 in 2024. The UN attributes part of the drop to worsening undercounting, not fewer deaths.
Remittances have gotten slightly cheaper. The average cost of sending $200 fell to 6.36% in the third quarter of 2025, down from 7.42% in 2016. Digital-only transfer services now average 3.54%, already close to the 3% target. Traditional non-digital transfers still average 7.3%.
The table below sets out where the core indicators stood as of the most recent reporting.
| Indicator | 2015 baseline | Most recent figure |
| Countries with pro-poor income growth for the bottom 40% | roughly 60% | roughly 60% (2025) |
| Population living below 50% of median income | not comparably tracked | 13% (2025) |
| People reporting personal discrimination | not comparably tracked | nearly 1 in 5 (2026) |
| Global labor share of GDP | 53.0% (est.) | 52.6% (2025) |
| Median bank Tier 1 capital ratio | not comparably tracked | 17.09% (2024) |
| Global refugee density (per 100,000 people) | 214 (2015) | 440 (mid-2025) |
| Migrant deaths and disappearances recorded | not comparably tracked | 7,900 (2025) |
| Average cost of sending $200 in remittances | 9.3% (2011) / 7.42% (2016) | 6.36% (Q3 2025) |
Source: UN DESA, Goal 10 progress reporting; UNHCR Global Trends 2025.
Countries ranked: from most equal to least equal
Income inequality is usually measured with the Gini index. It runs from 0, perfect equality, to 100, one person holding all income. Lower scores mean more equal distribution.
The table below moves from the most equal countries to the least. It draws on World Bank and World Inequality Database figures. We expanded it beyond the original 12 countries for a fuller regional spread. It now covers the Gulf, South Asia, and Latin America too.
| Country | Gini index | Standing |
| Slovakia | 23.8 | Most equal country with recent data |
| Belarus | 24.4 | Low-inequality band |
| Slovenia | 24.7 | Low-inequality band |
| India | 25.5 | Fourth most equal by World Bank measure (consumption-based, disputed) |
| Netherlands | 25.7 | Low inequality, strong welfare state |
| China | 26.0 | Below most of Europe |
| United Arab Emirates | 26.4 | Low inequality on paper, but the data is thin and outdated |
| Norway | 26.5 | Nordic redistribution model |
| Belgium | 26.8 | Low-mid inequality |
| Finland | 27.4 | Low-mid inequality |
| Ireland | 29.0 | Low-mid inequality |
| Sweden | 29.3 | Low-mid inequality |
| Canada | 29.9 | Low-mid inequality |
| Denmark | 29.9 | Low-mid inequality |
| France | 31.8 | Mid-range |
| Japan | 32.3 | Mid-range |
| Germany | 32.4 | Mid-range, typical for Western Europe |
| United Kingdom | 32.4 | Mid-range, typical for Western Europe |
| South Korea | 32.9 | Mid-range |
| Russia | 33.0 | Mid-range |
| Pakistan | 33.5 | Mid-range, latest data from 2024 |
| Nigeria | 33.9 | Mid-range, above regional peers |
| Italy | 34.3 | Mid-range |
| United States | 41.8 | High inequality among wealthy nations |
| Mexico | 43.5 | High inequality |
| Turkey | 44.5 | High inequality |
| Brazil | 51.6 | Among the least equal countries globally |
| Colombia | 53.9 | Among the least equal countries globally |
| Eswatini | 54.6 | Among the least equal countries globally |
| Botswana | 54.9 | Among the least equal countries globally |
| Namibia | 59.1 | Second-highest inequality in the world |
| South Africa | 63.0 | Highest income inequality in the world |
Source: World Bank, Poverty and Inequality Platform;World Inequality Database;FRED, Federal Reserve Bank of St. Louis. Each figure is the latest survey year available for that country. Most now sit between 2022 and 2024. A few, including the UAE, still rest on older surveys because no government agency has published a newer one.
Slovakia and the low-inequality cluster

Slovakia holds the lowest Gini index among countries with recent data, at 23.8. Belarus and Slovenia sit close behind, both under 25. The Netherlands, Norway, Belgium, and Finland round out the next tier, all under 28.
These countries share a common pattern. Progressive taxation compresses the income spread, and so do strong social safety nets and broad access to education. Central and Eastern European countries dominate the very bottom of the ranking. The cluster just above them is mostly Northern and Western European. The Nordic and Benelux welfare-state model shows up again and again in this band.
India
India’s position deserves a closer look, because the number is more contested than most. The World Bank ranked India the fourth most equal society globally in 2025. Its Gini score was 25.5, down from 28.8 in 2011.
That score is based on consumption expenditure, not income. India’s official surveys measure what households spend, not what they earn. Richer households save a larger share of income instead of spending it. That gap is why consumption data tends to show less inequality than income data.
Other inequality measures for India show a far starker gap. Wealth concentration reports from Oxfam and the World Inequality Lab are one example. That gap between data sources reflects a real methodological dispute, not a simple contradiction. It shows genuine disagreement over what SDG 10 should actually measure.
United Arab Emirates

The UAE sits at 26.4 on this table. That would place it among the more equal economies in the world. The figure deserves more scrutiny than most, because the data behind it is thin.
The most-cited World Bank-linked estimate dates to 2018. An earlier World Bank estimate from 2014 put the figure at 32.5, a meaningfully different number. At least one third-party inequality database lists a figure above 60. That’s inconsistent with every other source. It looks like a data or methodology error, not a real shift. The UAE doesn’t run the kind of regular household income and expenditure survey most Gini estimates rely on. Its labor force also includes a large non-citizen population, and standard household surveys often miss that group. That makes the true income distribution hard to capture with this measure at all.
Treat the UAE’s Gini figure as a rough, dated estimate, not a reliable current snapshot. This is a broader pattern across Gulf Cooperation Council states. Large low-wage migrant workforces sit alongside high-income citizen populations there. Standard household survey methods often fail to capture both groups well.
Pakistan

Pakistan’s most recent Gini estimate is 33.5, measured in 2024. That’s up from 29.6 in 2018. It now places Pakistan in the same mid-range band as Russia, South Korea, and Nigeria.
The rise lines up with a rough stretch for the economy. Pakistan went through sharp currency depreciation, high inflation, and an IMF-driven fiscal adjustment over that period. A wider Gini gap fits that pattern. Even this figure is already two years old, so it won’t capture whatever comes next.
United States

The United States sits at 41.8 on the Gini index, high for a wealthy country. It ranks well behind China (26.0), France (31.8), and Germany and the UK (32.4) on this measure.
The US Census Bureau separately measured the country’s own Gini coefficient at 48.9% in 2020, using a different method. That was the highest figure recorded in at least 50 years of US data.
High Gini scores in wealthy countries aren’t unusual. Inequality tends to rise with development unless a government deliberately offsets it through taxation and transfers. The US taxes and redistributes less than most peer economies. That’s the main reason it sits so far above other G7 members on this table.
Brazil, Colombia, and Latin America’s mid-to-high band
Brazil (51.6) and Colombia (53.9) anchor a distinct middle band. It sits between the wealthy-country cluster and the Southern African cluster at the bottom of the table. Mexico (43.5) does somewhat better but still sits well above the global median.
Latin America’s persistently high inequality traces back to land ownership concentration. Informal labor markets play a part too, sitting outside minimum-wage and social-protection systems. Progressive taxation has also historically been weaker here than in Europe. Unlike South Africa’s cluster below, this isn’t one shared historical cause across the region. Each country’s numbers trace back to a different mix of land, labor, and tax policy. The outcome just looks similar on this table.
South Africa
South Africa has the highest income inequality of any country with recent data, at a Gini score of 63.0. Eswatini, Botswana, and Namibia follow close behind, all above 54.
That concentration isn’t accidental. Apartheid-era policy segregated economic opportunity for decades, and the effects persist in land ownership, education access, and employment today. Southern African countries dominate the highest end of the global inequality ranking as a direct result.
The refugee-hosting gap
SDG 10’s migration targets expose a different kind of inequality, over who actually carries the burden of global displacement. Iran, Türkiye, Germany, Colombia, Uganda, Chad, and Pakistan host the largest refugee populations in the world.
Low-income countries hold just 8% of global population and 0.3% of global GDP. Yet they host 18% of the world’s refugees. High-income countries, with nearly two-thirds of global wealth, host only 29%.
Uganda, Sudan, Chad, and the Democratic Republic of the Congo carry some of the heaviest loads. Their own resources are the thinnest. That imbalance is exactly what SDG 10’s between-country half is meant to address. Progress on it has been limited so far.
What organizations and institutions are doing
Inequality-reduction efforts run through a mix of bodies. Monitoring agencies, financial institutions, and labor and migration bodies all play a part.
UN DESA and the SDG progress reporting system
UN DESA compiles the annual global SDG progress report, including the Goal 10 extended report used throughout this piece. Data feeds in from the World Bank, ILO, UNHCR, IOM, and national statistical offices.
The International Labour Organization
The ILO tracks the labor share of GDP. It also pushes the Social Protection Floors Recommendation, a 2012 standard promoting universal social protection. Its data underpins Target 10.4 reporting worldwide.
UNHCR and IOM
UNHCR publishes the annual Global Trends report tracking refugee numbers, hosting countries, and displacement causes. The IOM’s Missing Migrants Project is the main source for migrant death and disappearance data under Target 10.7.
The World Bank and IMF
The World Bank maintains the Gini index dataset used to compare inequality across countries. Both institutions have also faced pressure to give developing countries a larger voting share. That pressure is documented in UN reporting under Target 10.6.
How businesses can contribute to SDG 10
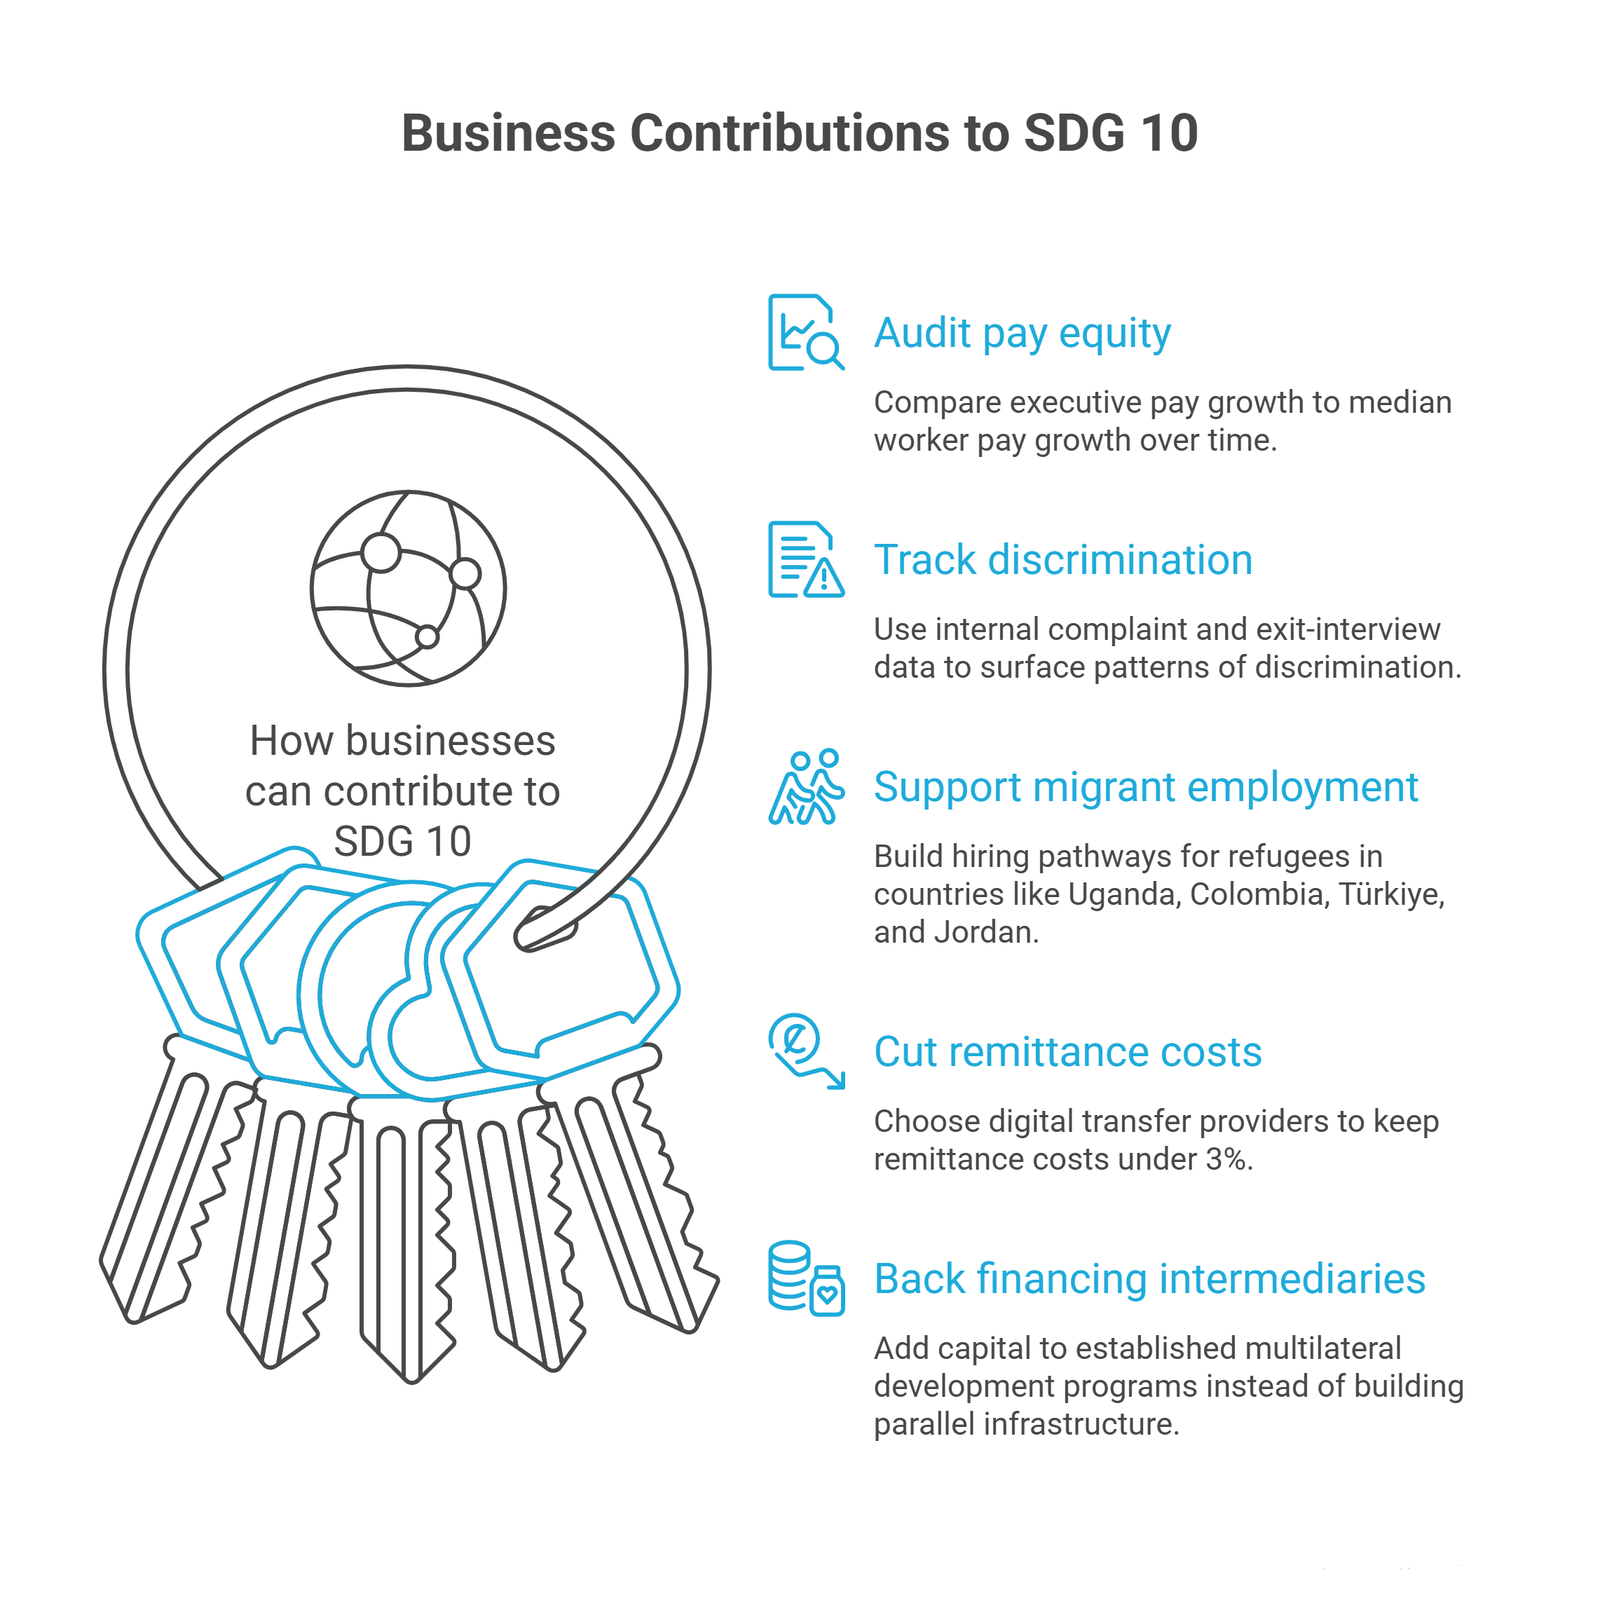
The same exercise applies here as it does for any SDG a company has no formal mandate on. Start with where operations touch inequality directly, then look outward from there.
Audit pay equity and internal income distribution
Target 10.4 is fundamentally about the labor share of income. A company can measure its own version of that. Compare executive pay growth to median worker pay growth over time.
Treat discrimination reporting as an operational metric, not just a policy
Target 10.3 tracks people who report experiencing discrimination directly. Internal complaint and exit-interview data can surface the same pattern before it becomes a legal or reputational problem.
Support migrant and refugee employment pathways
Target 10.7 is about safe, well-managed migration. Companies operating in refugee-hosting countries can build hiring pathways for that population. Uganda, Colombia, Türkiye, and Jordan are strong starting points. Doing so formalizes what is often informal labor.
Cut remittance costs where you control payment rails
Target 10.c has a concrete number attached to it: remittance costs under 3%. Companies paying international staff or contractors can choose digital transfer providers over traditional ones. Digital-only operators already average close to that target.
Back financing intermediaries instead of building parallel infrastructure
Multilateral development flows toward least-developed countries already exist under Target 10.b. They serve as coordinated financing routes. Adding capital to an established program usually reaches people faster. Building a standalone initiative from nothing rarely does.
Frequently Asked Questions
How many SDG 10 targets and indicators are there?
Ten targets: seven outcome targets and three means-of-implementation targets. They are tracked through 14 indicators.
Is any country on track to meet SDG 10 by 2030?
Progress is mixed rather than uniformly off track. Pro-poor growth is holding at roughly 60% of countries. Labor income share, discrimination, and refugee density have all moved the wrong way since 2015.
Which countries have the most equal income distribution?
Slovakia, Slovenia, Belarus, and India currently report the lowest Gini index scores among countries with recent World Bank data. All sit under 26.
Which countries have the least equal income distribution?
South Africa has the highest Gini index in the world, at 63.0. Namibia, Botswana, Colombia, and Eswatini also rank among the most unequal.
Is the Gini index a perfect measure of inequality?
No. It captures income or consumption inequality, not wealth inequality, which is typically far more extreme. India’s low score, based on consumption data, is disputed by wealth-based estimates showing much higher inequality.
Can a business without a formal inequality mandate still contribute to SDG 10?
Yes. The clearest levers are auditing internal pay equity and treating discrimination reports as an operational metric. Building migrant and refugee hiring pathways helps too, along with using lower-cost digital remittance channels.
Conclusion
The number worth sitting with is not the roughly 60% of countries posting pro-poor growth, encouraging as that is. It is that global labor income share has still not recovered its 2015 level. Refugee density has more than doubled in the same decade.
Slovakia and its low-Gini neighbors show what sustained redistribution policy can do over time. South Africa shows how deeply historical policy can entrench inequality for generations. The refugee-hosting numbers show a between-country gap that mirrors the within-country one. The people with the least resources carry the heaviest load.
None of that gets fixed by monitoring alone. Businesses have a narrower lever than governments and multilateral institutions, but a real one. That means auditing pay equity, treating discrimination data seriously, and building migration and remittance pathways that actually work.
All of that holds up better with financial models built to survive scrutiny. Building a financial model around fair pay structures, migrant workforce programs, or an equity-focused nonprofit? Oak’s nonprofit financial modeling services can help. Oak builds the numbers behind the mission.