SDG 6: Clean Water and Sanitation, and the 2.1 Billion People Still Waiting
SDG 6: clean water and sanitation, ten years in
One in four people on the planet still cannot get safe drinking water. That is the finding from the UN’s 2026 tracking data. It comes a decade after SDG 6 was adopted.
Sanitation is worse. 3.4 billion people still lack safely managed toilets and waste disposal. Some numbers have moved in the right direction.
Open defecation has dropped by 429 million people since 2015. Wastewater treatment has barely moved at all since 2020.
This guide covers what SDG 6 actually commits the world to. It covers where the 2026 reporting shows progress standing, country by country. That ranges from nations with universal coverage to nations still measuring access in single digits. It also covers what businesses can realistically do about it.
What is SDG 6
SDG 6 is formally titled “Ensure availability and sustainable management of water and sanitation for all.” It is the sixth of the 17 Sustainable Development Goals. All 193 UN member states adopted it in 2015, as part of the 2030 Agenda.
The goal covers more than household taps and toilets. It spans drinking water, sanitation, and hygiene. It also covers wastewater treatment, water quality, water-use efficiency, scarcity, ecosystem protection, and cross-border cooperation on shared rivers and aquifers.
A country can raise drinking water coverage and still leave sanitation untouched. It can build sewers in its capital and leave rural wastewater completely untreated. SDG 6 treats access, quality, efficiency, and governance as separate fronts. All of them need to move together. That is part of why the UN’s own reporting says none of its targets are on track for 2030.
The official targets and indicators behind SDG 6
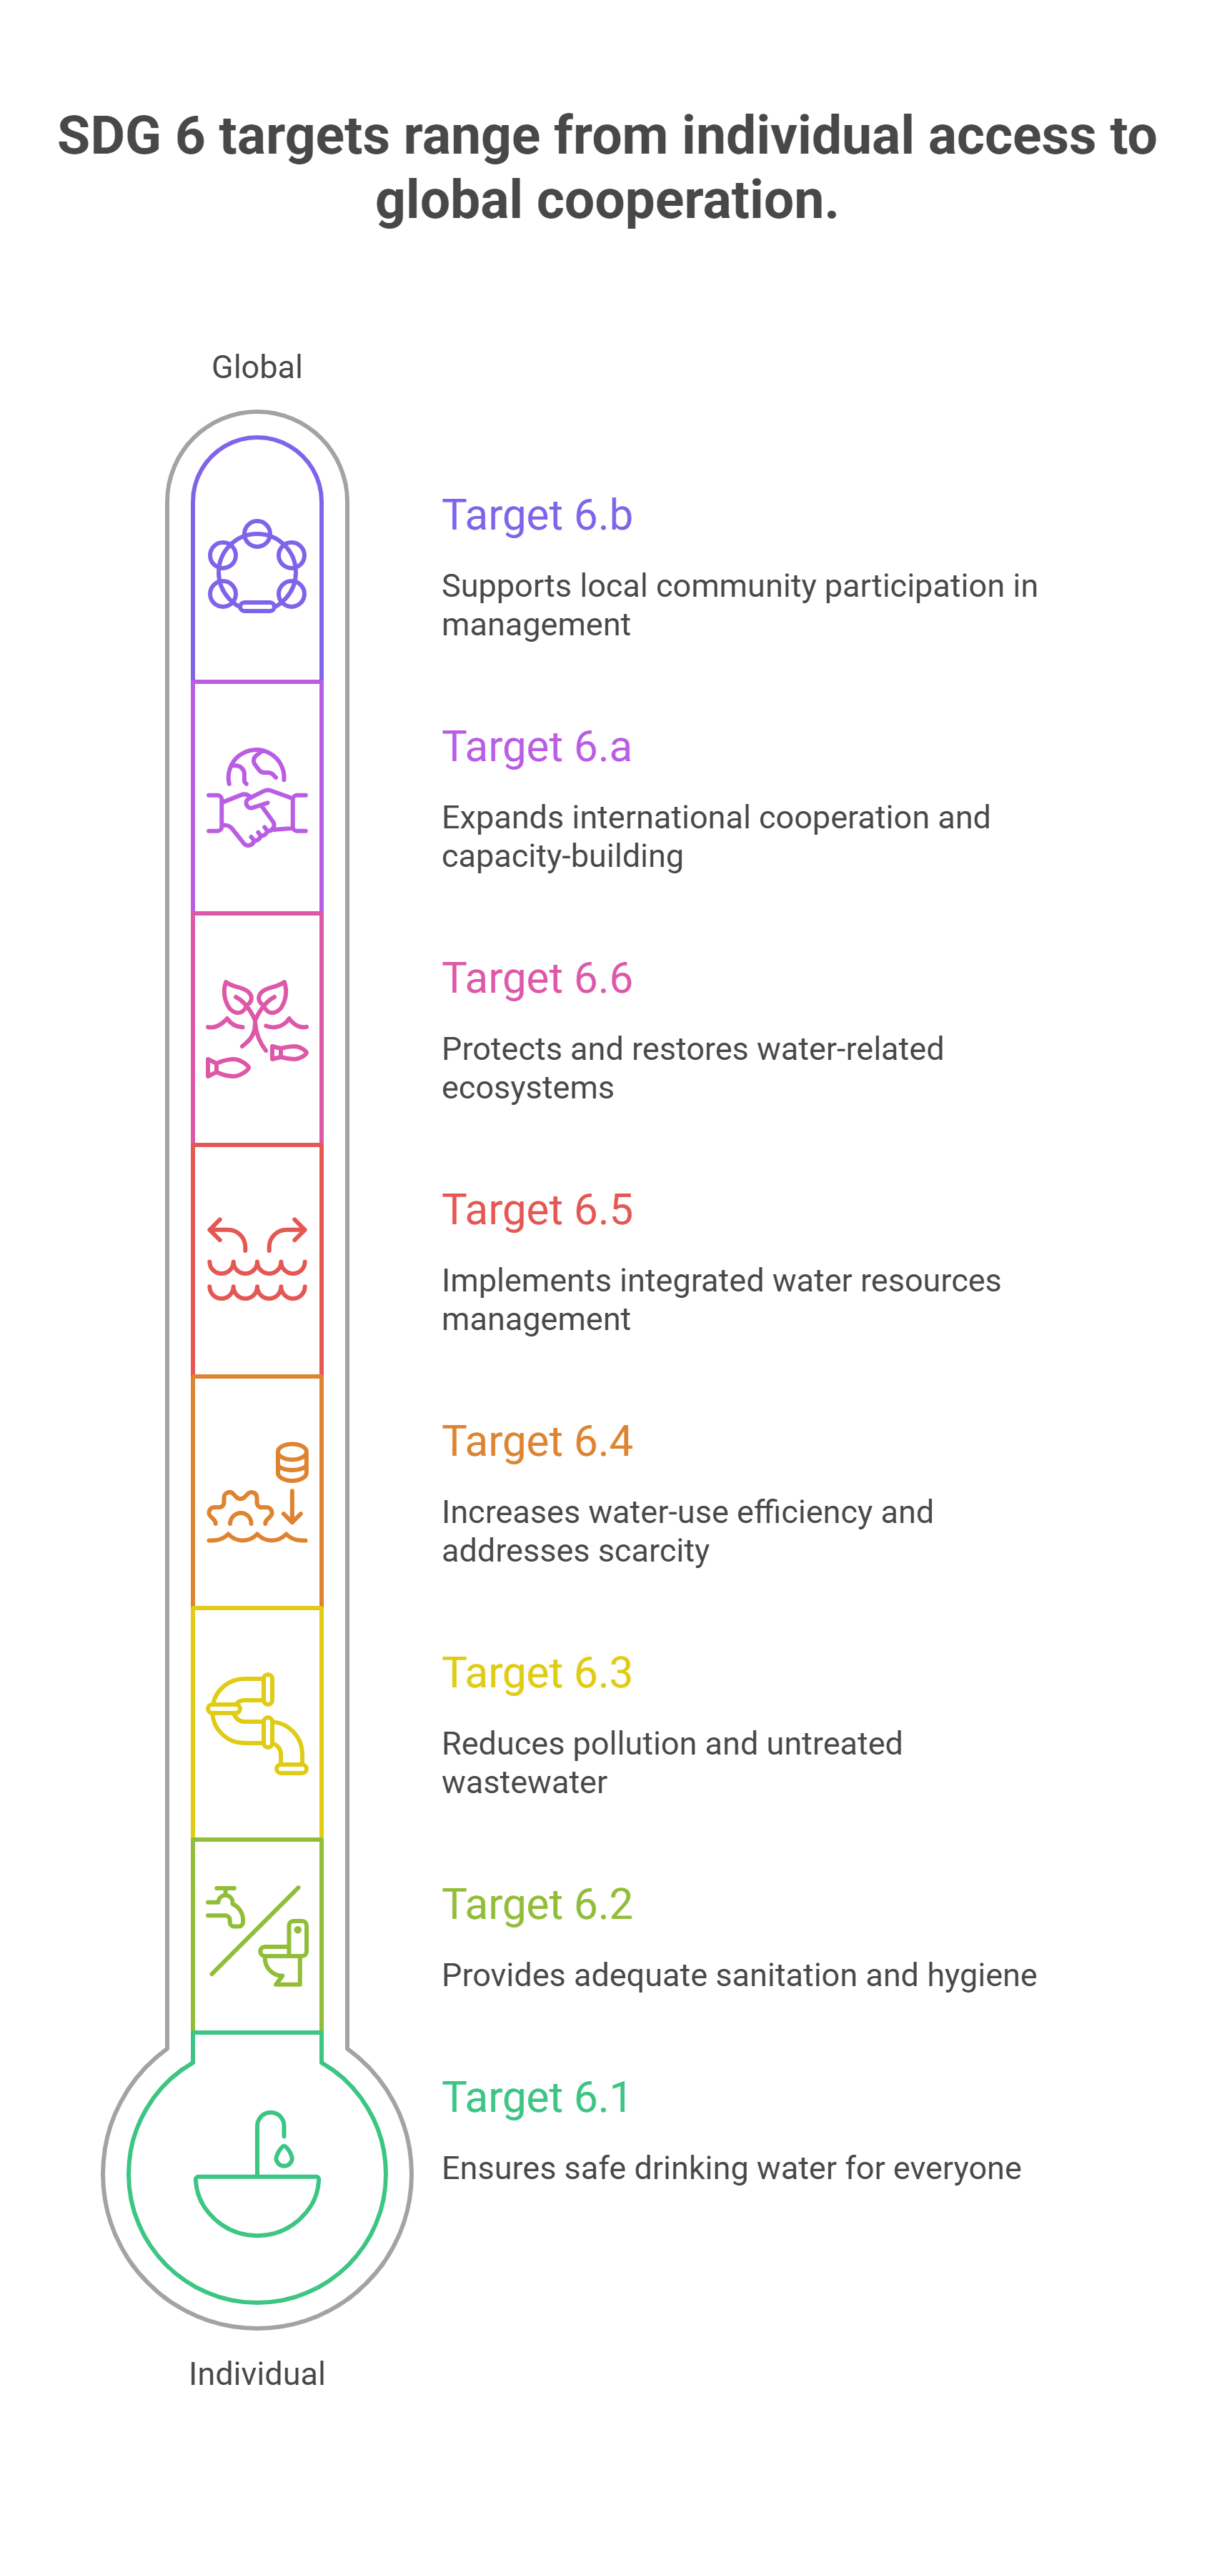
SDG 6 breaks down into eight official targets. Six are outcome targets, numbered 6.1 through 6.6. Two are means-of-implementation targets, numbered 6.a and 6.b.
Together they are tracked through 11 indicators, as set out on the UN’s SDG 6 page.
Target 6.1: Achieve universal and equitable access to safe, affordable drinking water for all by 2030. Tracked through the proportion of the population using safely managed drinking water services.
Target 6.2: Achieve adequate and equitable sanitation and hygiene for all. End open defecation, with special attention to women and girls. Tracked through the share of the population using safely managed sanitation and handwashing facilities.
Target 6.3: Improve water quality by cutting pollution and dumping, and halve the share of untreated wastewater. Tracked through wastewater safely treated, and the proportion of water bodies with good ambient quality.
Target 6.4: Substantially increase water-use efficiency and address water scarcity across all sectors. Tracked through change in water-use efficiency, and the level of water stress. Water stress means freshwater withdrawal as a share of available resources.
Target 6.5: Implement integrated water resources management at every level, including transboundary cooperation. Tracked through the degree of implementation, and the share of shared river basins with an operational cooperation arrangement.
Target 6.6: Protect and restore water-related ecosystems, including wetlands, rivers, and lakes. Tracked through change in the extent of those ecosystems over time.
Target 6.a: Expand international cooperation and capacity-building for developing countries, including desalination and wastewater reuse. Tracked through water-sector aid included in a government-coordinated spending plan.
Target 6.b: Support and strengthen local community participation in water and sanitation management. Tracked through the share of local administrative units with operational procedures for that participation.
Where global progress actually stands
The UN’s 2026 reporting is direct about this. None of SDG 6’s targets are on track to be met by 2030.
Drinking water access has improved steadily, but not fast enough. Between 2015 and 2024, safely managed drinking water access rose from 68% to 74%. Safely managed sanitation rose from 48% to 58%. Basic hygiene services rose from 66% to 80%, according to UN DESA’s Goal 6 tracker.
That still leaves enormous gaps. In 2024, 2.1 billion people lacked safely managed drinking water. 3.4 billion lacked safely managed sanitation. 1.7 billion lacked basic hygiene services at home.
Schools are affected too. In 2023, 447 million children were in schools without basic drinking water. 427 million lacked basic sanitation at school. 646 million lacked basic hygiene facilities there.
Wastewater treatment is the target with the least movement. An estimated 56% of household wastewater was safely treated in 2024. That is exactly where it stood in 2020. Roughly 44% of everything flushed or drained worldwide still goes untreated into the environment.
Water-use efficiency has improved, but stayed uneven. Global efficiency rose from $17.4 per cubic metre in 2015 to $21.5 in 2023, a 24% increase. Even so, 54% of countries still operate below $20 per cubic metre. Global water stress has barely shifted since 2015.
Integrated water resources management, the governance side of SDG 6, is inching forward. Implementation rose from 49% in 2017 to 57% in 2023, against a 2030 target of 91%. Of the 153 countries sharing transboundary rivers, lakes, or aquifers, only 43 have strong cooperation arrangements. Those cover 90% or more of the shared water. More than 20 countries have no arrangement at all.
Funding tells its own story. Official development assistance to the water sector reached $9.6 billion in 2024, up from $8.9 billion the year before. Commitments specifically for water supply and sanitation fell 6.7% from 2023. Spending on agricultural water and hydropower rose instead.
The table below sets out where the core indicators stood as of the most recent reporting.
| Indicator | 2015 baseline | Most recent figure |
| Population using safely managed drinking water | 68% | 74% (2024) |
| Population using safely managed sanitation | 48% | 58% (2024) |
| Population with basic hygiene services | 66% | 80% (2024) |
| People practising open defecation | 783 million (est.) | 354 million (2024) |
| Household wastewater safely treated | not comparably tracked | 56% (2024, flat since 2020) |
| Global water-use efficiency | $17.4/m3 | $21.5/m3 (2023) |
| Integrated water resources management implementation | 49% (2017) | 57% (2023) |
| ODA disbursed to the water sector | $8.6 billion (2015) | $9.6 billion (2024) |
Source: UN DESA, Goal 6 progress reporting; WHO/UNICEF Joint Monitoring Programme, 2025.
Countries ranked: from best performing to struggling
Water and sanitation access varies more by country than almost any other SDG indicator. A handful of nations have already reached full coverage. A handful of others are still measuring safe access in single digits.
The table below moves from the strongest performers to the weakest. It draws on the WHO/UNICEF Joint Monitoring Programme’s 2025 country estimates.
| Country or region | Safely managed drinking water access | Standing |
| Netherlands, Hungary, New Zealand, Singapore, Kuwait | 100% | Universal coverage, among 31 countries at full access |
| United States | 97.5% | Near-universal, small rural and tribal gaps remain |
| UAE | Near-universal | High access, but built on unsustainable groundwater and desalination |
| Albania | 71% | Weakest access in Europe |
| Pakistan | 45% | Roughly half the population still without access |
| Mexico | 43% | Weakest access in Latin America and the Caribbean |
| Indonesia | 30.5% | Weakest access in Southeast Asia |
| Sub-Saharan Africa (regional average) | 32% | Lowest-performing region worldwide |
| Chad | 7% | Tied for the lowest access globally |
| Central African Republic | 7% | Tied for the lowest access globally |
As of 2024, 31 countries had reached universal access to safely managed drinking water. The UN expects that number to grow to 38 by 2030. Another 89 countries had at least universal basic access, one rung below full safety. Twenty-eight countries, most in Africa, still had more than one in four people without even basic water.
Singapore
Singapore has almost no natural freshwater. It has no lakes, minimal groundwater, and historically depended on Malaysia for imported water. By geography alone, it should rank among the world’s most water-insecure nations.
Instead it built its way out of the problem. Its national water agency, PUB, runs a strategy called the Four National Taps. That means rainwater from local catchments, imported water, recycled wastewater called NEWater, and desalinated seawater.
NEWater alone meets around 40% of national demand today. The government is targeting up to 55% by 2060. Reverse osmosis and UV disinfection make the recycled water safe enough to drink, though most currently goes to industry. Five desalination plants add a weather-independent supply on top of that.
The lesson from Singapore is narrow but real. Physical water scarcity does not have to mean access failure. Not if a country invests early and consistently in treatment infrastructure.
United States
The United States sits near the top of the global table at 97.5% access. It is not, despite the reputation, at 100%. That gap is concentrated in a few specific places.
The Navajo Nation is the starkest case. Roughly 30 to 40% of homes there lack piped water, by tribal and federal counts. Some households on the reservation are 67 times more likely to lack running water than other Americans. Families haul water by truck over long distances instead.
Other gaps exist too, in rural Appalachia, parts of Alabama, and Texas border colonias. A national report from DigDeep and the US Water Alliance tracked this closely. It documented over two million Americans without any running water or basic plumbing at home.
The US case is a reminder that a national average can hide real gaps. High overall coverage does not mean uniform coverage, especially for tribal and rural communities.
The wealth paradox: water stress in the Gulf
Access and scarcity are not the same problem. Nowhere shows that better than the Gulf states. Kuwait withdraws the equivalent of 3,850% of its renewable freshwater supply, the highest rate in the world. The UAE and Saudi Arabia follow closely behind.
These countries have almost no rivers, lakes, or reliable rainfall. Bahrain, Kuwait, Qatar, and Oman rank among the five most water-stressed countries on Earth, according to the World Resources Institute.
Wealth has let them route around the crisis. Desalination and imported technology fill the gap that nature does not. Poorer water-stressed nations, including Yemen and parts of the Horn of Africa, face the same physical scarcity. They lack the capital to build their way out of it. Water stress is a resource problem everywhere. It only becomes a development crisis where the money to engineer around it is missing.
UAE
The UAE illustrates the paradox on its own. Access to drinking water is effectively universal there. Yet the country sits among the most water-stressed nations on the planet.
Rainfall averages just 78 millimetres a year. Roughly 72% of water used comes from groundwater, much of it non-renewable and being pumped far faster than it recharges. Desalination supplies most of the rest, at real energy and carbon cost.
In 2017 the UAE launched its Water Security Strategy 2036 to address that dependence. The plan targets a 21% cut in total water demand and a jump in treated wastewater reuse to 95%. It also aims to hold two days of national water storage in reserve for emergencies.
The UAE shows that near-perfect access can sit on a fragile base. Solving the visible SDG 6.1 target does not automatically fix the underlying 6.4 scarcity problem behind it.
India
India shows what fast, government-led sanitation reform looks like. In 2014, it launched the Swachh Bharat Mission with one blunt goal: end open defecation nationwide.
By October 2019, roughly 500 million people across 110 million households had gained a household toilet. Villages across every state and territory declared themselves open defecation free. South Asia, driven largely by India, accounted for three-quarters of the global drop in open defecation between 2000 and 2017.
The mission did not stop at construction. A second phase now targets solid and liquid waste management. Building toilets is only the first half of safe sanitation.
India’s experience suggests political will and sustained funding move fast. Few other SDG targets anywhere have moved this quickly at this scale.
Chad

Chad sits at the opposite end of the table. Its problem is compounding rather than simple. Only 52% of the population has access to even basic drinking water, dropping to 44% in rural areas.
Lake Chad, once one of Africa’s largest freshwater bodies, has shrunk by roughly 90% since the 1960s. About 30 million people across four countries depend on it. They farm, herd, and fish along its shrinking shoreline. Drought, overuse, and conflict have combined to strain the region’s water supply.
The Sudan crisis has made this worse. Refugees in eastern Chad received just 5 litres of water per person per day as of mid-2025. The international standard is 15 to 20 litres. Chad has a roadmap to end open defecation by 2030. Reaching it means roughly one million Chadians a year must stop the practice. That is not the current pace.
What organizations and institutions are doing
Water governance under SDG 6 runs through technical monitoring bodies and country-level acceleration programs. There is no single central fund.
WHO/UNICEF Joint Monitoring Programme
The WHO/UNICEF Joint Monitoring Programme is the primary source tracking drinking water, sanitation, and hygiene at country level. It has published comparable estimates since 1990. Most SDG 6 reporting draws on this dataset.
UN-Water
UN-Water coordinates the technical side across UN agencies. It publishes the annual SDG 6 Synthesis Report, timed to the High-Level Political Forum’s review of the goal. Since 2022, it has also produced yearly Country Acceleration Case Studies. These document what worked in countries like Pakistan and Cambodia, so other governments can copy it.
UN Special Envoy on Water
A UN Special Envoy on Water, appointed in 2024, now advocates directly for faster implementation.
UN Water Conference
The 2026 UN Water Conference, co-hosted with the UAE, is meant to be the decade’s checkpoint. Four years remain to 2030.
How businesses can contribute to SDG 6
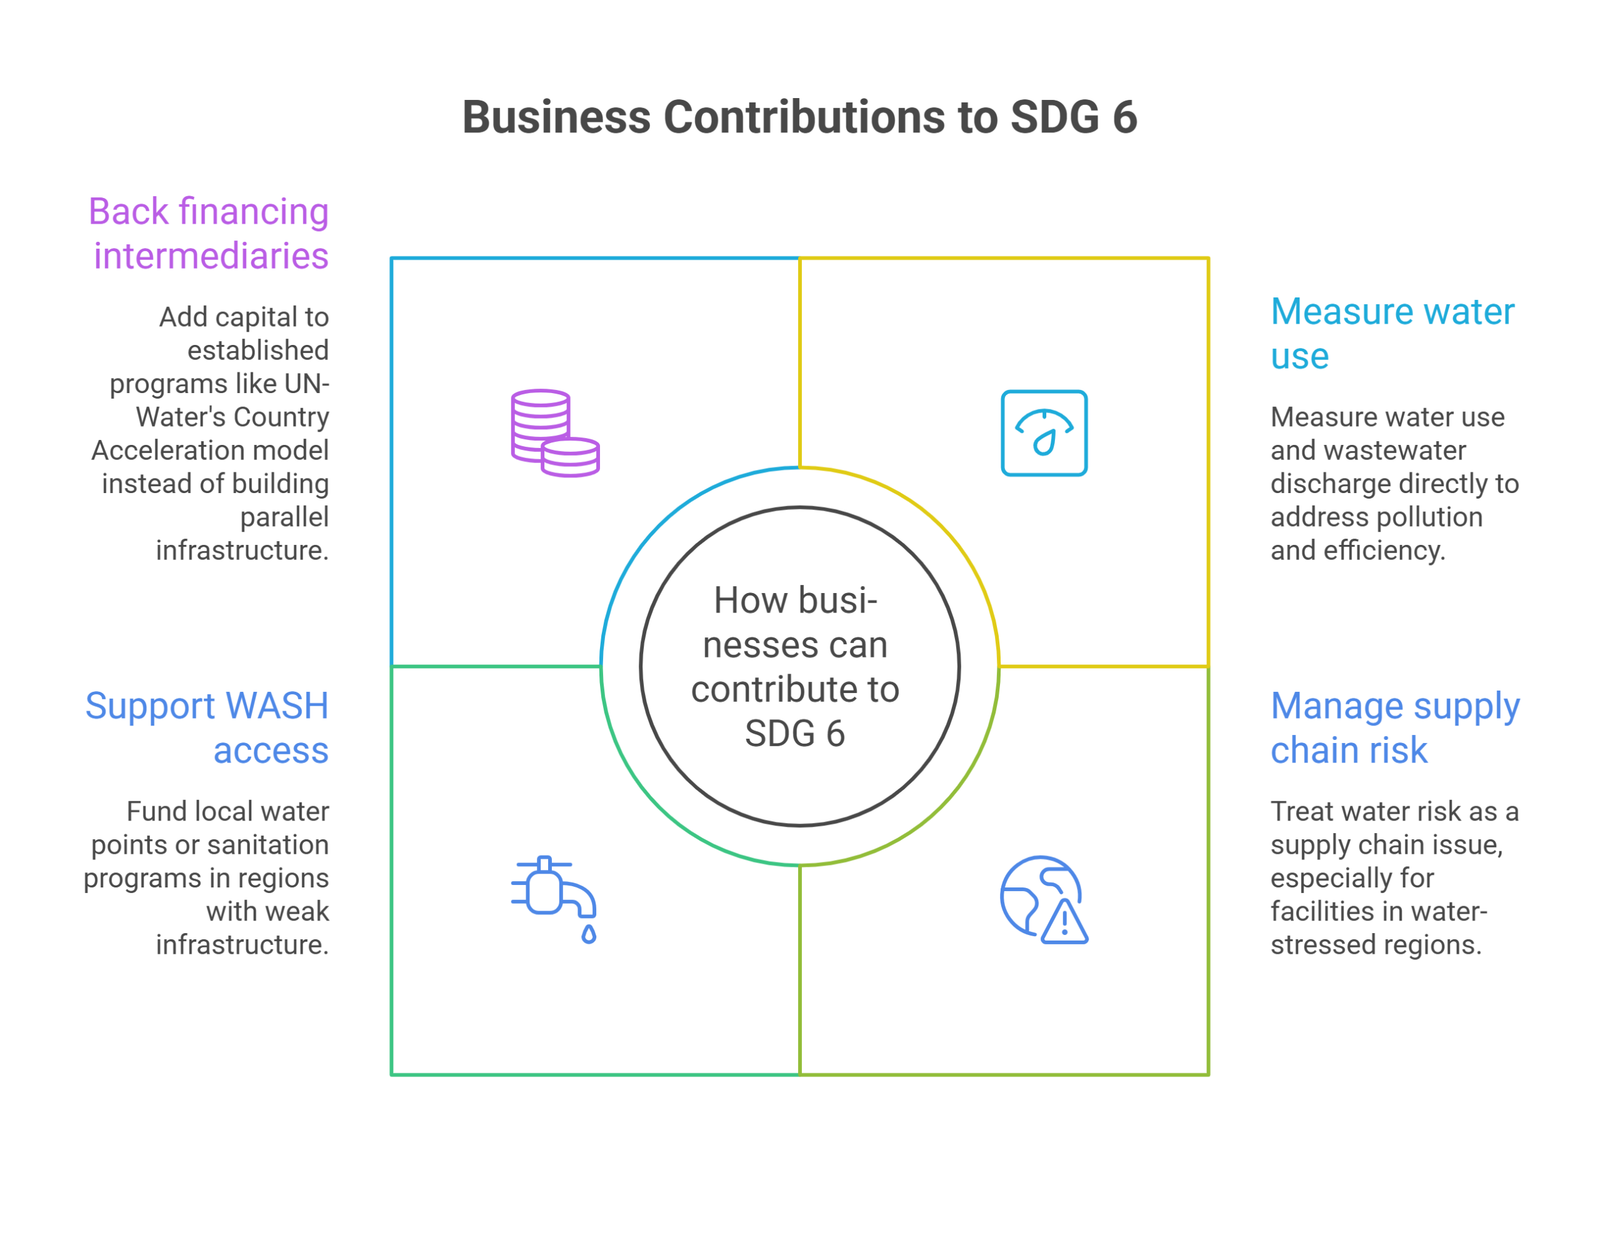
The same exercise applies here as it does for any SDG a company has no formal mandate on. Start with where operations touch water. Then look outward from there.
Measure water use and wastewater discharge directly
Targets 6.3 and 6.4 cover pollution and efficiency. Both are things a business can measure on its own, before waiting for regulation. Manufacturing, agriculture, and hospitality are the most exposed sectors. They draw the most water and discharge the most wastewater per unit of output.
Treat water risk as a supply chain issue, not just a facilities issue
Singapore’s experience is instructive here. A company with facilities or suppliers in water-stressed regions faces real operational risk. That includes much of the Gulf, North Africa, and Central and Southern Asia, if supply tightens further.
Support WASH access through supplier and community programs
Target 6.b is about community participation in water and sanitation management. Companies sourcing from regions with weak WASH infrastructure have an option. Funding local water points or sanitation programs is a direct, measurable contribution. It beats a general donation, and pairing it with a proper nonprofit business plan helps the receiving organization put the funding to structured use.
Back financing intermediaries instead of building parallel infrastructure
UN-Water’s Country Acceleration model, and the broader aid channel to water and sanitation, already exist as coordinated financing routes. Adding capital to an established program usually reaches people faster. Building a standalone initiative from nothing rarely does.
Frequently Asked Questions
How many SDG 6 targets and indicators are there?
Eight targets: six outcome targets and two means-of-implementation targets. They are tracked through 11 indicators.
Is any country on track to meet SDG 6 by 2030?
No. The UN’s 2026 reporting states plainly that none of SDG 6’s targets are on track globally. That holds true even in countries making fast individual progress, like India on sanitation.
Which countries have the best access to clean water?
The Netherlands, Hungary, New Zealand, Singapore, and Kuwait have reached full, universal access to safely managed drinking water. They sit among 31 countries at that level worldwide, per the most recent WHO/UNICEF estimates.
Which countries have the worst access to clean water?
Chad and the Central African Republic report the lowest access in the world. Only around 7% of their populations reach safely managed drinking water services.
Is water stress the same thing as lacking water access?
No. Water stress measures how much of a country’s renewable freshwater is withdrawn each year. Wealthy but arid nations like Kuwait and Qatar face extreme stress, yet maintain high access through desalination. Poorer water-stressed countries often lack both.
Can a business without a water-related mandate still contribute to SDG 6?
Yes. The most direct levers are measuring internal water use and wastewater discharge. Add to that assessing supply chain exposure to water-stressed regions, and funding established WASH programs rather than building parallel ones.
Conclusion
The number worth sitting with is not the 74% of the world now covered by safely managed drinking water. That gain is real. The more telling number is that wastewater treatment has not moved in six years. Two countries still report access levels barely above one in ten.
Singapore shows what sustained investment in treatment infrastructure can do, even without natural water resources. India shows how fast a sanitation target can move with political commitment behind it. Chad shows what happens when drought, conflict, and funding shortfalls compound at once. A roadmap alone does not close a gap this size.
None of that gets fixed by monitoring alone. The flat wastewater-treatment numbers since 2020 suggest it will not get fixed by incremental funding increases either. Businesses have a narrower lever than governments and UN agencies, but a real one. That means measuring water use, assessing supply chain exposure, and backing programs that already work.
All of that holds up better with financial models built to survive scrutiny. Building one for a water infrastructure venture, or a WASH-focused nonprofit? Oak’s nonprofit financial modeling services can help, drawing on work like this nonprofit financial modeling case study. Oak builds the numbers behind the mission.