Top Healthcare Financial Metrics and KPIs to Track
Best Healthcare Financial Metrics and KPIs to Track
If you run a hospital, clinic, or any healthcare organization, you already know that keeping the lights on is just as hard as keeping patients healthy. Margins are thin. Payers are demanding. Patients are responsible for more of their own costs than ever before. And the administrative overhead of billing, coding, and collections can swallow a team whole if you are not paying close attention.
That is where healthcare financial metrics come in. Not as a compliance checkbox or a quarterly reporting exercise, but as a genuine window into how your organization is actually performing. The right metrics tell you where money is leaking, where your processes are strong, and where you need to make changes before a small problem becomes a serious one.
This guide walks you through the most important healthcare financial metrics, explains what they mean in plain terms, shows you how to calculate them, and gives you the benchmarks you should be aiming for.
Why Financial Metrics Matter More Than Ever
US healthcare organizations lose an estimated $125 billion annually on unpaid and underpaid claims. That is not a rounding error. It represents inefficiencies in billing, gaps in follow-up, preventable denials, and revenue that simply walks out the door.
At the same time, costs have been outpacing revenue for nine in ten healthcare organizations in recent years, driven by rising labor expenses, workforce shortages, and increasing payer complexity. In this environment, tracking the right financial KPIs is not optional. It is the difference between a financially stable organization and one that is quietly heading toward crisis.
The Healthcare Financial Management Association (HFMA) has identified 29 KPIs specifically for revenue cycle benchmarking, grouped into five major areas: Patient Access, Pre-Billing, Claims, Account Resolution, and Financial Management. Tracking all 29 at once is overwhelming for most teams. A smarter approach is to understand the full picture, then choose the metrics most relevant to your organization’s biggest challenges.
The Revenue Cycle: A Quick Orientation
Before diving into the numbers, it helps to understand what the revenue cycle actually is. It covers every step from the moment a patient schedules an appointment to the moment their bill is fully paid. That includes:
- Patient registration and insurance verification
- Charge capture after the visit
- Medical coding and claims submission
- Payer adjudication and payment posting
- Denial management and appeals
- Patient billing and collections
A failure at any one of these steps creates downstream problems. A registration error on day one can lead to a denied claim six weeks later. That is why financial metrics are not just for the billing department. Everyone who touches patient data is part of the revenue cycle.
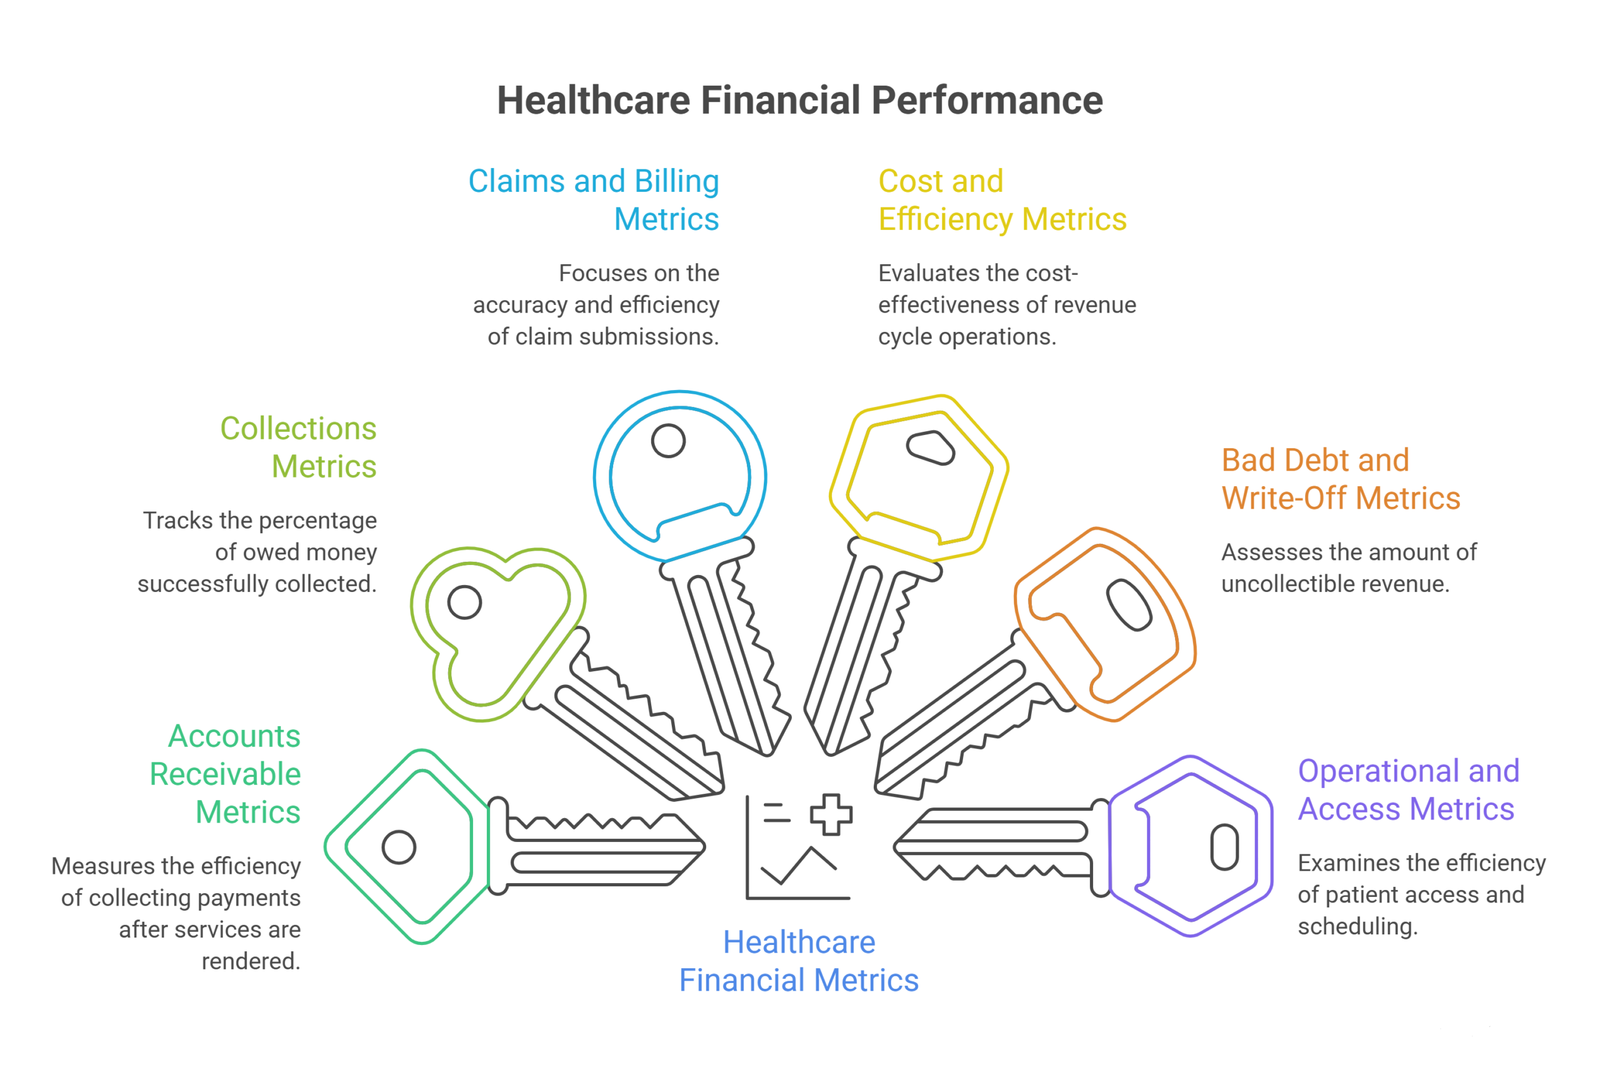
Category 1: Accounts Receivable Metrics
Days in Accounts Receivable (AR)
This is probably the single most watched metric in healthcare finance. It measures how many days, on average, it takes your organization to collect payment after a service is rendered.
Formula:
Net AR / Average Daily Net Patient Service Revenue
What to aim for: 30 to 40 days is the widely accepted target. Under 30 is excellent. Anything over 50 is a signal that something in your billing or follow-up process needs attention.
What it tells you: A rising AR days figure usually points to one of a few things: claims are being submitted with errors, payers are delaying adjudication, patients are not paying their portion, or your follow-up team is understaffed. Breaking this metric down by payer class, such as separating Medicare, Medicaid, commercial, and self-pay, helps you pinpoint exactly where the slowdown is happening.
A note on aging: Beyond your overall AR days, keep a close eye on the percentage of your AR that is sitting over 90 days. Fewer than 10% of your outstanding accounts should be in that bucket. Anything older than that becomes significantly harder and more expensive to collect.
Rolling AR
This is a running total of all unpaid claims and invoices as of today. Where net AR days gives you an average, rolling AR gives you the raw dollar figure of revenue that has been earned but not yet collected. It is a useful companion to AR days when assessing cash flow and planning.
Category 2: Collections Metrics
Net Collection Rate
This metric tells you what percentage of the money your organization is actually owed (after contractual adjustments) you are successfully collecting. It is one of the clearest indicators of your billing team’s overall effectiveness.
Formula:
(Payments Collected / Net Collectible Charges) x 100
What to aim for: 95% or higher is the benchmark for high-performing organizations. Anything below 90% should prompt a systematic review of your billing and collections processes.
Why it matters: Unlike the gross collection rate, the net collection rate strips out contractual write-offs (amounts you agreed not to collect because of payer contracts). That makes it a much more honest picture of whether your team is actually capturing the revenue you are entitled to.
Gross Collection Rate
Formula:
(Total Payments Received / Total Charges) x 100
This is a broader measure, but less precise than the net rate because it includes your full charge master prices, which often have little relationship to what you actually get paid. Use it alongside your net collection rate. A significant gap between the two is worth investigating.
Patient Payment Collection Rate
As high-deductible health plans become the norm, a growing share of your revenue now comes directly from patients rather than insurers. This metric tracks how effectively you are collecting those out-of-pocket amounts.
Formula:
(Patient Payments Collected / Total Patient Responsibility) x 100
One important principle here: collecting before or at the time of service is dramatically more effective than chasing patients after the fact. The more you can shift toward point-of-service collection, the better this number will be.
Cash Collection Percentage
Formula:
Cash Collected / Net Patient Services Revenue
This metric, recommended by HFMA, gives you a picture of financial viability at the macro level. A healthy organization should aim to collect approximately 100% of its average monthly net revenue from the preceding three months.
Category 3: Claims and Billing Metrics
Clean Claim Rate
A clean claim is one that goes out the door correctly the first time, with no missing information, no coding errors, and no eligibility issues. The clean claim rate measures what percentage of your submitted claims meet that standard.
What to aim for: Industry best practice is 95% or higher. Top-performing organizations often hit 98% or above.
Why it matters: Every claim that needs to be corrected and resubmitted costs you time, money, and delays cash flow. A clean claim rate below 90% is a serious operational problem, usually pointing to issues in registration, coding, or charge capture.
Claim Denial Rate
The denial rate is the percentage of claims that payers reject outright. This is one of the most commonly tracked metrics in revenue cycle management, and for good reason. Denials are expensive, not just because of the lost revenue, but because of the staff time required to work them.
Formula:
(Number of Denied Claims / Total Claims Submitted) x 100
What to aim for: Under 5%. High performers often sit at 2% or below.
What drives denials: The most common reasons include eligibility issues, missing or incorrect prior authorizations, coding errors, duplicate claims, and missing documentation. If your denial rate is high, categorizing denials by reason and by payer will quickly show you where to focus.
First-Pass Rate (First-Pass Resolution Rate)
This measures what percentage of claims are paid on the very first submission, with no rework required. It is closely related to the clean claim rate but focuses on the payment outcome rather than the submission quality.
What to aim for: 90% or higher. First-pass rates below 85% indicate systematic problems in your pre-billing process.
Claim Appeal Rate
When claims are denied, your team needs to decide whether to appeal. The appeal rate tracks what percentage of denials you are actually fighting. Tracking this alongside your appeal success rate tells you whether your denials are recoverable (payer error, documentation issues) or represent genuine lost revenue.
Late Charges as a Percentage of Total Charges
Charges should be captured within three to five days of the date of service. When charges come in late, they delay billing, create cash flow gaps, and sometimes miss filing deadlines entirely.
What to aim for: Late charges should represent no more than 2% of total charges. Only about 32% of healthcare providers currently capture all charges within the first 24 hours, which means there is substantial room for improvement across the industry.
Category 4: Cost and Efficiency Metrics
Cost to Collect
This metric tells you how much it costs your organization to collect one dollar of revenue. It is a direct measure of revenue cycle efficiency.
Formula:
Total Revenue Cycle Cost / Total Patient Service Cash Collected
What to aim for: Best-in-class organizations operate at around $0.03 to $0.05 per dollar collected. Anything above $0.10 suggests significant inefficiency.
What drives this number: Staffing levels, technology investment, denial rates, and the complexity of your payer mix all affect cost to collect. Automating routine tasks like eligibility verification and claim status checks is one of the most reliable ways to reduce this figure.
Revenue Per Patient Visit
This metric tracks the average revenue your organization generates from each patient encounter. It is useful for forecasting, identifying seasonal trends, and understanding how your payer mix affects your financial performance.
Formula:
Total Revenue Generated / Total Number of Patient Visits
Tracking this by month helps you identify slow periods and take proactive steps to protect cash flow during those times.
Work RVUs (Relative Value Units)
RVUs are a standardized way of measuring the value of clinical work. Each medical service is assigned an RVU based on the complexity, time, and skill required to perform it. Tracking total work RVUs helps organizations assess clinical productivity and ensure that providers are being fairly compensated for the work they do.
This metric is especially useful for physician practice management and for benchmarking productivity across providers or specialties.
Category 5: Bad Debt and Write-Off Metrics
Bad Debt Rate
Bad debt represents money that your organization has essentially given up on collecting. These are accounts that have been written off because all collection efforts have been exhausted.
Formula:
(Total Write-offs / Total Accounts Receivable) x 100
Why it matters: Some bad debt is inevitable. But a rising bad debt rate is a sign that something upstream is broken, whether in patient financial counseling, eligibility verification, or collections follow-up. Tracking bad debt by payer source helps identify which patient populations or coverage types are driving the problem.
Denial Write-offs as a Percentage of Net Patient Service Revenue
When a denial is appealed and still not paid, and the organization decides to write it off rather than pursue it further, that amount shows up here. This metric is a trailing indicator of how much revenue is being permanently lost to the denial management process.
Formula:
Net Dollars Written Off as Denials / Average Monthly Net Patient Service Revenue
A high figure here often signals either a systemic coding problem, a payer compliance issue, or inadequate denial management resources.
Category 6: Operational and Access Metrics
Pre-Registration Rate
Pre-registration is the process of capturing patient information, verifying insurance, and addressing eligibility issues before the patient arrives. A high pre-registration rate dramatically reduces errors downstream.
What to aim for: As close to 100% as possible for scheduled visits. Even getting to 80% makes a meaningful difference in claim quality.
No-Show Rate
Every missed appointment is lost revenue and wasted capacity. The no-show rate measures what percentage of scheduled patients do not appear.
Reducing no-shows through automated reminders, easy rescheduling options, and online self-scheduling is one of the fastest ways to improve revenue per available appointment slot.
Time to Schedule
The time between when a patient requests an appointment and when they actually get one affects both revenue and patient satisfaction. Long waits can cause patients to seek care elsewhere, reducing visit volume.
Building a Dashboard That Works
Tracking every possible metric is not the goal. The goal is to track the right metrics for your organization’s specific challenges and to make them visible to the people who can act on them.
A good revenue cycle dashboard should:
Show real-time data. Waiting for monthly reports means problems have already compounded by the time you see them.
Be role-specific. A billing manager needs to see denial rates by payer. A CFO needs to see net collection rate and days in AR. Different views for different roles are far more useful than one giant report.
Connect to benchmarks. Numbers without context are not very useful. Knowing your AR days are 45 is more meaningful when you know that 30 to 40 is the target and 50 is the warning zone.
Flag trends, not just snapshots. A single data point tells you where you are. A trend tells you where you are heading.
Common Mistakes Organizations Make With Financial Metrics
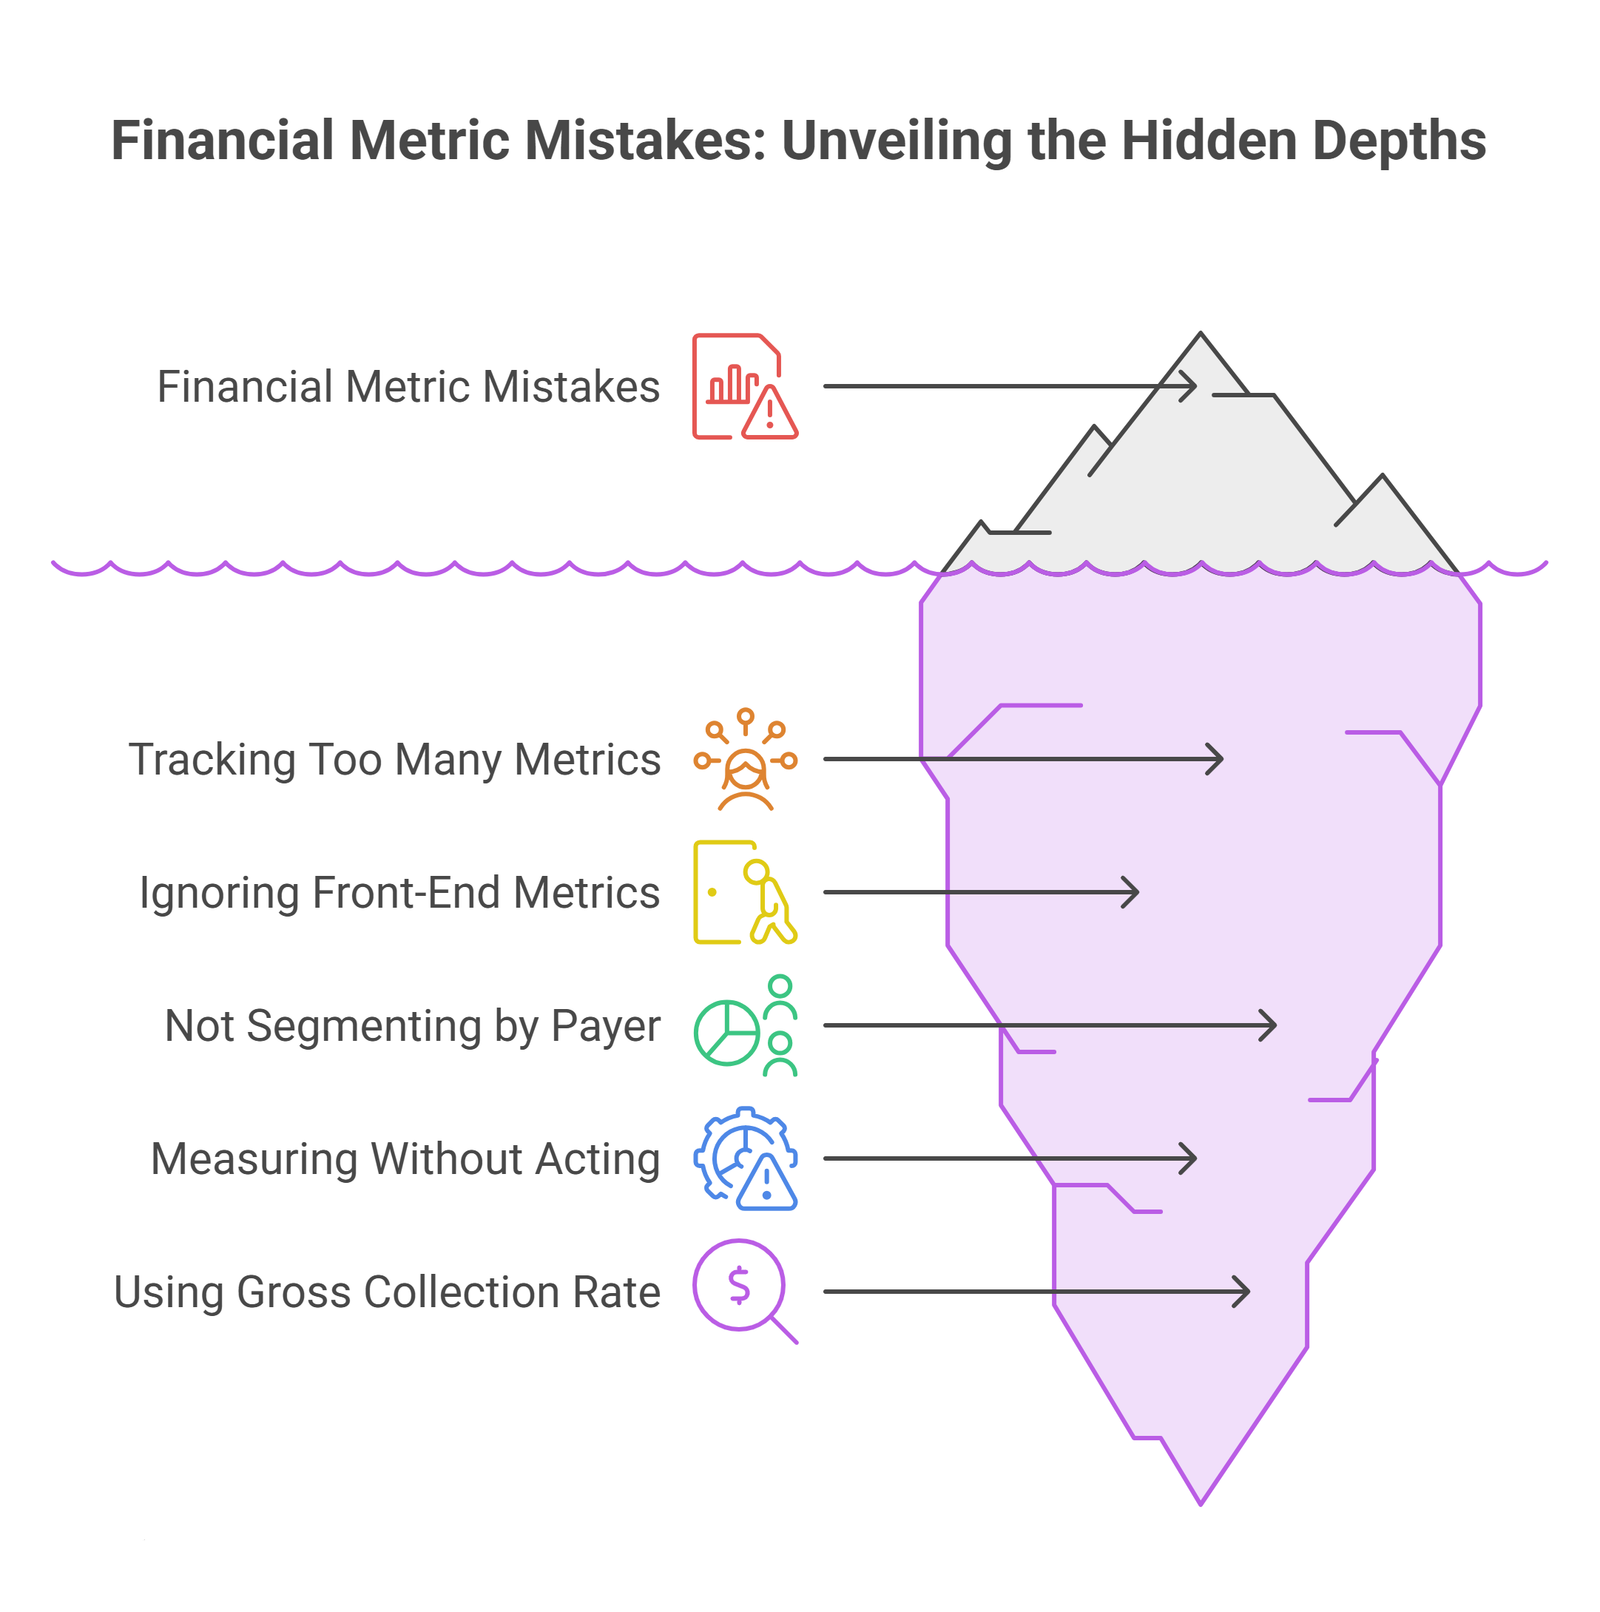
Tracking too many things at once. When everything is a priority, nothing is. Start with five to seven core metrics and track them consistently before adding more.
Ignoring front-end metrics. Most revenue cycle problems start at registration and eligibility. Focusing only on billing and collections metrics means you are always fighting fires instead of preventing them.
Not segmenting by payer. Your AR days might look fine on average, but one slow-paying commercial payer could be hiding a serious problem. Always break key metrics down by payer class.
Measuring without acting. Metrics are only valuable if they drive decisions. If your denial rate has been above 8% for three months and nothing has changed, the problem is not data, it is accountability.
Using gross collection rate as the primary performance measure. Because it is based on inflated charge master prices, the gross collection rate flatters performance. Net collection rate is the more honest number.
Specialty-Specific Considerations
Different types of healthcare organizations face different revenue cycle challenges, and your choice of metrics should reflect that.
Medical specialists (cardiology, orthopedics, surgery) tend to focus on denial rates for high-value procedures, prior authorization tracking, and revenue per procedure.
Behavioral health providers often focus on the time gap between session delivery and claim submission, as documentation requirements create unique delays.
Radiology and imaging centers track the time from image acquisition to billing, which reflects workflow efficiency across both clinical and administrative teams.
Surgical centers pay close attention to surgery-specific denial rates, utilization of operating room time, and revenue per OR hour.
Primary care practices tend to prioritize AR days, clean claim rates, and patient payment collection rates given their high volume and lower per-visit revenue.
The Role of Technology
Modern revenue cycle management technology can do a lot of the heavy lifting. Automated eligibility verification, AI-assisted coding, predictive denial prevention, and real-time dashboards have made it significantly easier for organizations to track and improve their metrics.
That said, technology is not a substitute for process. A well-designed workflow with the right technology is unbeatable. Bad processes with great technology just fail faster.
When evaluating RCM technology, look for tools that integrate with your EHR, consolidate data across your billing systems, and provide role-appropriate dashboards rather than generic reports.
Frequently Asked Questions
What is the most important healthcare financial metric to track?
There is no single universal answer, but for most organizations, days in accounts receivable is the best starting point. It gives a clear picture of overall revenue cycle efficiency and tends to move in response to problems across multiple parts of the billing process. If AR days are trending in the wrong direction, it is usually a sign to dig deeper into your clean claim rate, denial rate, and payer-specific performance.
What is a good claim denial rate for a medical practice?
The industry benchmark is under 5%, with high-performing organizations often achieving 2% or lower. A denial rate consistently above 10% signals a systemic problem in coding, eligibility verification, or authorization management that needs to be addressed urgently.
How often should we review our revenue cycle KPIs?
Core metrics like AR days, denial rate, and clean claim rate should be reviewed at least monthly, and ideally weekly for high-volume practices. Some metrics, like claim status and new denials, benefit from daily monitoring. Trend analysis over a rolling 12-month period helps distinguish seasonal patterns from genuine performance shifts.
What is the difference between gross and net collection rate?
The gross collection rate compares payments collected to your total billed charges, which are often inflated and do not reflect real-world reimbursement. The net collection rate compares payments to what you are actually contractually allowed to collect, making it a far more accurate measure of how effectively your team is doing its job.
Conclusion
Healthcare financial metrics are not just accounting tools. They are a real-time view into the health of your organization’s operations, the integrity of your billing processes, and your ability to sustain the clinical mission you are there to serve.
The organizations that do this well share a few common traits: they are proactive rather than reactive, they track metrics at the right level of granularity, and they tie every number back to a specific action. They do not just know their denial rate is 7%. They know it is 7% because their largest commercial payer started rejecting claims for a specific CPT code six weeks ago, and they have already reassigned a biller to work that queue.
Start with the core metrics covered here. Get consistent with how you calculate and report them. Build accountability around improving the ones that matter most to your organization right now. Over time, the discipline of tracking these numbers creates a culture where revenue integrity is everyone’s job, not just the billing department’s problem.
Financial health enables clinical excellence. The two are not in tension. They work together, and the numbers are how you keep them aligned.Stop Letting Inefficient Metrics Cost You Millions From Days in AR to Net Collection Rates, tracking KPIs is only the first step, knowing how to fix the operational leaks is what saves your margin. Partner with our specialized healthcare CFO services to build real-time dashboards, eliminate billing bottlenecks, and maximize your profitability. Request your free metrics audit.