Food Industry Financial Model: 7 Drivers that Decide Your Margin
Food Financial Model: How to Forecast Costs, Margins and Cash Flow
A food business can sell out every week and still run short of cash. The cause is rarely a mystery. Ingredient prices move faster than price lists. A few points of yield loss end up in the bin. A retailer asks for a promotion that cuts the margin before the product leaves the warehouse.
A generic template cannot show any of that. A food industry financial model can, because it builds the forecast from the details that move the numbers: product mix, ingredient cost, yield, trade spend, labor, shelf life and payment terms.
This guide skips the general mechanics of financial modeling. It covers what is specific to food: the seven drivers, two worked examples with hypothetical numbers, how the model changes by business type, and the mistakes that break food forecasts most often.
What makes a food model different
Any model links an income statement, a balance sheet and a cash flow statement. In food, the real work sits in an operating layer underneath them.
In a packaged food company, that layer is a table with one row per SKU: price by channel, ingredient and packaging cost per unit, yield and monthly volume. Additionally, in a restaurant, it is customers, average check, menu mix and the share of sales spent on food and labor. In an importer, it is landed cost, inventory days and supplier terms.
The statements pull from that layer. Gross margin stops being a typed number. It becomes a result the model calculates.
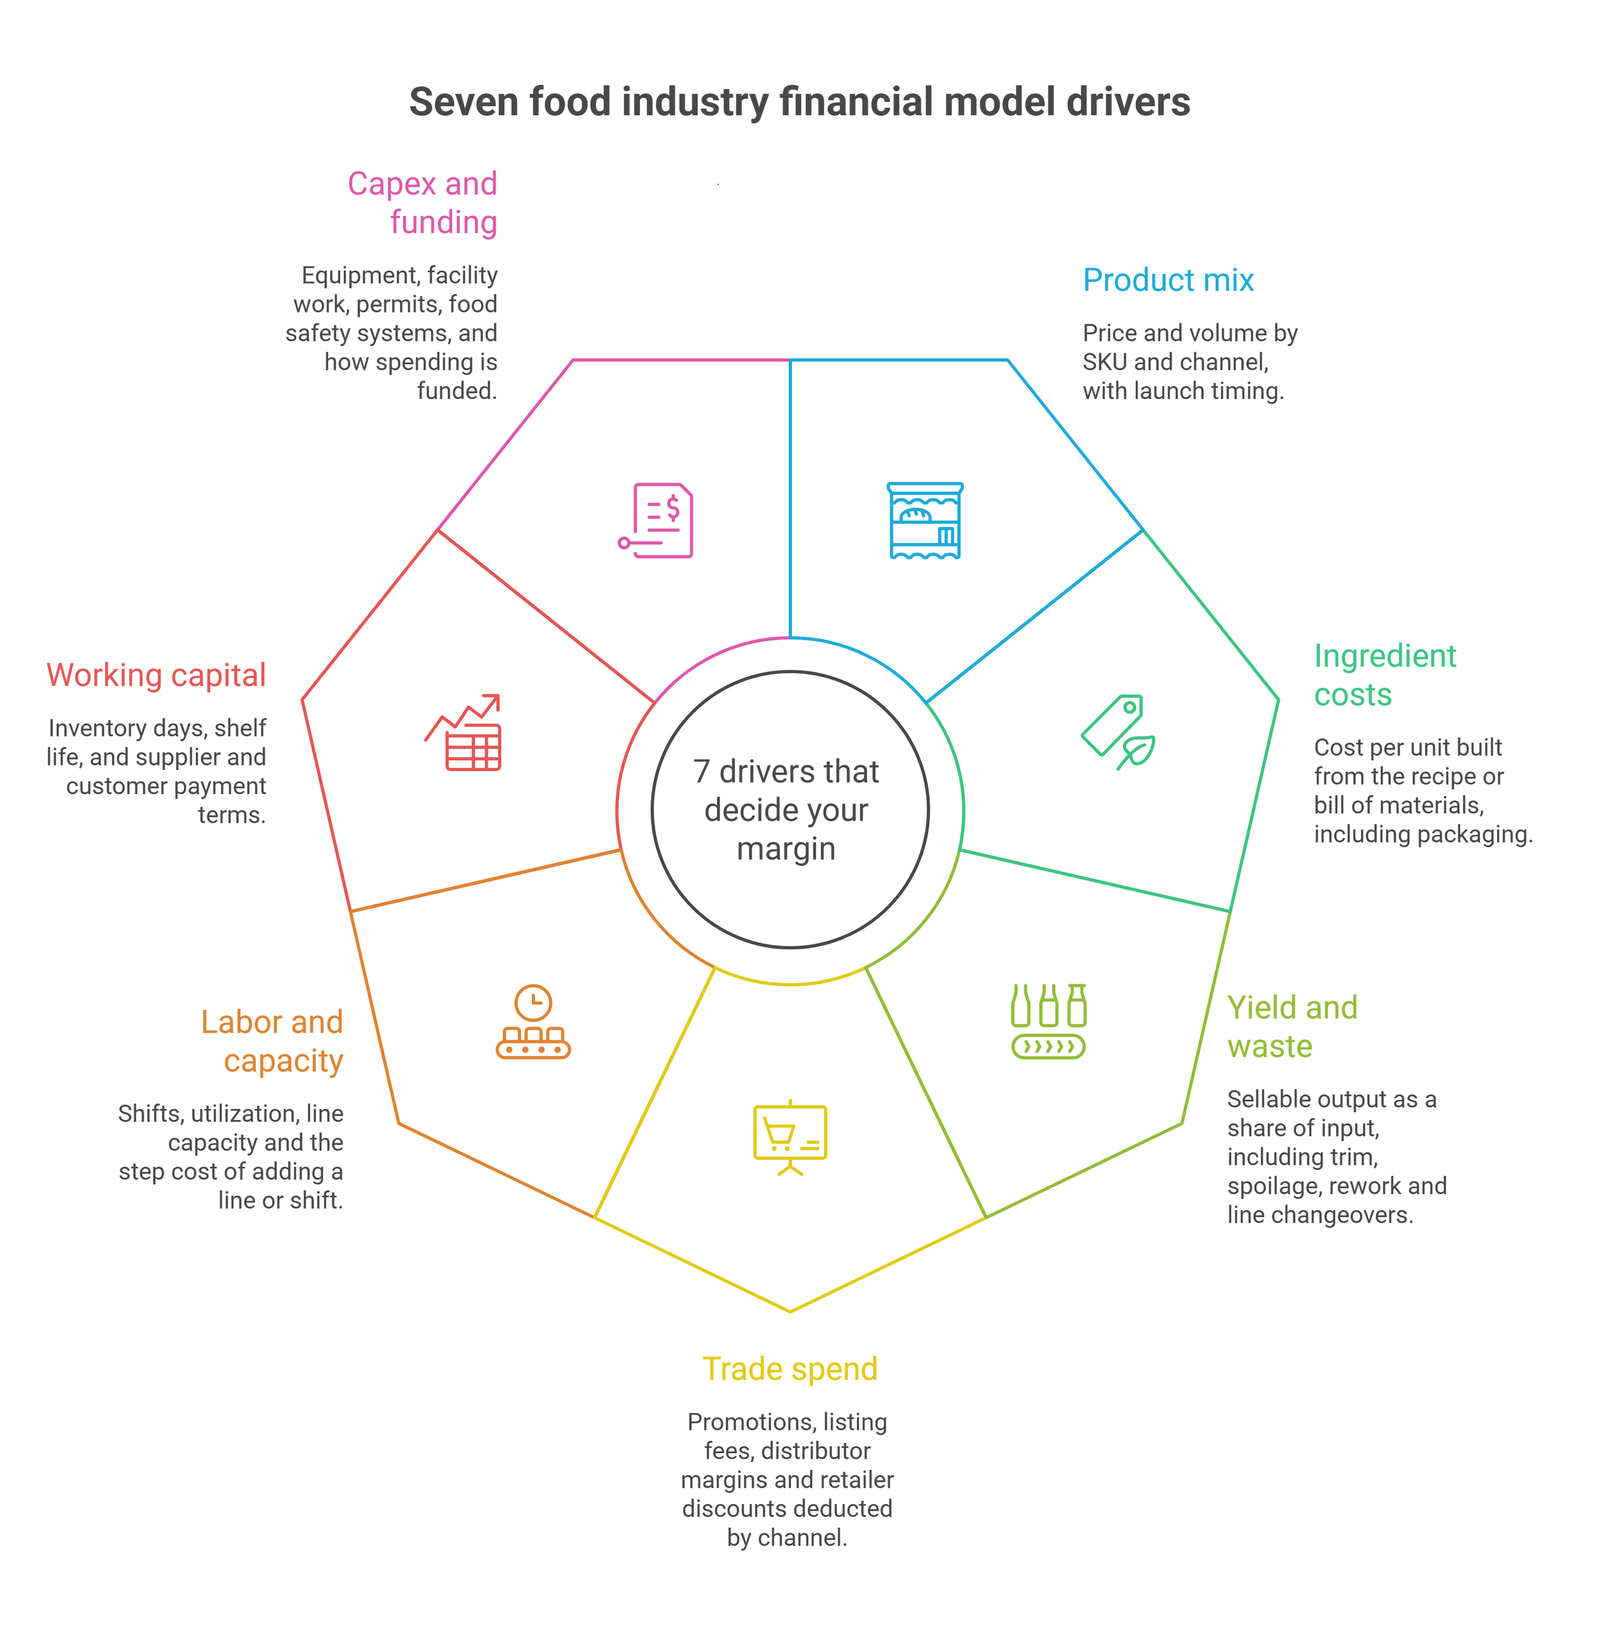
| Driver | What to model | What goes wrong without it |
| Product mix and channel pricing | Price and volume by SKU and channel | One blended margin hides the products that lose money |
| Ingredient and packaging cost | Cost per unit built from the recipe | Cost of goods drifts when supplier prices move |
| Yield and waste | Sellable output as a share of input | Margin leaks that nobody can see |
| Trade spend and channel margins | Deductions from list price, by channel | Net revenue is overstated |
| Labor and capacity | Shifts, line capacity and step costs | Growth plans the plant cannot deliver |
| Working capital and shelf life | Inventory days, supplier and customer terms | Profit on paper and an empty bank account |
| Capex and funding | Equipment, fit-out, debt and equity | Startup costs far above plan |
1. Product mix and channel pricing
A snack sold through a supermarket earns less per unit than the same snack sold from a website. It does not have one margin. It has two.
Price every SKU by channel. Build revenue as units multiplied by net price, summed across SKUs and channels for each month. Then add three timing inputs:
- Launch month. A new product rarely hits full volume in month one.
- Ramp curve. It shows how fast volume builds.
- Seasonality. Enter a monthly index where 1.00 is an average month. A holiday peak might sit at 1.30 and a summer dip at 0.80.
Restaurants and cafes start from traffic instead. Enter customers per hour at peak and off-peak, the hours in each band and the days open per week.
2. Ingredient and packaging cost
Cost of goods should come from a recipe or bill of materials. A flat percentage of sales hides too much.
Ingredient cost per sellable unit = (quantity of each ingredient x its price) / yield
When one ingredient dominates the recipe, such as cocoa, cooking oil or flour, give it its own price line. Then test a spike. Packaging needs the same care, because minimum order quantities can tie up cash before a single unit sells.
Importers add freight, duty and exchange rates. Those belong in the cost per unit, not in overhead.
3. Yield and waste
Yield is the share of input that becomes sellable product. Trim, spoilage, rework and line changeovers all reduce it.
Model theoretical yield and expected actual yield as two inputs. The gap between them is where margin quietly leaks. Restaurants track the same idea as a waste percentage of food purchases. Cold-chain businesses add shrink and energy. The National Frozen & Refrigerated Foods Association’s 2025 Food Waste Insights Report treats both as financial levers.
4. Trade spend and channel margins
Promotions, listing fees, distributor margins and retailer discounts come off the list price before cost of goods is counted. Restaurants face the same thing through delivery platform commissions.
Net revenue = list price – promotions – listing fees – distributor margin – retailer discounts – platform commissions
Model percentage deductions by channel. Enter fixed fees, such as listings, as separate lines.
5. Labor and capacity
A production line has a ceiling. Labor is only partly flexible. The model needs shifts per day, days per week, units per hour and a utilization rate. Plan a ramp, not full capacity from month one.
Convert schedules into full-time equivalents with care. Two shifts a day with two people each, six days a week, comes to 4.8 full-time equivalents, not 4.
Then add step costs. A second line or a third shift brings a jump in payroll, utilities and maintenance. Splitting costs into fixed and variable matters here. The guide on how to calculate fixed and variable costs shows how to handle mixed costs.
6. Working capital and shelf life
A fast-growing food brand pays for ingredients and packaging first. Then it waits for retailers to pay. That gap can sink a profitable business.
Shelf life caps inventory days. Some retailers also demand a minimum remaining shelf life at delivery, so the usable window is shorter than the date on the pack.
Worked example: what a 30-day payment delay costs
The figures are hypothetical. Daily cost of goods sold is $4,000. Daily net revenue is $6,000.
| Item | Days | Amount |
| Inventory | 45 | $180,000 |
| Receivables | 40 | $240,000 |
| Payables (cost of goods as a proxy for purchases) | 20 | $80,000 |
| Net working capital | $340,000 |
Now customers pay 30 days later. Receivable days rise from 40 to 70. Receivables grow to $420,000 and net working capital to $520,000. The business must find another $180,000. Sales and margin did not change at all.
7. Capex and funding
Food businesses carry equipment that other sectors skip: cold storage, packaging lines, extraction, food safety systems and permits. Give each one a line. Keep one-time launch spend apart from monthly running costs. Add replacement capex for equipment that wears out.
Then show the funding as a sources and uses table. The two totals must match. Uses include equipment, fit-out, opening inventory, pre-opening payroll and working capital.
Worked example: how trade spend and yield move margin
The figures are hypothetical and chosen for easy arithmetic. They are not client data. A packaged snack lists at $3.00 a pack. In the “yield slips” case, ingredient cost per sellable pack rises 5%, from $0.80 to $0.84.
| Per pack | Base case | Yield slips | Trade spend +5 points | Both together |
| List price | $3.00 | $3.00 | $3.00 | $3.00 |
| Trade spend | $0.45 (15%) | $0.45 (15%) | $0.60 (20%) | $0.60 (20%) |
| Net revenue | $2.55 | $2.55 | $2.40 | $2.40 |
| Ingredients | $0.80 | $0.84 | $0.80 | $0.84 |
| Packaging | $0.30 | $0.30 | $0.30 | $0.30 |
| Direct labor | $0.35 | $0.35 | $0.35 | $0.35 |
| Plant overhead | $0.25 | $0.25 | $0.25 | $0.25 |
| Cost of goods | $1.70 | $1.74 | $1.70 | $1.74 |
| Gross profit | $0.85 | $0.81 | $0.70 | $0.66 |
| Gross margin on net revenue | 33.3% | 31.8% | 29.2% | 27.5% |
Five extra points of trade spend cost 15 cents a pack. The yield slip costs 4 cents. Here, the promotion hurts far more than the waste. A founder would negotiate the promotion first. The order can flip with pricier ingredients or a bigger yield loss, which is why the model should show both side by side.
What the same changes do to break-even
Assume plant overhead, salaries, rent and marketing total $60,000 a month. Treat ingredients, packaging and direct labor as variable.
In the base case, each pack contributes $2.55 – $0.80 – $0.30 – $0.35 = $1.10. Break-even is $60,000 / $1.10, or about 54,500 packs a month.
With both changes, each pack contributes $2.40 – $0.84 – $0.30 – $0.35 = $0.91. Break-even rises to about 65,900 packs. That is roughly 21% more volume with no change in demand.
How the model changes by type of food business
The drivers stay the same. Their weight shifts.
| Business type | Revenue driver | Biggest cost pressure | Biggest cash trap | Build first |
| Packaged food manufacturer | Units by SKU and channel | Ingredients and trade spend | Stock and retailer payment terms | SKU unit economics |
| Frozen and chilled producer | Units by SKU and B2B account | Cold storage and distribution | Stock held in the cold chain | Cold chain costs |
| Restaurant, cafe or fast food | Customers x average check | Food, labor and rent | Build-out and the first months | Opening costs and weekly labor |
| Food truck | Daily sales by location | Fit-out, ingredients, location fees | Truck purchase and repairs | Sales by location |
| Meal kit or subscription | Subscribers x orders a month | Acquisition and fulfillment | Churn and ingredients bought ahead | Retention by cohort |
| Importer and distributor | Order volume x margin | Landed cost and freight | Paying suppliers before customers pay | Landed cost and cash cycle |
Restaurants and food trucks should model prime cost: food cost plus labor cost as a share of sales. Build both from the menu, not from a flat percentage.
Meal kits live on retention. Model cohorts: each month’s new subscribers, and how many remain after one, three and six months.
Importers should build landed cost per unit:
Landed cost = (product cost + freight + insurance + duty + port and clearing + inland transport) / sellable units
Add exchange rates and customs timing. Importers often pay suppliers months before customers pay them.
Mistakes that break food forecasts
- Treating cost of goods as a flat percentage of sales. This hides yield loss, ingredient spikes and promotions.
- Ignoring trade spend until the first retailer negotiation. By then the price list is already printed.
- Skipping working capital for the launch ramp. Stock gets bought months before the first invoice is paid.
- Leaving food safety, cold storage or the packaging line out of capex.
- Forecasting seasonal products by year only. A holiday peak needs monthly columns.
- Running no downside case for the main ingredient. One input can decide a whole product line.
- Leaving duty and exchange rates out of imported costs.
Frequently Asked Questions
How is a restaurant model different from a food manufacturing model?
A restaurant forecasts customers and average check, then tracks food, labor and rent as a share of sales. A manufacturer forecasts units and margin by SKU, then tracks yield, trade spend and inventory. Restaurants hold less stock. Their cash risk sits in the build-out and the first months.
How do you forecast sales for a new food product with no history?
Start from reach. Count the outlets or customers you can realistically serve, the orders each places and a ramp over several months. Check the result against market size. Pilot orders and retailer feedback make the first months far more believable.
How should you model trade spend?
Set a percentage deduction for each channel and enter fixed fees as separate lines. Raise the percentage in a downside case. Read the result as net revenue and margin by channel, not as one blended figure.
What do banks look for in a food business forecast?
Repayment capacity. Lenders read the cash flow, the minimum cash balance and the assumptions behind sales growth. Clear working capital and capex schedules help, because they show where the loan money goes.
Should a food business use a template?
A template works as a starting layout. Generic ones often apply one cost percentage to sales and miss yield, trade spend and shelf life. If a template cannot split margin by SKU and channel, add those tabs before sharing it with a lender.
Build the model before the margin surprises you
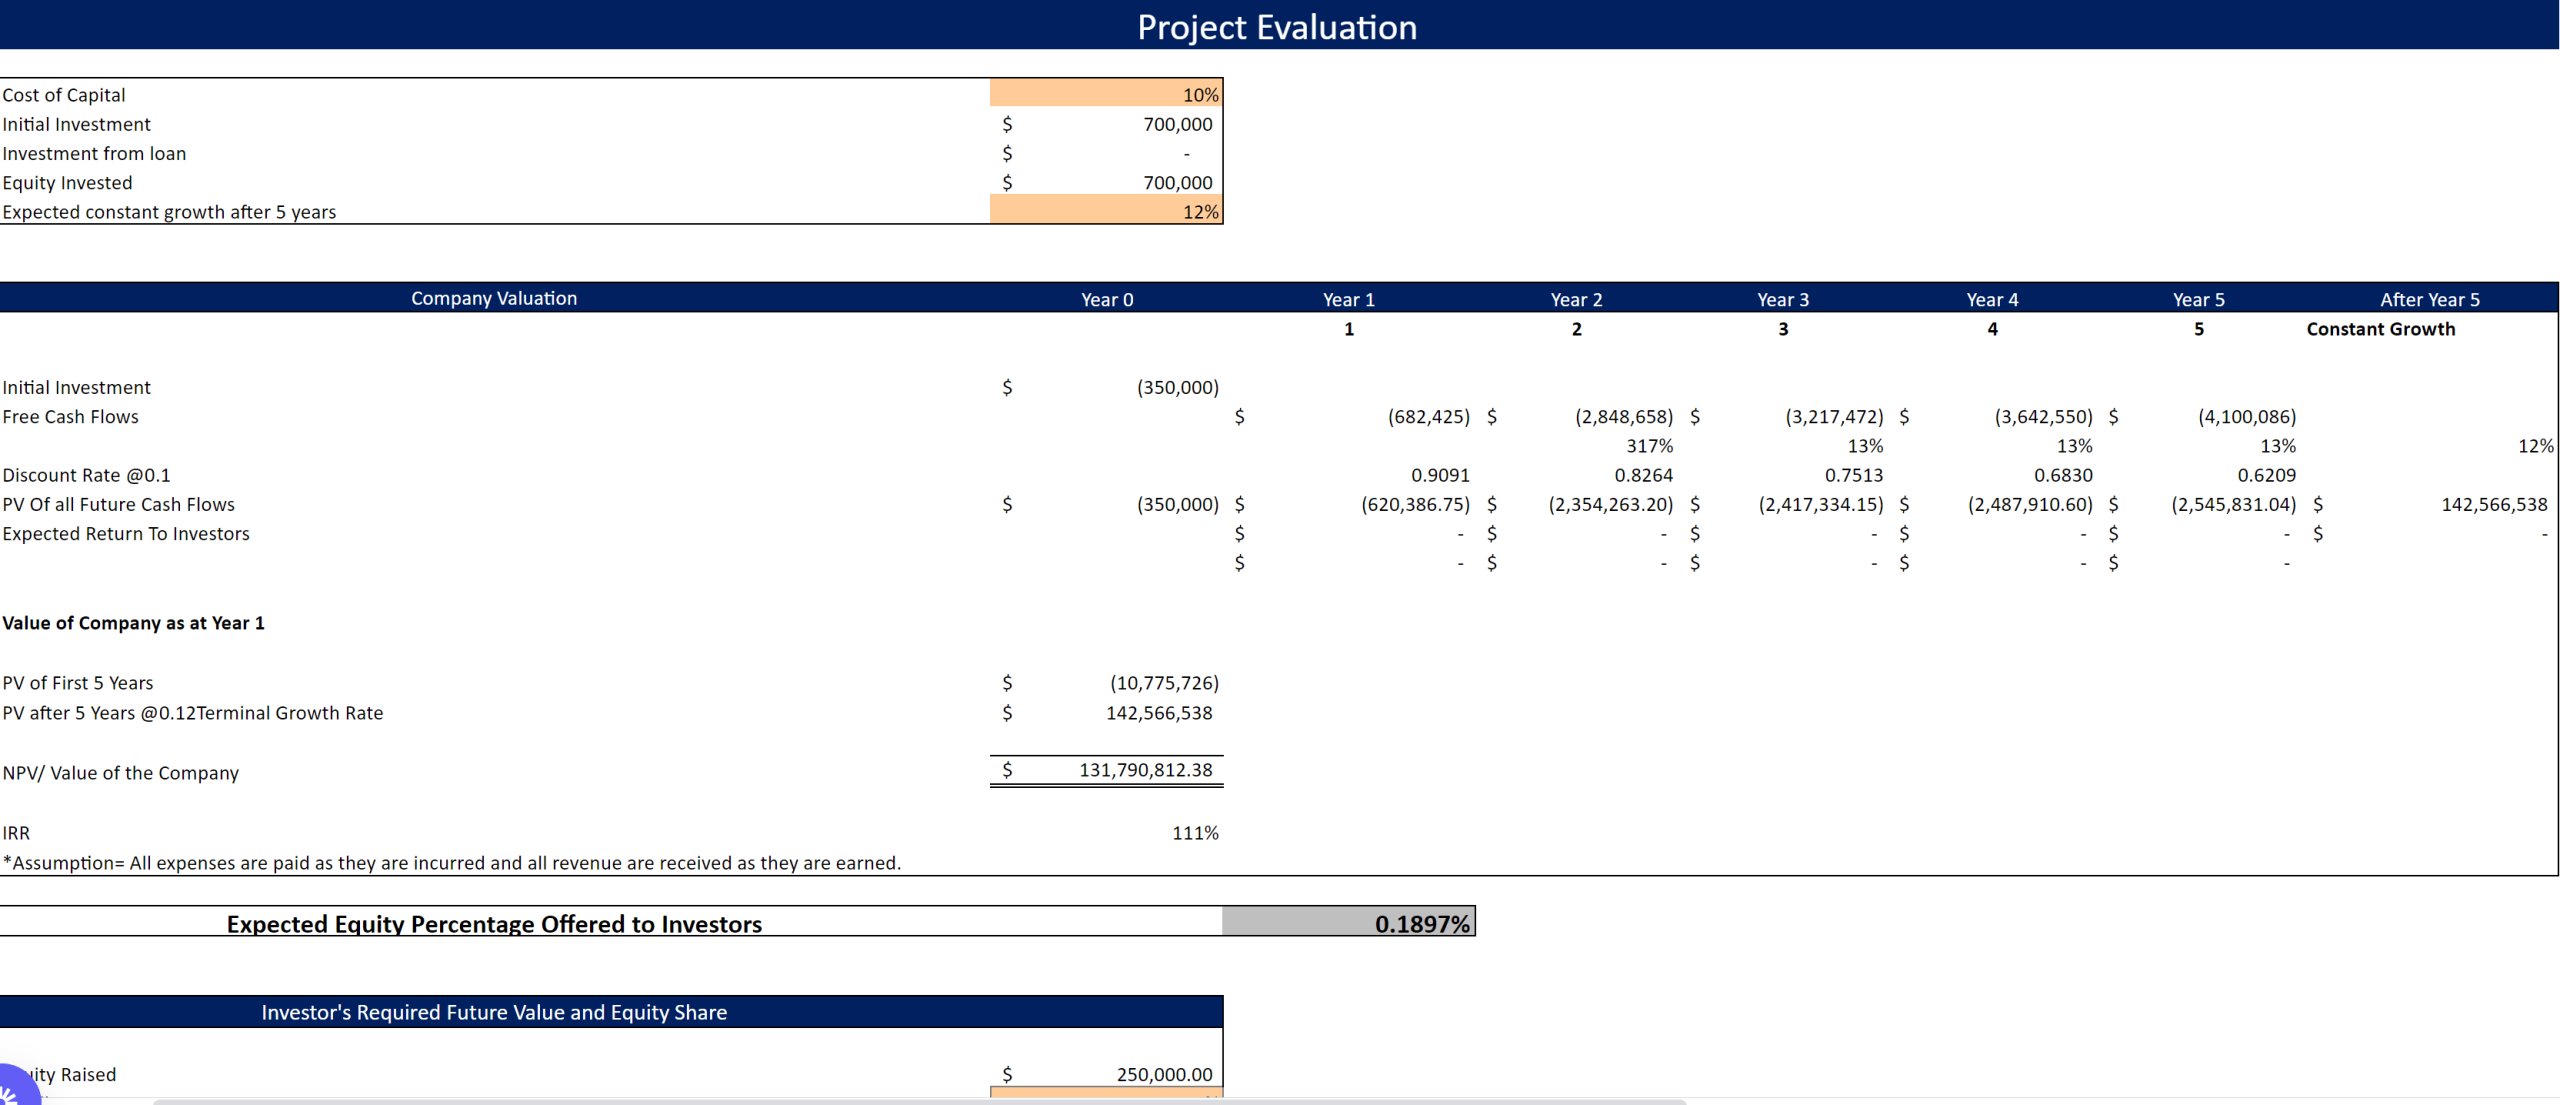
The best test of a food financial model is a hard question answered in a minute. What happens to cash if customers pay 30 days later, or if the main ingredient costs a fifth more? In the example above, a 30-day slip adds $180,000 to the cash a business must carry. A model built on these seven drivers gives that number before the problem arrives.
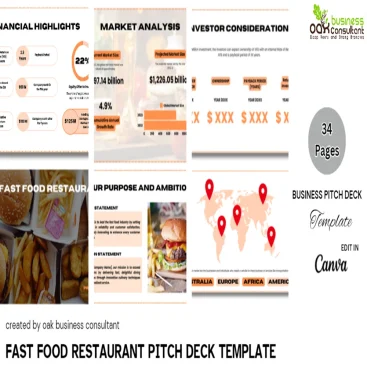
Oak Business Consultant builds food industry financial models in Excel and Google Sheets, from startup plans to multi-channel manufacturers. Explore Oak’s financial modeling services, or start from the Excel financial model templates and adapt them to your recipes, channels and funding plan.