Best Automotive Industry Financial Models
Automotive financial models: costs, margins and break-even for 4 businesses
A car dealer, a repair shop, a parts store and a gas station serve the same driver. They do not make money the same way.
A dealer earns most of its gross profit after the sale, in service and finance. A gas station sells fuel to bring people in. It profits from the coffee and sandwiches. A model that treats these four alike will mislead you on day one.
This guide covers what each model needs, which benchmarks to test against, and which input breaks the forecast first. Figures are mostly US data. Adjust them to your market before you rely on them.
The four models at a glance
| Business | Main profit engine | Typical startup range | Input that breaks the model first |
| Auto parts store | Retail margin on a large inventory | $249K to $696K for a franchise-scale store | Inventory turnover |
| Auto repair shop | Labor hours sold per technician | $50K to $300K+ | Billable hours per technician |
| Car dealer | Used-car gross plus service and finance | Depends on floor plan and lot | Days to sell a used vehicle |
| Gas station | In-store sales, not fuel | Site and tank costs dominate | Card fees and fuel margin |
These are planning ranges, not quotes.
Policy is a scenario, not a fact
Bans on petrol and diesel cars have moved often. They also differ by region. Carry policy in your model as a scenario. The table shows the position at the last check. Confirm each row before you rely on it.
| Region | Position at last check | Why it matters to your model |
| European Union | The Commission proposed replacing the 100% CO2 cut by 2035 with a 90% cut. Plug-in hybrids and range extenders would stay legal. The proposal needs approval. | Repair and parts demand for combustion engines may last longer than planned. |
| United Kingdom | Pure petrol and diesel sales end in 2030. Hybrids are allowed until 2035. All new cars must be zero-emission from 2035. | Dealers face a nearer cliff than EU peers. |
| United States | The $7,500 federal EV credit has ended. EV sales fell soon after. | EV charging forecasts built on early growth rates are now too high. |
Charger economics have shifted too. The 30C charger tax credit has ended. Court rulings have changed the status of the NEVI program that funds public charging. If your gas station model includes chargers, run it with and without grants.
Auto parts store: the inventory model

A parts store lives or dies on stock. The shelves hold the capital. The model must show how fast that capital turns into cash.
A franchise-scale sample shows how the margin stacks up. Revenue was $1.783M. Cost of goods sold was 45%, so gross margin was 55%. Labor took 19%, rent 6%, marketing 3% and other costs 11%. That leaves an EBITDA margin of about 16%. Startup cost in the sample ran from $249K to $696K.
Smaller independents see different numbers. Gross margin runs 40% to 55%. Initial inventory runs $30K to $80K. Break-even takes 18 to 36 months. The wide range is the point. Your forecast should show which end you are on.
Build these lines into the model:
- Opening inventory by category, split into fast movers (filters, brake pads, batteries) and slow movers
- Inventory turnover, so you see when stock ties up cash
- Trade accounts for local garages, which sell at lower margins but in bulk
- Returns and core charges, which many first-time owners forget
- Rent and labor as a share of revenue, since these two usually decide the net result
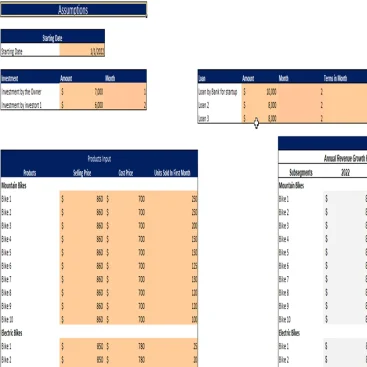
Oak’s auto parts store Excel financial model puts inventory, trade accounts and these cost lines in one workbook.
Auto repair shop: the labor-hours model

A repair shop sells time. Parts add margin. Billable technician hours drive the result.
Franchise data shows a wide spread. Revenue averaged $1.226M. Startup costs ran from $235K to $1.348M. Franchise operating margin sat near 26%.
Independents earn less. Their average net margin is about 6.3%. Well-run shops reach 10% to 20%.
The gross margin split explains why. Labor margin runs 50% to 65%. Parts margin runs 20% to 30%. Overall gross margin is typically 50% to 60%. A shop that sells more labor and fewer parts keeps more of each dollar.
Startup budgets for independents run from $50K to $300K or more. A vehicle lift costs $3K to $8K. Diagnostic scanners cost $3K to $15K. Equipment is only part of the bill. Also budget for lease deposits and working capital.
The model should include:
- Technician count and billable hours per technician per day
- Labor rate, with a separate line for warranty and fleet work
- Parts margin by job type
- Bay capacity, since three bays cannot sell more than three bays of hours
- Comebacks and free rework, which quietly cut the margin
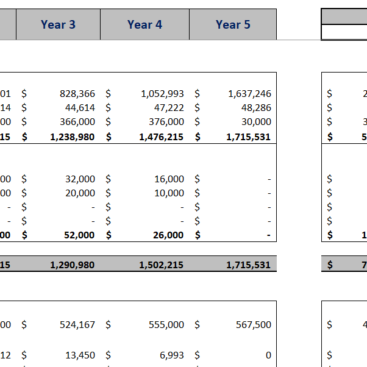
Test the labor assumption first. Say your technicians bill six hours of an eight-hour day. A drop to five hours moves net profit more than a ten percent rise in parts price. Oak’s auto repair Excel financial model lets you vary those hours and see the effect on break-even.
Car dealer: gross profit after the sale

New cars build traffic. The profit sits elsewhere.
Digital Dealer reported quarterly figures for more than 4,000 franchised dealers. Gross profit averaged $1,840 per new vehicle and $1,409 per used vehicle. Finance and insurance added $1,769 per vehicle retailed. Fixed operations, meaning service and parts, produced 52.8% of total gross profit. Publicly traded used-car retailers earned about $1,846 per used unit.
These numbers change how you build the forecast. A model that covers only vehicle sales misses more than half of gross profit. Give service and parts their own revenue and margin lines. Tie them to vehicles sold in earlier years.
Inputs for a dealer model:
- Units sold by new, used and certified pre-owned, with gross profit per unit for each
- Floor plan interest, which grows when a car sits unsold
- Days to sell used inventory
- Finance and insurance income per vehicle retailed
- Service retention, meaning the share of buyers who return for maintenance
- Fixed costs: lot, staff, advertising and software
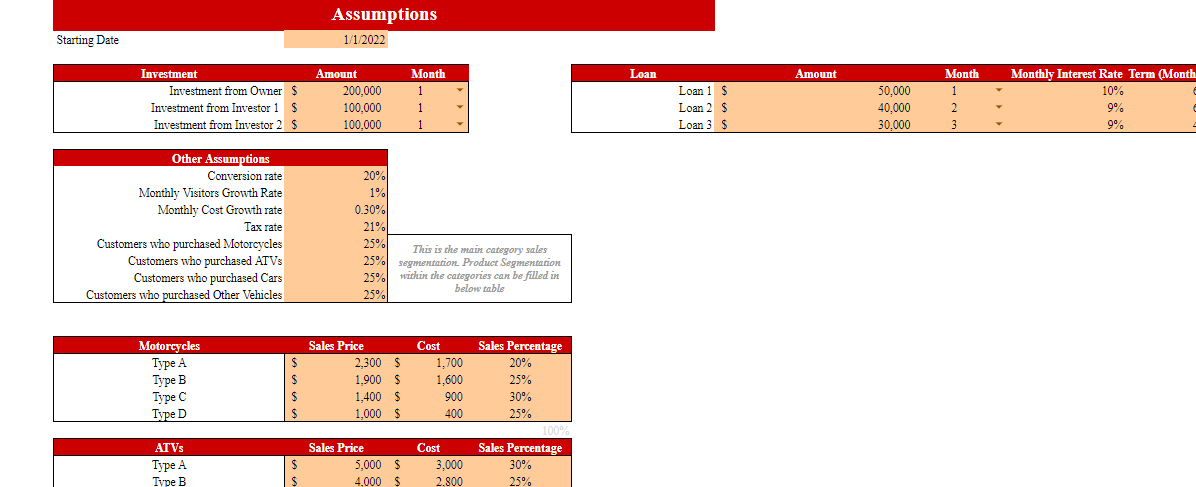
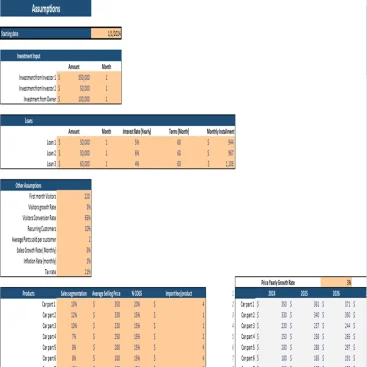
Floor plan interest needs a close look. A used car that sells in 30 days costs far less to carry than one that sits for 90. Oak’s car dealer Excel financial model lets you test that gap.
Gas station: the store pays the bills

The pump brings the customer in. The shelf pays the rent.
NACS publishes annual industry results. Total convenience store sales reached $817.5B. In-store sales were $341.2B, the 23rd straight year of growth. Fuel made up 65.0% of sales but only 38.8% of gross profit. Foodservice was 28.5% of in-store sales and produced 38.9% of in-store gross profit.
A model built on fuel volume alone looks healthy until margin per gallon dips.
Card fees cost the industry $21.3B. They rise with the pump price. When fuel gets more expensive, the station earns the same cents per gallon and pays more in fees.
Labor is a fixed burden too. NACS data shows 122,620 fuel-selling stores. The average store has 19.9 employees. The average wage is $15.04 an hour. Staffing hours are a major cost line, not a footnote.
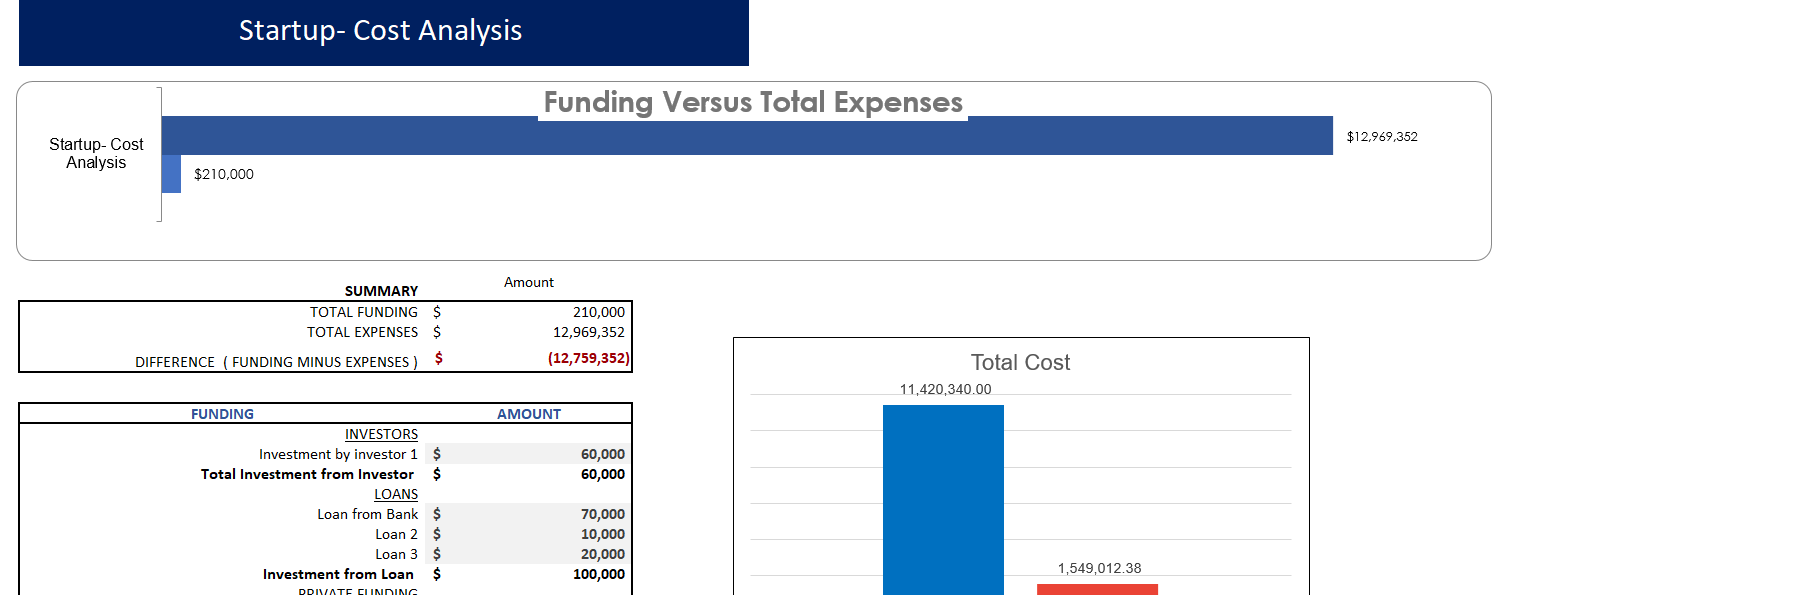
Build the model with four revenue streams: fuel, packaged goods, foodservice, and services such as car wash or money transfer. Then add the cost lines that move with each one. Oak’s oil and gas financial model template covers the inventory, break-even and project evaluation sheets a fuel retailer needs.
Should you add EV charging?
Be careful with the numbers here. McKinsey’s analysis of a four-charger, 150 kW station in California is the clearest public example.
At 15% utilization and $0.45 per kWh, the station earned $265K to $285K in revenue. Without subsidies it still lost about $40K to $50K in EBIT each year.
Break-even needed one of these:
- 20% utilization
- A price of $0.53 per kWh
- About $12K a year in ancillary revenue, such as shop sales from waiting drivers
McKinsey noted that average US utilization at the time was only about 7.5%.
Hardware is not cheap. A DC fast charger runs $45K to $100K or more. Installation adds $40K to $150K or more. NEVI funding can cover up to 80% of project costs where it applies.
Treat charging as its own project inside the model. Make utilization a scenario variable. Do not let it hide inside the fuel line.
The input that breaks each model first
Every model has one assumption that does the most damage when wrong. Find yours before the bank does.
| Business | Fragile input | Test it by asking |
| Auto parts store | Inventory turnover | What happens if stock turns 20% slower? |
| Auto repair shop | Billable hours per technician | What if utilization falls by one hour a day? |
| Car dealer | Days to sell a used car | What does floor plan interest cost at 90 days? |
| Gas station | Fuel margin and card fees | What if margin per gallon drops by two cents? |
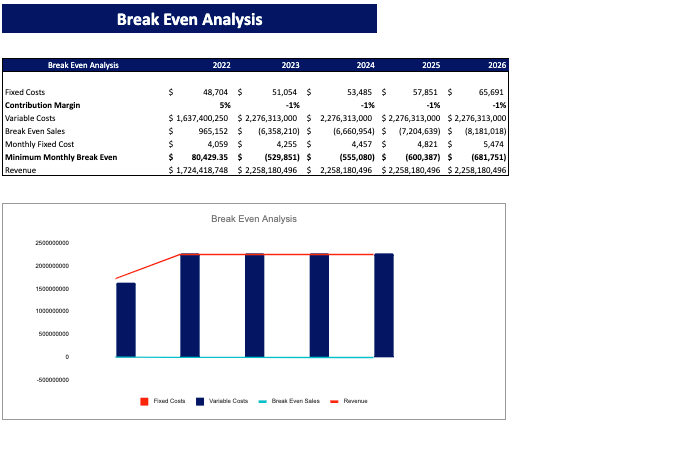
A sensitivity table answers each question in a minute. Oak’s guide to sensitivity analysis in financial modelling shows how to set one up. The model then reports a range of outcomes, not one hopeful number.
Frequently Asked Questions
What is a typical profit margin for an auto repair shop?
Independent shops average a net margin of about 6.3%. Well-run shops reach 10% to 20%. Franchise operating margins sit near 26%. Franchises carry fees and different cost structures, so do not compare them directly.
How much does it cost to open an auto parts store?
Franchise-scale stores ran from $249K to $696K in the sample above. Smaller independents can start with $30K to $80K in opening inventory. They still need rent, fixtures and working capital. Break-even typically takes 18 to 36 months.
Where do car dealers make most of their profit?
In fixed operations and finance. Service and parts produced 52.8% of gross profit in Digital Dealer’s data. Finance and insurance added $1,769 per vehicle retailed. That is more than the gross on a used car.
Do gas stations make money from fuel?
Mostly they do not. Fuel was 65.0% of sales but 38.8% of gross profit, per NACS. The in-store business, especially foodservice, carries the rest. Card fees also eat into fuel revenue.
Is EV charging profitable for a gas station?
Not at low utilization. McKinsey’s California example lost $40K to $50K a year at 15% utilization without subsidies. It broke even at 20% utilization or a price of $0.53 per kWh. Model charging as a separate project with several utilization scenarios.
Which financial statements does an automotive business need?
An income statement, a cash flow forecast and a balance sheet. Link all three to one set of assumptions. Add a break-even analysis and a sensitivity table. Oak’s guide on how to calculate fixed and variable costs covers the cost split behind break-even.
Conclusion
The four businesses share customers but not economics. The benchmark that matters is the one for your own profit engine, tested against your own costs.
Policy also moves faster than most business plans. The EU proposal, the US credit changes and the UK timeline shift demand at different speeds. Build each as a scenario and revisit them every quarter.
Oak Business Consultant prepares investor-ready financial models with scenario and break-even analysis. See the financial modeling services or start with one of the templates above.