TAM SAM SOM: How to Define and Capture Your Market Share?
TAM, SAM, and SOM
Every business needs to understand the market it intends to operate in. A complete grasp of that market shapes how a company prices its product, where it advertises, and how it wins customers away from competitors. Three metrics anchor that understanding: Total Addressable Market (TAM), Serviceable Available Market (SAM), and Serviceable Obtainable Market (SOM). Together they take a business from “how big could this theoretically be” down to “what can we actually go capture this year.”
Understanding TAM (Total Addressable Market)
Total addressable market is the overall revenue opportunity available if a business captured 100% of its target market. It represents the maximum market potential for a product or service, and it forms the foundation for strategic planning and investor conversations alike.
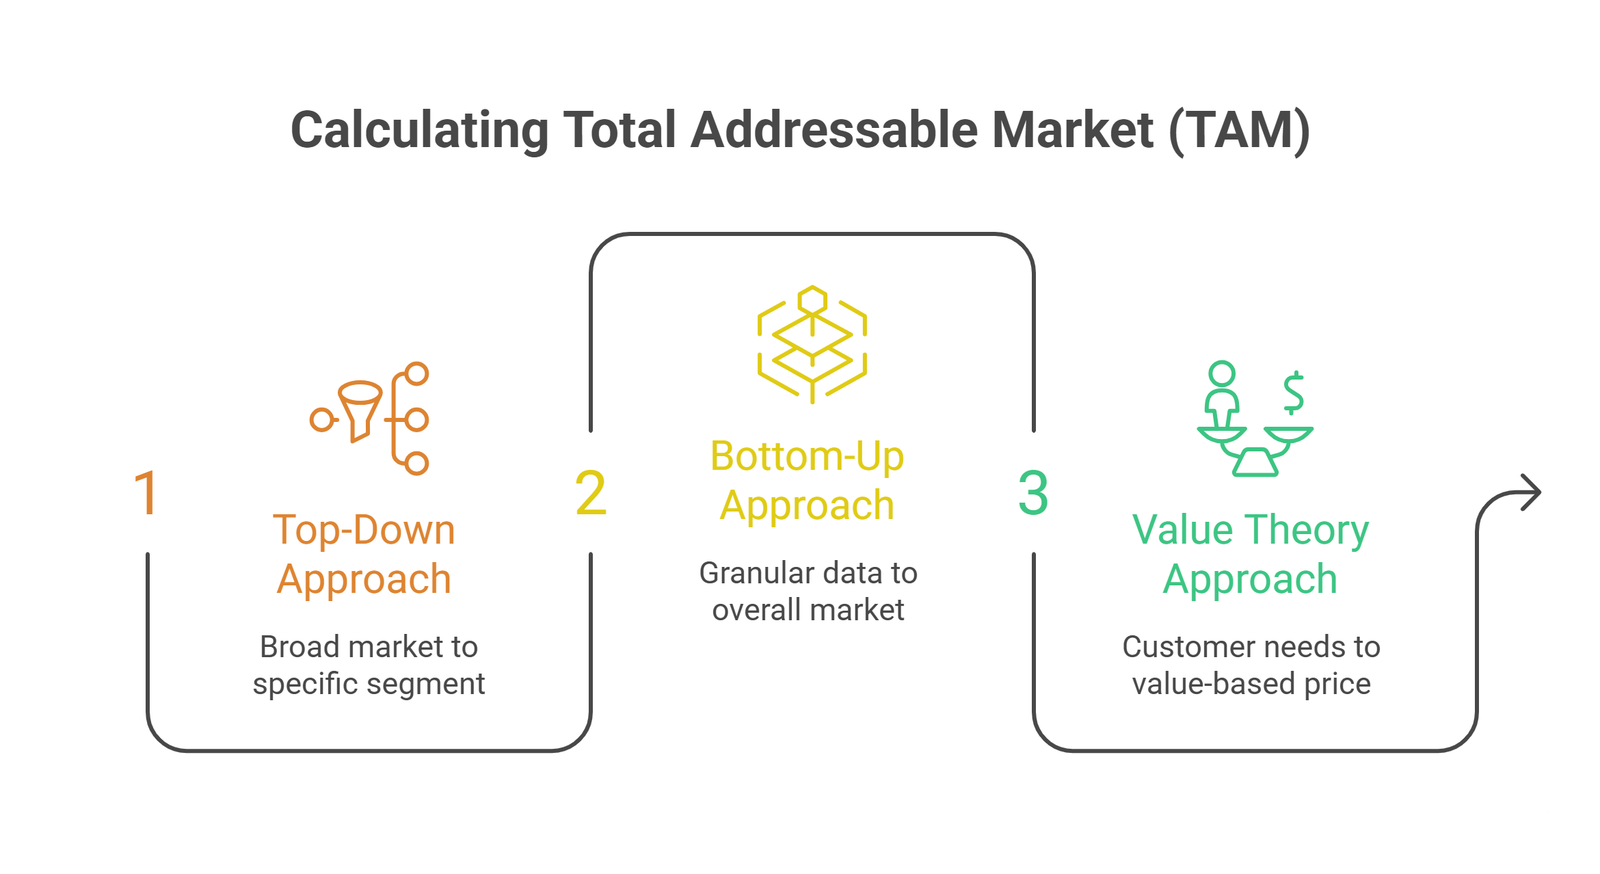
TAM can be calculated using three main methods: the top-down approach, the bottom-up approach, and the value theory approach.
Top-down approach
In the top-down approach, calculation starts with the overall market size and narrows gradually down to a specific location and product target.
- Start with the broad market. Identify the total size of the relevant industry, globally or regionally.
- Segment the market. Break the broad market into segments relevant to the product, based on geography, customer type, industry, or product category.
- Focus on the target segment. Narrow in on the specific segment the product actually serves.
- Estimate the TAM. Multiply the number of potential customers in the target segment by the average revenue per user (ARPU), or the product’s price.
Example: A global software market worth $1 trillion segments down to an accounting software market worth $200 billion, which narrows further to accounting software in North America worth $20 billion. That $20 billion is the TAM, representing the total revenue opportunity if the product captured 100% of that segment.
Bottom-up approach
The bottom-up approach is generally considered more reliable, since it starts at the most granular level and builds up using actual data rather than top-level market reports.
- Identify the core market, the customers who actually use the product, based on existing customer data or fresh market research.
- Determine the number of potential customers within that core market.
- Calculate average revenue per user (ARPU), including subscription fees, average purchase size, or other relevant pricing metrics.
- Multiply potential customers by ARPU to arrive at TAM.
Example: 1 million SMEs in North America, at an ARPU of $500 per year for an accounting software product, gives a TAM of $500 million.
Value theory approach
This approach is most useful when a product sits in a new or largely untapped market, where top-down industry data doesn’t cleanly apply.
- Understand customer needs and willingness to pay through direct research and surveys.
- Estimate the perceived value the product delivers, in dollar terms.
- Determine a value-based price that offers a clear return relative to that perceived value.
- Estimate the number of potential customers who both need the product and can afford the price.
- Multiply value-based price by potential customers to calculate TAM.
Example: An energy-saving industrial device that saves manufacturers $100,000 annually gets priced at $20,000, a 5x return on investment. With 10,000 large industrial manufacturers in the target region, the TAM is $200 million.
Understanding SAM (Serviceable Available Market)
SAM is the portion of TAM that a business’s products or services can realistically target and serve, once geography, demographics, and product fit narrow the picture.
- Identify the ideal customer profile (ICP). Business size, industry, income level, or other relevant characteristics that define who the product is actually built for.
- Do the market research. Gather data on how much of the TAM the ICP actually represents.
Example: If TAM is a $20 billion North American accounting software market, and SMEs represent 25% of that market, SAM is $5 billion.
Understanding SOM (Serviceable Obtainable Market)
SOM is the portion of SAM a business can realistically capture within a given time frame, factoring in competition, market conditions, and the company’s own resources.
- Analyze the competition. Study existing players’ market share and identify gaps the product can fill.
- Evaluate market conditions and trends that could help or hurt growth in the target niche.
- Assess internal capacity. Production capacity, marketing budget, and overall resource allocation all cap how much of the SAM is realistically obtainable.
Example: If SAM is $5 billion and the business can realistically capture 10% of it, SOM is $500 million.
Where to find reliable market data
The formulas above are only as good as the data behind them. For top-down TAM estimates, industry analyst reports from firms like Gartner, Forrester, and IDC, along with government statistics and trade association data, are standard starting points. For bottom-up SAM and SOM figures, the most credible input is a business’s own data: actual customer counts, real conversion rates, and direct customer interviews, rather than assumptions layered on top of industry averages.
A useful pattern for pitch decks specifically is combining both: citing a recognized third-party source for the top-down TAM, then backing the bottom-up SOM with direct evidence like pilot customer data or a documented sales pipeline. Investors tend to trust that combination more than either approach alone.
Common mistakes when calculating TAM, SAM, and SOM
A striking share of startups, by some estimates over 40%, fail because there was never real demand for the product in the first place. Poor TAM, SAM, and SOM calculations are often part of that story. A few mistakes show up repeatedly:
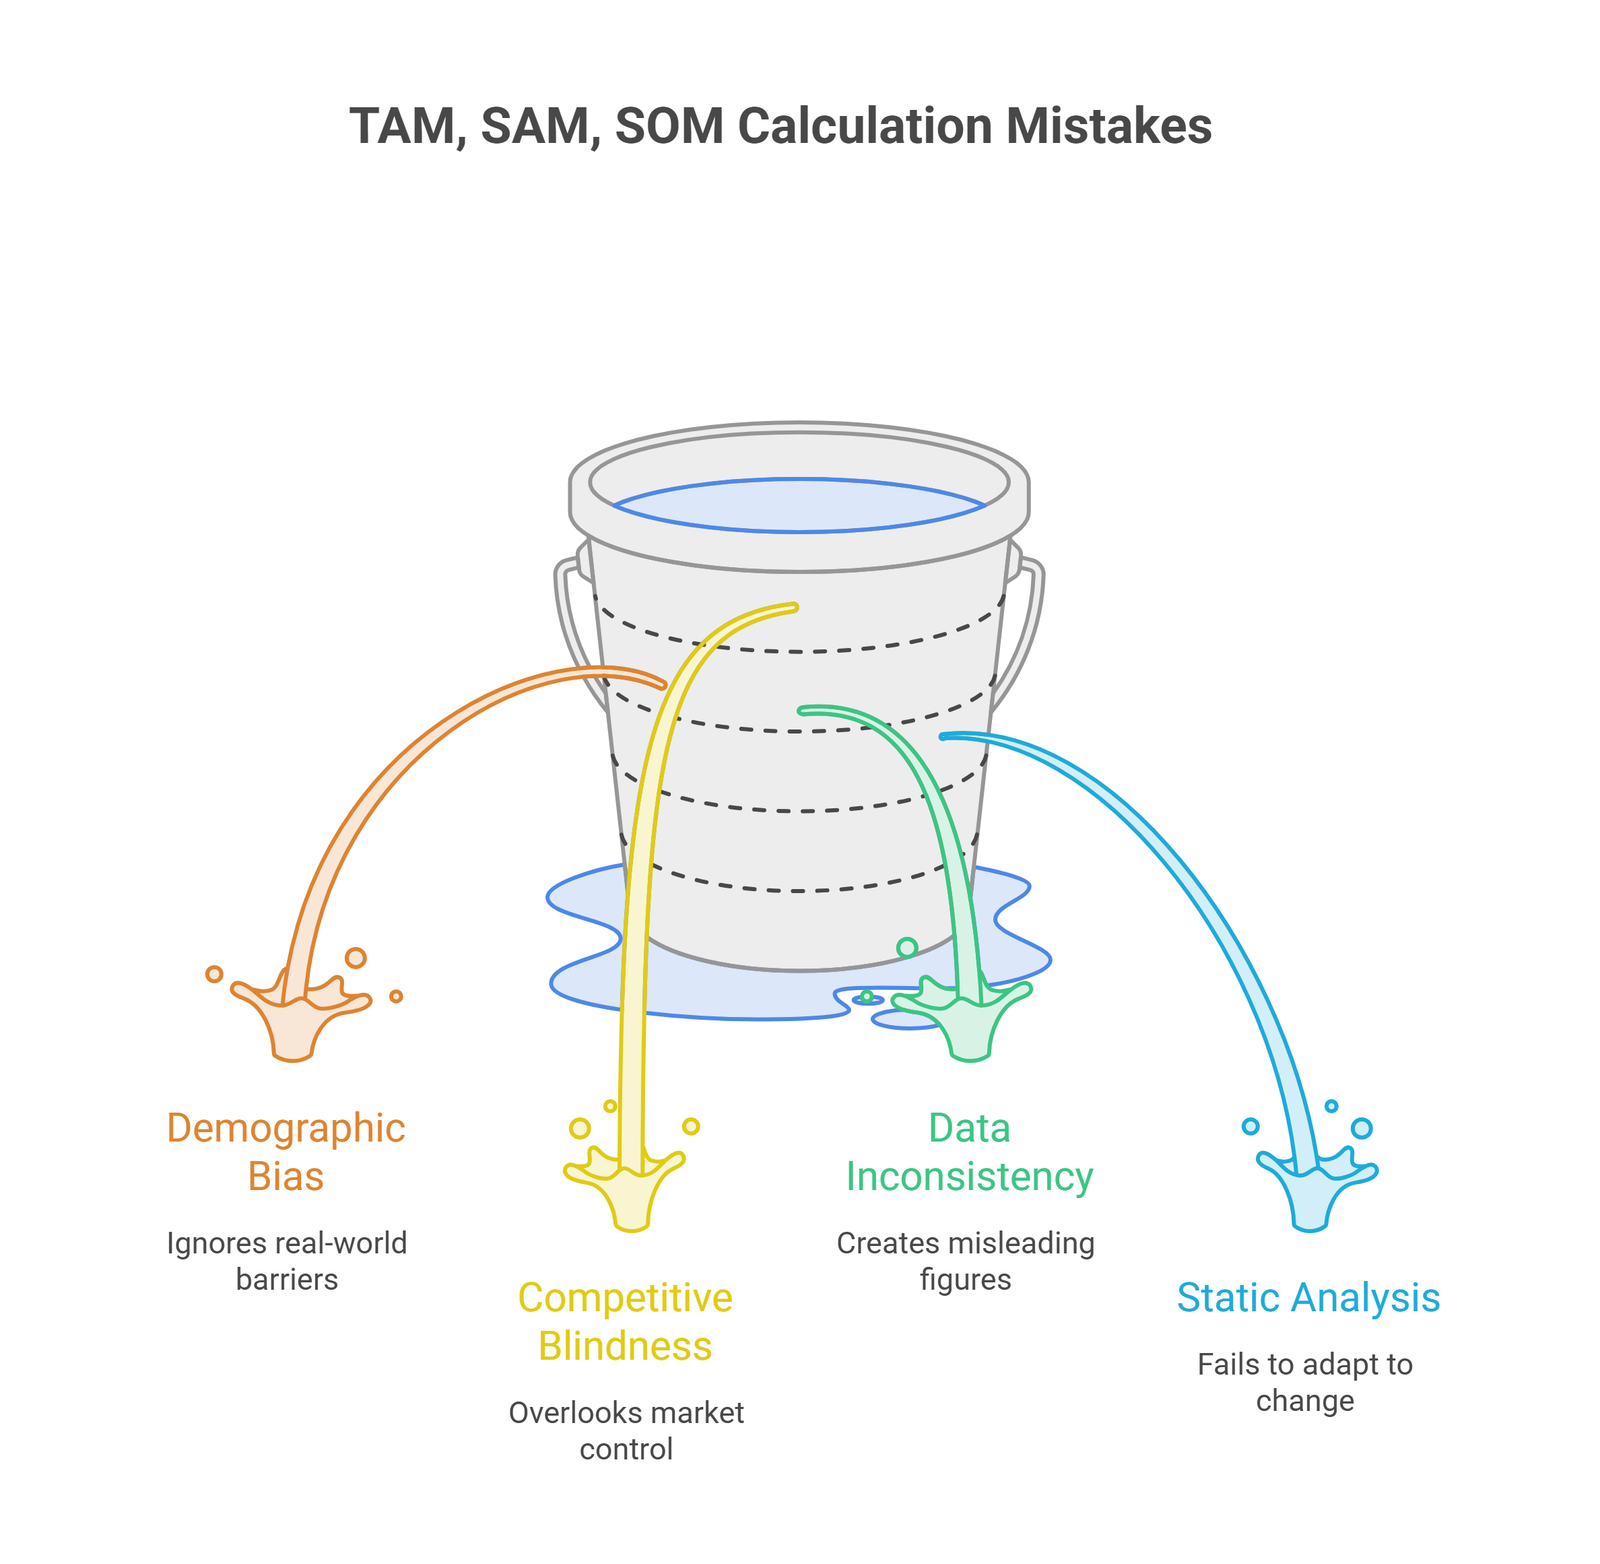
- Building TAM purely on demographics. Counting everyone who could theoretically use a product, without accounting for regulatory barriers, entrenched competitors, or how long a realistic sales cycle actually takes, produces a number that looks impressive and means very little.
- Ignoring competitive concentration. If a handful of players already control most of a market, that reality needs to show up in the SAM and SOM, not get glossed over.
- Mixing data from different years or sources. Combining a TAM figure from a 2024 industry report with current-year customer data creates numbers that don’t actually line up with each other.
- Treating the numbers as a one-time exercise. Markets shift. TAM, SAM, and SOM are worth revisiting at least annually, or whenever a major market change occurs, not just once during initial planning.
Why the TAM-SAM-SOM gap matters to investors
Investors read the relationship between these three numbers, not just the TAM figure alone. In a large, mature market with entrenched competitors, a big TAM paired with a small, hard-won SOM can actually read as a warning sign: high customer acquisition costs and limited realistic upside. In a smaller or emerging market, a narrower TAM with a credible, well-supported SOM often tells a more convincing story, especially when paired with evidence that the underserved segment genuinely exists. The absolute size of TAM matters less than whether the gap between it and SOM makes sense for the specific market being entered.
Example: TAM, SAM, and SOM for a health and fitness app
TAM: The global health and fitness app market is worth $100 billion. That’s the total market size if the app, call it FitTrack Pro, captured every potential customer worldwide.
SAM: FitTrack Pro is built specifically for personalized workout and nutrition tracking in the United States. Market research shows that segment is worth $20 billion, 20% of the global TAM.
SOM: Competitor analysis shows established fitness apps already control 60% of the U.S. market for personalized health solutions, leaving 40% open. After weighing current resources, marketing strategy, and distribution channels, FitTrack Pro can realistically capture 15% of the $20 billion SAM.
Summary:
- TAM: $100 billion (global health and fitness app market)
- SAM: $20 billion (U.S. personalized workout and nutrition segment, 20% of TAM)
- SOM: $3 billion (15% of SAM, the realistically obtainable share)
Quick reference
| Metric | Definition | Example |
| TAM | Total market size if a business captured 100% of its target market | $100 billion global market |
| SAM | The portion of TAM a business can realistically serve, based on geography, demographics, and product fit | $20 billion U.S. segment (20% of TAM) |
| SOM | The portion of SAM a business can realistically capture given competition and current resources | $3 billion (15% of SAM) |
Frequently Asked Questions
What is TAM in business?
TAM stands for Total Addressable Market, the total revenue opportunity available for a product or service if it achieved 100% market share.
How do TAM, SAM, and SOM differ?
TAM is the broad total market. SAM narrows that down to the portion a business can realistically serve. SOM narrows further to the portion a business can realistically capture, given competition and its own resources.
How is SOM calculated?
By estimating the percentage of SAM a business can realistically obtain, based on competitive analysis, market conditions, and internal capacity.
Where should market size data come from?
Top-down TAM figures typically come from analyst firms like Gartner, Forrester, or IDC, along with government and trade association data. Bottom-up SAM and SOM figures are strongest when backed by a business’s own customer data and direct research.
Why is TAM/SAM/SOM important in a pitch deck?
It shows investors both the size of the opportunity and a credible, realistic path to capturing part of it, which matters more to most investors than a large TAM figure on its own.
How often should TAM, SAM, and SOM be recalculated?
At least annually, and whenever a significant market shift occurs. Treating the initial calculation as permanent is one of the more common mistakes businesses make with this framework.
Conclusion
TAM, SAM, and SOM aren’t just numbers for a pitch deck slide. Getting them right, and revisiting them as the market shifts, helps a business target the right segments, set realistic revenue goals, and avoid the common trap of chasing a market that looks big on paper but isn’t actually reachable.
Oak Business Consultant’s market research services help businesses define accurate TAM, SAM, and SOM figures backed by real data, whether the goal is a pitch deck, a growth strategy, or both. Contact us today to get started.