
SDG 9: Industry, Innovation, and 1 in 3 Factories Locked Out of Credit
SDG 9: Industry, Innovation and Infrastructure, and the Research Money That Never Reaches a Factory Floor
A factory worker in Europe or North America adds close to $5,000 in manufacturing value every year. A factory worker in the world’s least developed countries adds about $159. That gap is not closing fast enough to hit 2030.
SDG 9 asks for three things at once: solid infrastructure, real industrialization, and genuine innovation. The world is making progress on all three. It is making that progress unevenly, concentrated in a small group of countries that already lead.
This guide covers what SDG 9 actually asks of the world. It shows where 2026 progress stands, target by target. It also ranks the countries turning factories and R&D budgets into real industrial strength, from strongest to weakest.
What is SDG 9
SDG 9 calls for resilient infrastructure, inclusive industrialization, and stronger innovation systems. That is the UN’s own wording. It is the ninth of 17 Sustainable Development Goals.
All 193 UN member states adopted it in 2015, as part of the 2030 Agenda. The goal links three things that usually get discussed separately: roads and ports, factories and manufacturing jobs, and research spending. A country can build excellent infrastructure and still have almost no industrial base. It can manufacture at scale and still barely invest in R&D. SDG 9 tracks all three together on purpose.
The official targets and indicators behind SDG 9
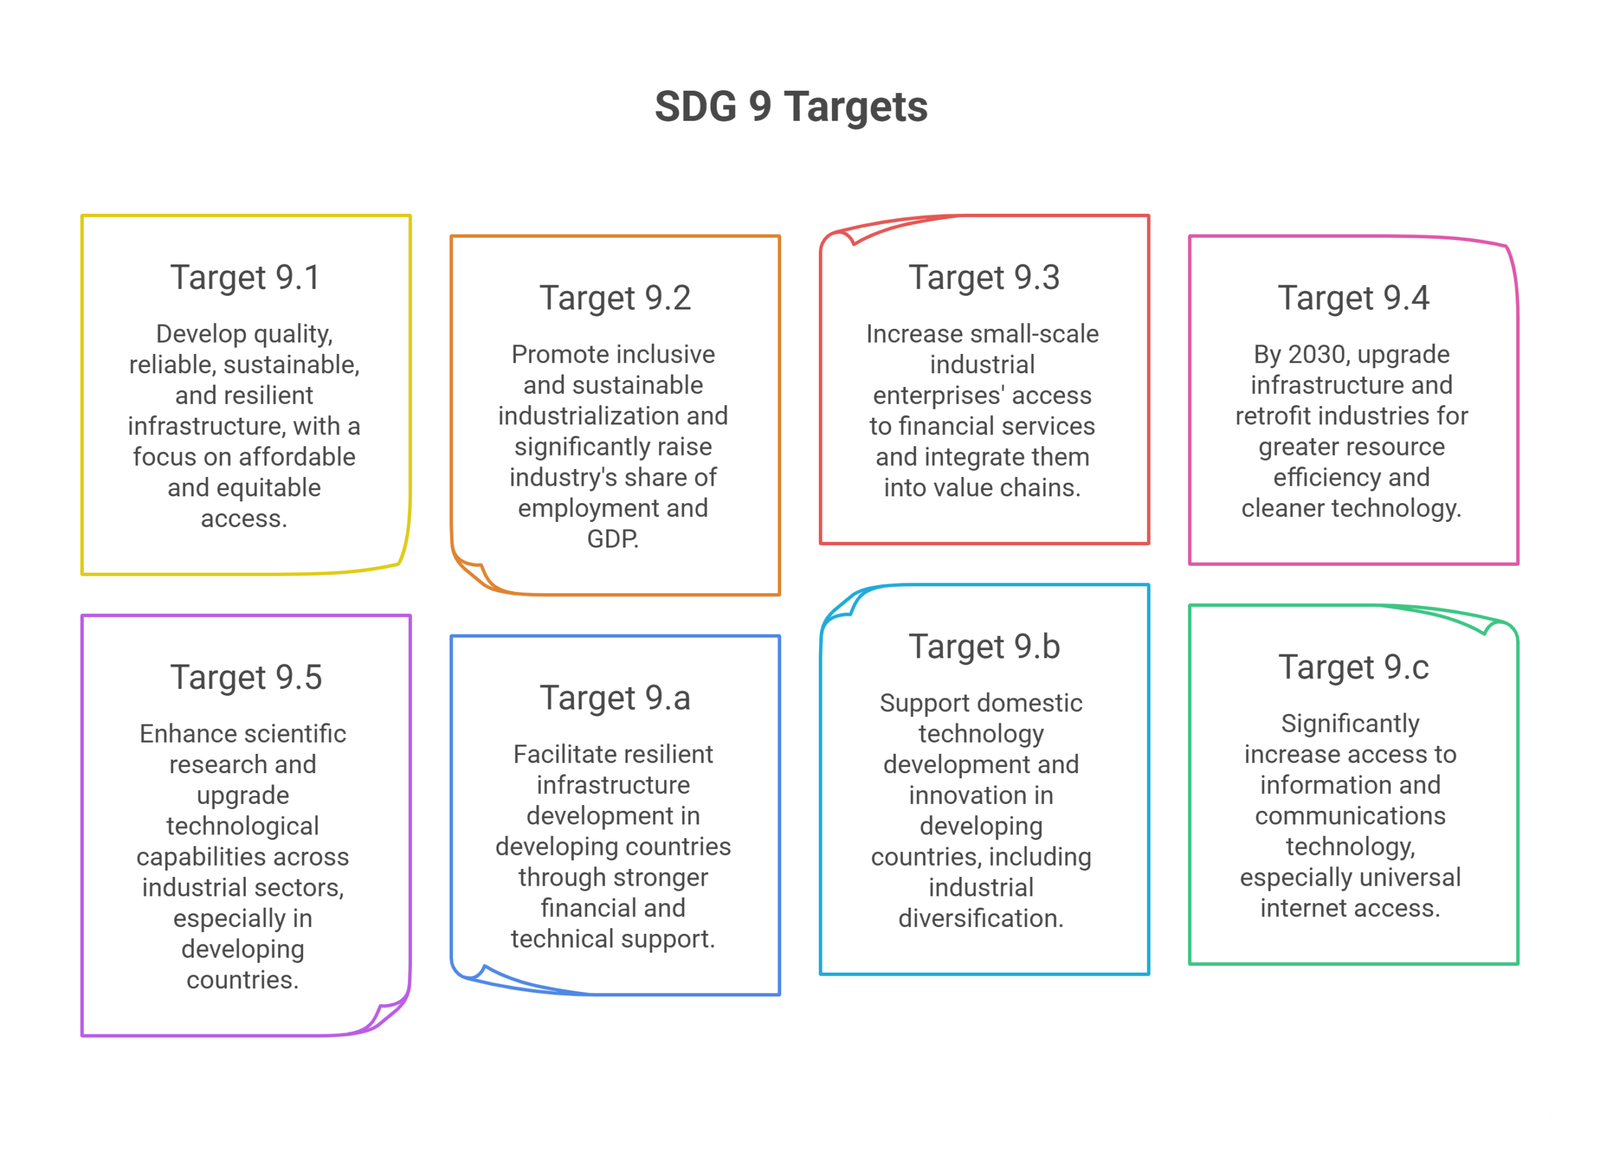
SDG 9 breaks down into 8 targets, tracked through 12 indicators, according to the UN’s SDG 9 page.
Target 9.1: Develop quality, reliable, sustainable, and resilient infrastructure, with a focus on affordable and equitable access. Tracked through rural road access and passenger and freight transport volumes.
Target 9.2: Promote inclusive and sustainable industrialization and significantly raise industry’s share of employment and GDP. Tracked through manufacturing value added and manufacturing employment share.
Target 9.3: Increase small-scale industrial enterprises’ access to financial services and integrate them into value chains. Tracked through small industry’s share of total value added and access to credit.
Target 9.4: By 2030, upgrade infrastructure and retrofit industries for greater resource efficiency and cleaner technology. Tracked through CO2 emissions per unit of value added.
Target 9.5: Enhance scientific research and upgrade technological capabilities across industrial sectors, especially in developing countries. Tracked through R&D spending and researchers per million people.
Target 9.a: Facilitate resilient infrastructure development in developing countries through stronger financial and technical support. Tracked through total official financial flows to infrastructure.
Target 9.b: Support domestic technology development and innovation in developing countries, including industrial diversification. Tracked through the share of medium- and high-tech industry in total value added.
Target 9.c: Significantly increase access to information and communications technology, especially universal internet access. Tracked through mobile network coverage by generation.
Where global progress actually stands
The picture comes from the UN’s 2026 SDG 9 progress update, part of the annual Sustainable Development Goals Report. Global seaborne trade reached 24.1 billion metric tons in 2024, up 15% from 21.0 billion tons in 2015. Trade has stayed near record levels despite geopolitical tension and shipping route disruptions.
Global manufacturing growth strengthened to 3.0% in 2024, after slowing to just 1.6% in 2023. Growth is expected to ease slightly, to 2.7% in 2025. Manufacturing value added per capita rose 18.1% between 2015 and 2024, from $1,656 to $1,921 globally. That average hides a massive gap. Europe and Northern America now sit near $5,000 per capita. The least developed countries sit at roughly $159.
Manufacturing’s share of total employment kept slipping, from 14.3% in 2015 to 13.7% in 2024. Small manufacturers remain financially exposed. Just 32.7% of small manufacturing enterprises worldwide have access to a loan or credit line. Sub-Saharan Africa’s rate is only 19.1%.
R&D spending grew a healthy 4.9% annually between 2015 and 2023. Its share of global GDP rose from 1.71% to 1.92% over that period. Many developing economies still invest under 1% of GDP in R&D. The number of researchers per million people rose from 1,141 to 1,486 globally over the same years. Growth was driven mostly by Eastern and South-Eastern Asia. Women still make up just 31.4% of the global research workforce.
Medium- and high-tech manufacturing reached a record 47.29% share of global manufacturing value added in 2023. Europe and Northern America hit 49.63%. Sub-Saharan Africa sat at just 14.25%.
Connectivity kept expanding too. 5G now covers 55% of the world’s population, per the same UN progress report. High-income countries sit at 84% coverage. Low-income countries sit at just 4%. Roughly 12% of people in the least developed countries still lack any mobile broadband access at all.
CO2 emissions moved the wrong way. Global emissions from fuel combustion and industrial processes hit a record 37.6 gigatons in 2024, a 0.8% rise from 2023. Rising gas and coal use drove the increase. Cleaner energy technology kept the rise smaller than it would have been otherwise.
The table below summarizes where the core SDG 9 indicators stood in the latest reporting.
| Indicator | Latest figure |
| Global seaborne trade | 24.1 billion metric tons (2024), up 15% since 2015 |
| Global manufacturing growth | 3.0% (2024), easing to 2.7% expected in 2025 |
| Manufacturing value added per capita | $1,921 globally (2024); $159 in least developed countries |
| Manufacturing’s share of global employment | 13.7% (2024), down from 14.3% in 2015 |
| Small manufacturers with access to credit | 32.7% globally; 19.1% in sub-Saharan Africa |
| Global R&D spending, share of GDP | 1.92% (2023), up from 1.71% in 2015 |
| Researchers per million people | 1,486 globally (2023), up from 1,141 in 2015 |
| Medium- and high-tech manufacturing share | 47.29% (2023), a record high |
| Global 5G population coverage | 55% (2025); 84% in high-income countries, 4% in low-income |
| Global CO2 emissions from industry and fuel | 37.6 gigatons (2024), a record high |
Source: UN Department of Economic and Social Affairs, SDG 9 progress data, 2026 Sustainable Development Goals Report.
Countries ranked by SDG 9 performance
Ranking countries on manufacturing size alone hides half the story. A country can build huge factories and still barely invest in the research that keeps them competitive. The list below weighs both dimensions together: industrial scale first, research intensity second. It runs from the strongest combined performer down to the weakest.
South Korea leads this list, pairing a massive manufacturing base with the world’s second-highest R&D intensity. China leads on raw scale. Vietnam is the fastest riser, building a real electronics industry from a low base. Germany and the US both combine strength with a real weakness. Germany’s manufacturing base is aging, and the US now under-invests in manufacturing relative to its economy’s size. Israel proves research alone is not industrialization. The UAE and the least developed countries sit at the bottom, for very different reasons.
| Rank | Country | Industrial scale signal | Innovation signal | Standing |
| 1 | South Korea | Manufacturing-heavy economy built on electronics and autos | R&D at 4.94% of GDP (2023), the world’s second-highest | Best combined performer: deep industrial base plus sustained R&D investment |
| 2 | China | $4.7 trillion in manufacturing value added, 28% of the world’s total | R&D climbing to 2.58% of GDP (2023), still rising | World’s largest industrial base, with innovation spending catching up fast |
| 3 | Vietnam | Manufacturing reached 24.43% of GDP in 2024, up sharply | Electronics exports hit $126.5 billion in 2024 | Fastest riser on this list, built almost entirely on export manufacturing |
| 4 | Germany | Manufacturing near 18% of GDP, led by autos and machinery | R&D at 3.15% of GDP (2023), steady for years | Deep, established industrial base with strong but plateaued research spending |
| 5 | United States | $2.9 trillion in manufacturing value added, but only ~10% of GDP | R&D spending of $823 billion (2023), the highest in dollar terms | Massive R&D budget paired with a shrinking manufacturing share of the economy |
| 6 | Israel | Small manufacturing base relative to its economy | R&D at 6.35% of GDP (2023), the world’s highest | Research superpower, but not an industrial one, built on private tech investment |
| 7 | United Arab Emirates | Manufacturing at just 10.85% of GDP (2023), below its own 2025 target | R&D spending under 1.5% of GDP | Wealthy and well-connected, but industrially and technologically thin |
| 8 | Least developed countries | Manufacturing value added of just $159 per capita | As few as 96 researchers per million people in parts of sub-Saharan Africa | Weakest performers on both dimensions, and falling further behind |
South Korea

South Korea combines the two things most countries only manage one of. Manufacturing runs deep across electronics, shipbuilding, and automobiles. R&D spending reached 4.94% of GDP in 2023, according to statbase.org’s compilation of R&D data. Only Israel spends a higher share.
Roughly 79% of that R&D spending comes from the private sector, concentrated in large conglomerates like Samsung, LG, and Hyundai. The government also raised its own 2025 R&D budget to a record $17.9 billion. South Korea shows what sustained, decades-long investment in both factories and research looks like.
China

China’s manufacturing scale has no real rival. The sector added $4.7 trillion in value in 2024. That is roughly 28% of the entire world’s manufacturing output, according to Cargoson’s analysis of global manufacturing data. Manufacturing alone makes up nearly 25% of China’s own GDP, among the highest shares of any major economy.
R&D spending is catching up too. It reached 2.58% of GDP in 2023, up from 2.49% the year before, according to the same statbase.org data set. That is still below the US or South Korea as a share of GDP. China’s total R&D spending is already the second-highest in the world in dollar terms.
Vietnam

Vietnam shows how fast an industrial base can grow from a low starting point. Manufacturing reached 24.43% of GDP in 2024, according to World Bank data. Electronics exports alone hit $126.5 billion that year. That is over a third of the country’s total exports, per Vietnam News reporting on official trade data.
Global manufacturers including Samsung, LG, Foxconn, and Intel have all built major production bases in Vietnam. The government now targets a 30% manufacturing share of GDP by 2030. Vietnam’s growth is real, but it still leans heavily on foreign investment and assembly work rather than homegrown R&D.
Germany and the United States

Germany and the US both illustrate the same tension from opposite directions. Germany’s manufacturing sector still contributes close to 18% of GDP, built on autos, machinery, and chemicals. Its R&D spending held at 3.15% of GDP in 2023, largely unchanged from the year before.
The US tells a more lopsided story. It spent $823.4 billion on R&D in 2023, the highest total in the world. That figure comes from Visual Capitalist’s analysis of OECD data. But manufacturing has shrunk to just over 10% of US GDP, down from 16% in 1997. That makes the US the least manufacturing-reliant economy among the world’s top 10 industrial nations. The figures come from an SSTI review of World Bank data. The research budget is enormous. The industrial base underneath it keeps thinning.
Israel

Israel proves that R&D intensity and industrial scale are genuinely different things. Its R&D spending reached 6.35% of GDP in 2023, the highest rate in the world. About 92% of that spending comes from the private sector.
That investment has built one of the highest concentrations of high-tech startups per capita anywhere. But Israel is a small economy without a large manufacturing base to match its research output. It leads SDG 9’s innovation targets while barely registering on the industrialization ones.
United Arab Emirates

Energy wealth and industrial strength are not the same thing. That pattern shows up across the Gulf on more than one SDG. Manufacturing made up just 10.85% of UAE GDP in 2023, according to World Bank figures reported by Trading Economics. The government targeted 20% by 2020 and 25% by 2025. Neither goal was met.
R&D spending sits under 1.5% of GDP, well below the OECD average. The country has genuine advantages in infrastructure and digital connectivity. Its Operation 300bn strategy aims to double industrial GDP contribution by 2031. For now, the UAE remains far stronger on infrastructure than on the industrialization or innovation sides of SDG 9.
The least developed countries
The least developed countries sit at the bottom of both dimensions at once. Manufacturing value added per capita reached only $159 in 2022. The 2030 target is to double their 2015 baseline of $126. Researchers per million people in sub-Saharan Africa numbered as few as 96. Europe and Northern America averaged more than 4,000.
Small manufacturers face the same financing gap seen worldwide, only worse. Just 19.1% of small manufacturing enterprises in sub-Saharan Africa have access to credit, well below the 32.7% global rate. Closing this gap is the real center of gravity for SDG 9’s remaining years.
What organizations and institutions are doing
Several UN bodies and agencies track and coordinate progress on SDG 9, alongside national governments.
UN Department of Economic and Social Affairs: DESA compiles the annual SDG progress report. It tracks all 12 indicators across infrastructure, industry, and innovation.
United Nations Industrial Development Organization: UNIDO produces the SDG 9 Index and Progress and Outlook assessments. It also runs the Technology Bank for the Least Developed Countries, aimed at closing the innovation gap.
International Telecommunication Union: The ITU tracks mobile network and broadband coverage data. This is the main source behind Target 9.c reporting on global connectivity.
World Bank: The World Bank leads on infrastructure financing data. It co-develops the SDG Atlas visualizations used across official SDG 9 reporting.
How businesses can contribute to SDG 9
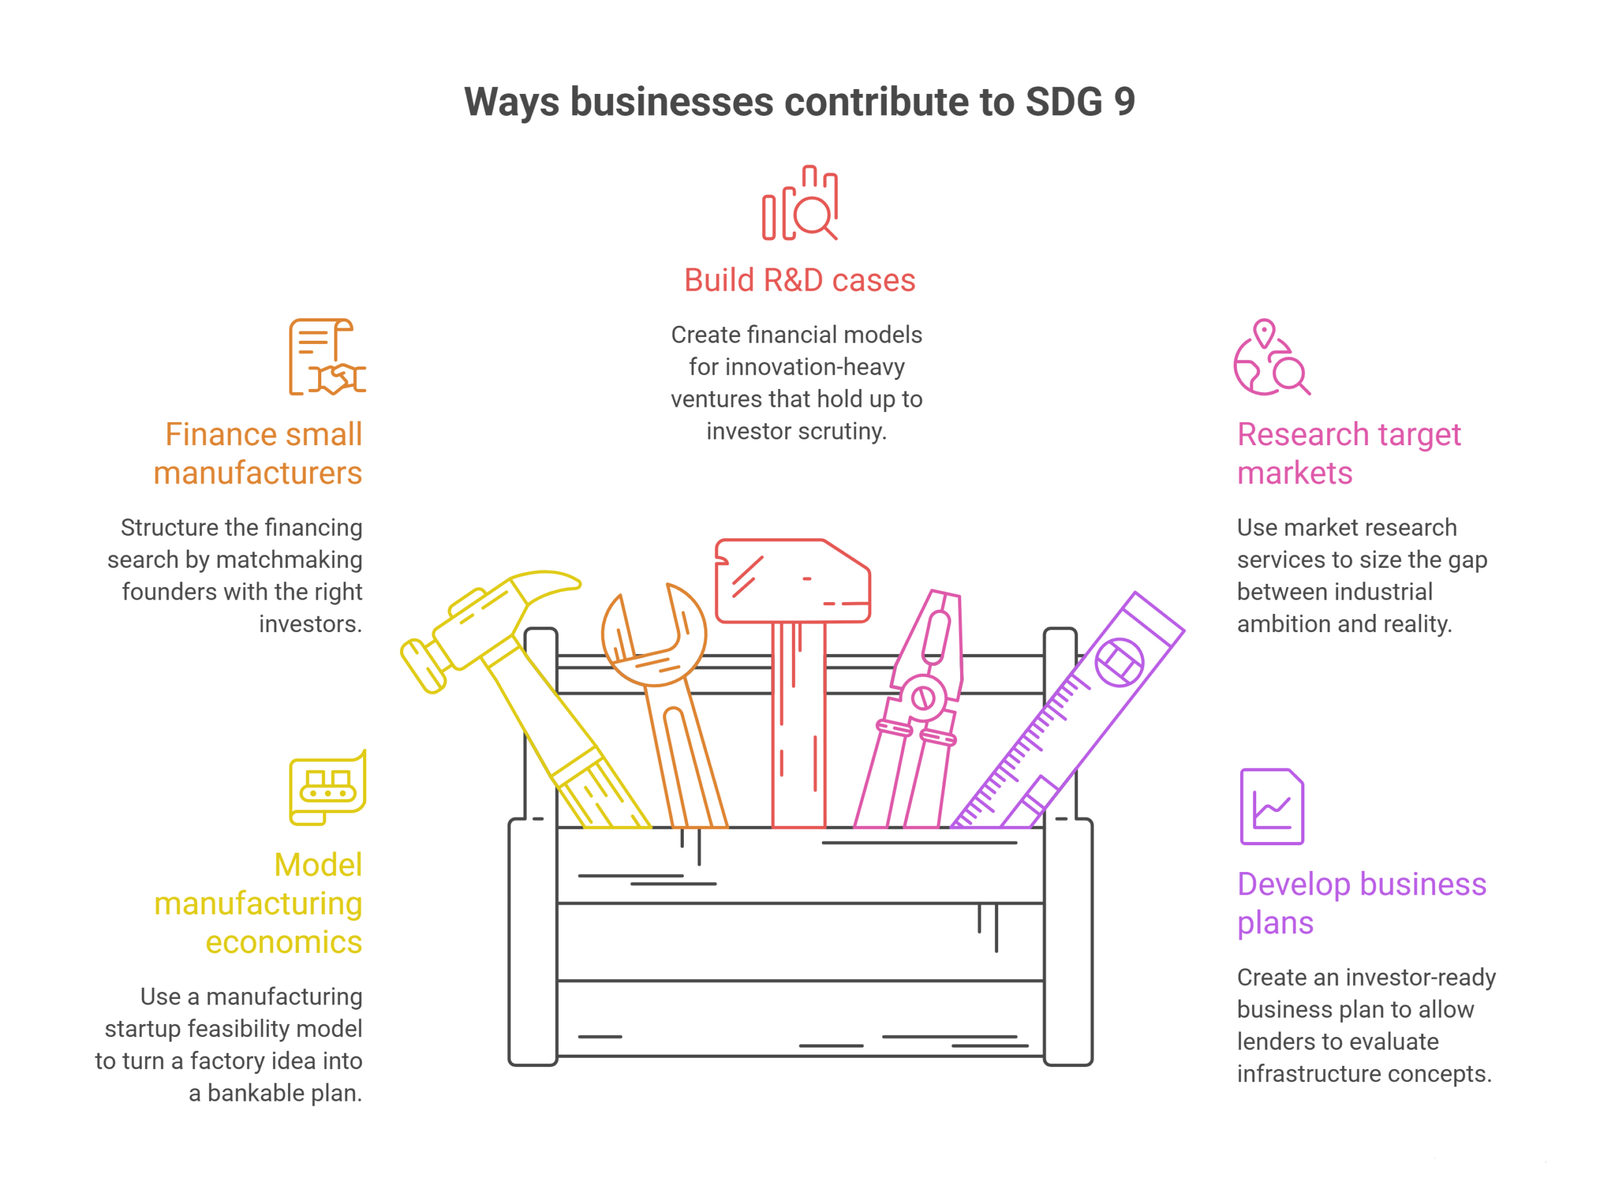
The same approach applies here as with any SDG a company has no formal mandate on. Start with where operations touch infrastructure, production, or R&D. Then look outward from there.
Model manufacturing economics before you build. Target 9.2 is about real industrialization, not just intent. A manufacturing startup feasibility model turns a factory idea into a bankable plan. It sets real cost structures and break-even analysis before capital moves.
Treat small manufacturer financing as a real gap, not an afterthought. Target 9.3 exists because most small industrial firms cannot get credit. Matchmaking founders with the right investors turns that financing search into a structured process, not a guessing game.
Build the R&D case with real numbers. Tech and innovation-heavy ventures need financial models that hold up to investor scrutiny. Oak’s work building a comprehensive model for a fintech startup shows what that kind of R&D-driven business case looks like.
Research target markets before choosing where to build. Vietnam’s rise and the UAE’s stalled manufacturing target both show that industrial ambition and industrial reality can diverge. Market research services can size that gap before capital moves, not after.
Put a real business plan behind infrastructure and industrial ventures. An investor-ready business plan is what turns an infrastructure or manufacturing concept into something lenders and investors can actually evaluate.
Frequently Asked Questions
How many SDG 9 targets and indicators are there?
Eight targets, tracked through 12 indicators. Five targets are numbered outcome targets. Three cover finance, technology transfer, and connectivity.
Is the world on track to meet SDG 9 by 2030?
Partly. Trade, manufacturing value, and R&D spending are all rising. Manufacturing employment, small-firm credit access, and CO2 emissions are all moving the wrong way.
Which countries are performing best on SDG 9?
South Korea combines a deep manufacturing base with the world’s second-highest R&D intensity. China leads on raw industrial scale, and Vietnam is the fastest-rising manufacturer.
Which countries are performing worst on SDG 9?
The least developed countries as a group rank lowest. Manufacturing value added per capita there sits near $159, against almost $5,000 across Europe and Northern America.
Why does the US spend the most on R&D but rank behind China and Germany on manufacturing?
US R&D spending is enormous in dollar terms, but manufacturing has shrunk to about 10% of GDP. Research strength and industrial scale do not always move together.
Is Israel actually a manufacturing powerhouse?
No. Israel leads the world in R&D intensity relative to GDP. Its economy is too small to be a major manufacturing base. It is a research leader, not an industrial one.
Can a business without a manufacturing or R&D mandate still contribute to SDG 9?
Yes. The clearest levers are modeling industrial ventures honestly, widening small manufacturers’ access to capital, and researching markets before committing.
Conclusion
The number worth sitting with is not the 55% of the world now covered by 5G. That figure is real progress. The more telling number is different. It is the nearly $5,000 gap in manufacturing value per worker between the richest and poorest parts of the world. That gap keeps widening even as the world average climbs.
South Korea and China show what deep, sustained investment in both factories and research looks like. Vietnam shows how fast a manufacturing base can grow from almost nothing. Israel and the UAE both show that innovation, industry, and infrastructure do not automatically arrive together, even in wealthy economies.
None of that gets solved by ambition alone. It gets solved by ventures that are modeled honestly and financed properly from the start.
Building the financial case for a manufacturing venture, or sizing up a new industrial market before you enter it? Oak’s financial modeling and market research services can help. Oak builds the numbers behind the industry.