Measure for Success: Early-Stage Startup Metrics
Early-stage startup metrics: the few numbers worth tracking
A founder can lose a quarter to the wrong dashboard. Sign-ups climb, the chart looks great, and cash keeps falling. The problem is rarely too little data. It is too many numbers, and the wrong ones for the company’s stage.
This guide covers which metrics an early-stage startup should track and when. It also gives the formulas, one worked example that ties revenue, unit economics and cash together, and a few habits that keep the numbers honest.
Metrics, KPIs and vanity metrics
A metric is any number that describes what is happening in the business. A KPI is a metric you have chosen to manage because it shows progress toward a goal. Website visits are a metric. Qualified trial sign-ups from search are a KPI, if that is the goal this quarter.
Vanity metrics look good but drive no decision. Total sign-ups is the classic case. Suppose 10,000 people signed up and 900 used the product last month. The cumulative number always rises, so it hides the fact that most people left.
It also helps to separate leading and lagging indicators. Leading indicators, such as activation rate and qualified pipeline, predict what is coming. Lagging indicators, such as revenue and churn, confirm what already happened. Early on, leading indicators matter more because lagging ones arrive too late to change the outcome.
Pick one North Star metric and three to five supporting KPIs
Most early-stage teams do better with one North Star metric than with twenty. The North Star is the single number that best captures the value customers get from the product. For a scheduling tool, it might be weekly active teams. For a marketplace, completed orders.
Around it, add three to five supporting KPIs that directly move it. Anything beyond that dilutes attention. Each KPI should pass one test: if the number changes, does someone know what to do next?
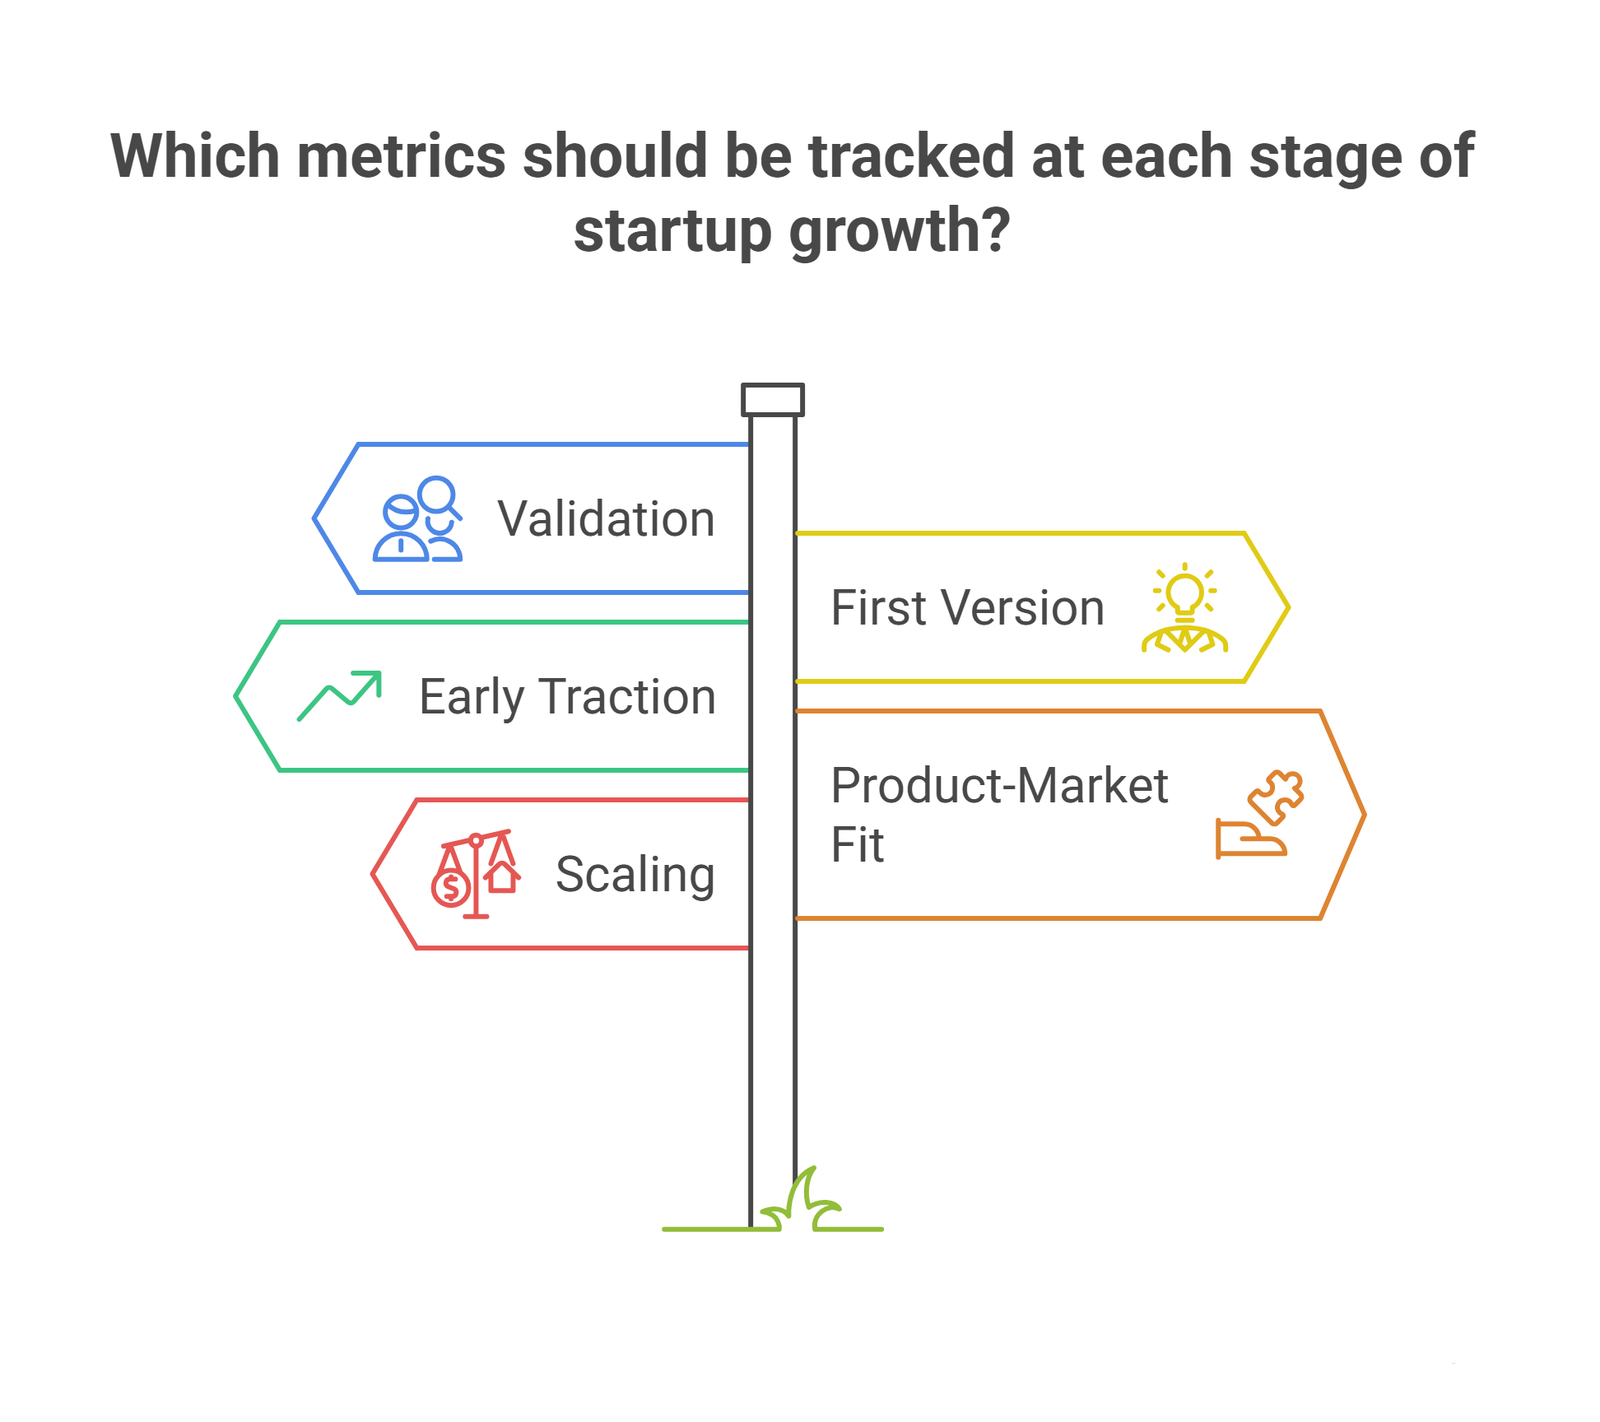
Which metrics to track at each stage
The right numbers change as the company grows. A team validating an idea has nothing to say about churn yet, and a team scaling sales should not still be counting interviews.
| Stage | Main question | Metrics to track |
| Validation, before a product exists | Is the problem real and urgent? | Customer interviews completed, waitlist or landing page conversion, pre-orders or letters of intent, runway |
| First version, first users | Do users reach value quickly? | Activation rate, time to first value, day-7 retention, burn, runway |
| Early traction, first paying customers | Can the company win and keep customers repeatably? | MRR growth, CAC, trial-to-paid conversion, monthly churn, cohort retention, burn, runway |
| Chasing product-market fit | Is the value durable? | Flattening cohort retention curves, net revenue retention, gross margin, LTV to CAC |
| Scaling | Does growth pay for itself? | CAC payback, burn multiple, net revenue retention, customer concentration |
Burn and runway appear at nearly every stage because they set how long the team has to learn.
Revenue and margin metrics
Monthly recurring revenue (MRR) is the predictable revenue subscriptions bring in each month. Annual recurring revenue (ARR) is MRR times twelve. Track MRR growth month over month, and look at new, expansion and lost revenue separately so a good month of sales does not hide a bad month of cancellations.
Recurring revenue is not the same as everything that landed in the bank. One-off consulting or setup fees are real income, but they do not repeat, and investors value them less.
Gross margin is revenue minus the direct cost of delivering the product, divided by revenue. It shows how much of each dollar is left to fund growth. A startup with strong growth and a thin margin can still run out of money faster than expected. A regular financial analysis of your statements helps catch margin problems before they compound.
Acquisition and unit economics
Customer acquisition cost (CAC) is total sales and marketing spend divided by new customers in the same period. Include salaries, tools, agency fees and creative costs, not just ad spend. Break it down by channel, because one channel usually costs far less than another.
Lifetime value (LTV) estimates the gross profit one customer produces over the relationship. A simple version is average monthly revenue per account, times gross margin, divided by monthly churn. Compare it with CAC. A common rule of thumb is an LTV to CAC ratio of 3 to 1 or better. At 1 to 1, the business earns nothing on each new customer once delivery costs are counted.
Treat LTV with caution in the first year. With few long-term customers, the estimate rests on guesses about how long people will stay. CAC payback is the sturdier early measure. It is CAC divided by monthly gross profit per account, and it shows how many months it takes to earn the acquisition cost back.
Retention and engagement metrics
Customer churn is the share of customers lost in a period, divided by the customers at the start of that period. Revenue churn does the same with dollars. Compare the two. If revenue churn is far higher, the biggest accounts are leaving, which is a more serious problem than losing small starter accounts.
Retention by cohort is more useful than a blended average. Group customers by the month they joined, then watch how many remain over time. A curve that flattens means a core group keeps getting value. A curve that keeps falling means the product has not found its fit.
Activation rate is the share of new users who complete the action that proves they saw value, such as connecting an account or sending a first invoice. Define that action carefully. A sign-up with no further use is not activation.
Net revenue retention (NRR) adds expansion to the picture. Above 100% means existing customers grow faster than they leave. It matters most once the product has paying customers on upgrade paths.
Cash metrics: burn, runway and burn multiple
Gross burn is total monthly cash spending. Net burn is gross burn minus the cash that came in. Runway is the cash balance divided by net burn, and it gives the months left at the current pace.
Runway is a snapshot. It shifts whenever spending or sales change, and it ignores deals still in the pipeline. For a forecast the board can trust, model expected spending and revenue month by month. Oak’s cash flow template for SaaS is a starting point for that work.
Burn multiple is net burn divided by net new ARR. It shows how much cash the company spends to add one dollar of recurring revenue. A rising burn multiple means growth is getting more expensive.
A worked example: reading the numbers together
Here is one hypothetical SaaS startup in a single month. Every figure is assumed for illustration.
| Metric | Formula | Result |
| MRR | 200 customers x $100 average monthly revenue | $20,000 |
| Gross margin | Assumed | 80% |
| CAC | $18,000 sales and marketing spend / 24 new customers | $750 |
| Monthly customer churn | 6 customers lost / 200 at start | 3% |
| LTV | $100 x 80% / 3% | about $2,667 |
| LTV to CAC | $2,667 / $750 | about 3.6 to 1 |
| CAC payback | 750/(100 x 80%) | about 9.4 months |
| Net burn | $52,000 cash out minus $20,000 cash in | $32,000 |
| Runway | $240,000 cash / $32,000 net burn | 7.5 months |
| Burn multiple | $32,000 net burn / $21,600 net new ARR | about 1.5 |
Net new ARR here is 18 net new customers (24 gained minus 6 lost) times $100 a month times twelve.
Read individually, the unit economics look healthy. Read together with cash, the picture changes. The company earns back its acquisition cost in under ten months, yet it has only seven and a half months of cash. The next step is a financing plan or a spending cut, and the metrics show that early enough to act. A financial model in Excel lets a team flex churn, CAC and spending to see which lever buys the most runway.
If the business is not SaaS
The same logic applies with different inputs. An e-commerce store has no subscriptions, so churn means customers who fail to buy again within a set window, such as 90 or 120 days. Its lifetime value comes from average order value, repeat purchases and how long buyers stay. A services firm watches gross margin per project and how much revenue comes from its largest client. A marketplace tracks both sides, such as buyers and sellers, plus how many listings turn into completed orders.
Start from the same question in each case: does the business earn back what it spends to win a customer, and does it have the cash to get there?
How to keep metrics honest
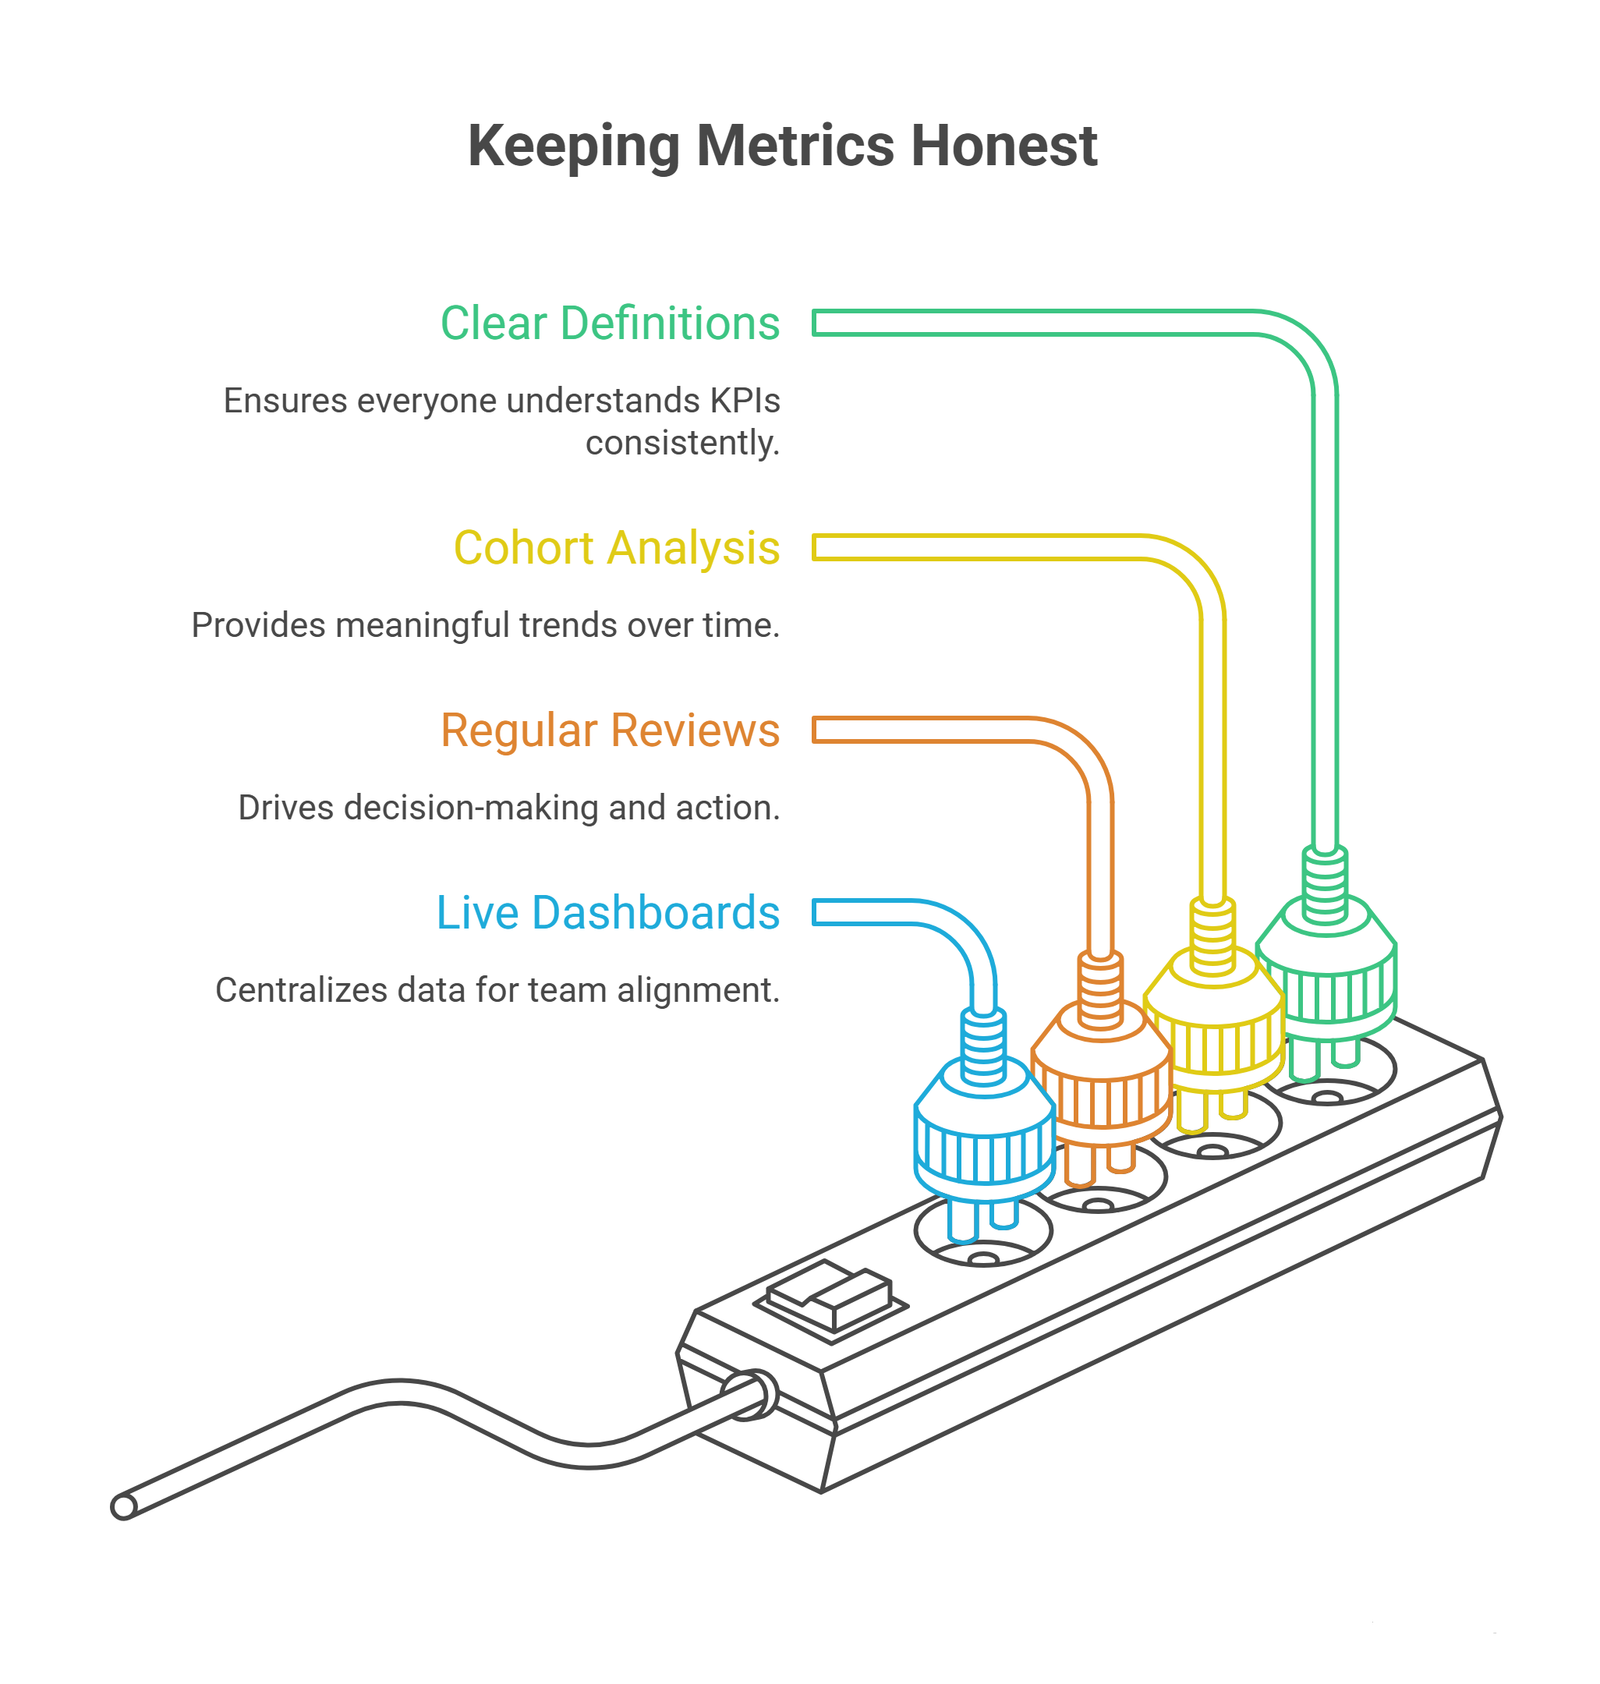
Numbers only help if everyone means the same thing by them. Three habits do most of the work:
- Write a definition for each KPI once: the formula, the data source, who owns it and how often it is reviewed. If two people define activation differently, the trend line is meaningless.
- Use cohorts and periods, not running totals. Monthly sign-ups and cohort retention show direction. Cumulative counts always rise.
- Set a review rhythm. Weekly works for activation and pipeline, and monthly for churn, CAC and cash. A review that leads to no decision is reporting, not management.
A live financial metrics KPI dashboard keeps the small set of numbers in one place, so the team looks at the same figures. Oak’s fintech startup case study shows a dashboard that tracks MRR, burn, runway, churn, CAC and lifetime value side by side.
What investors ask to see
Investors usually start with revenue growth, CAC, LTV, retention, burn and runway. They also ask for cohort data, because it is harder to flatter than an average. Recurring revenue draws more interest than one-off services income, since it is more predictable.
Early on, investors do not expect mature numbers. They expect the founders to know their numbers, define them consistently and explain what they will do about the weak ones.
Common mistakes
- Tracking metrics that belong to a later stage, such as expansion revenue before the first paying customers
- Leaving salaries and tools out of CAC
- Counting sign-ups as activation
- Trusting LTV before there is real retention data
- Checking dashboards daily but reviewing decisions never
- Copying benchmarks from companies with a different model or stage
Frequently Asked Questions
How many metrics should a startup track?
Most early-stage teams should track one North Star metric and three to five supporting KPIs. More than that spreads attention thin. Keep extra numbers as diagnostics that explain why a KPI moved, and review them only when a KPI changes.
What is a good LTV to CAC ratio?
A common rule of thumb is 3 to 1 or better. At 1 to 1, the business makes no profit on new customers after delivery costs. Treat the ratio with caution in the first year, because LTV relies on estimates of how long customers stay.
What is the difference between burn rate and runway?
Burn rate is how much cash the company spends each month, usually measured net of incoming cash. Runway is how many months the cash balance lasts at that burn rate. Runway equals cash divided by net burn.
What is the difference between a metric and a KPI?
A metric is any measurable number. A KPI is a metric you have chosen to manage because it reflects progress toward a specific goal. All KPIs are metrics, but most metrics are not KPIs.
Which metrics do investors want to see?
Investors typically look at MRR or revenue growth, CAC, LTV, retention, burn and runway. They also ask for cohort retention, since it shows whether customers stay. Recurring revenue is usually valued above one-off income.
How often should a startup review its metrics?
Weekly for fast-moving numbers such as activation and pipeline, and monthly for churn, CAC, gross margin and cash. Set the review time in advance and end each review with one decision or experiment.
Conclusion
Tracking fewer numbers is harder than tracking more, because it forces a founder to say what the business is trying to prove right now. The best sign that a metric belongs on the dashboard is that a change in it would alter what the team does next week. Anything else can wait until the company reaches the stage where it matters.
Oak Business Consultant builds startup financial models that forecast cash flow, revenue, expenses and profitability, and track metrics such as MRR and customer acquisition cost. They suit founders who need investor-ready numbers or a clear view of runway. Schedule a free consultation with Oak to set up the metrics your stage calls for.