KPI for Entertainment Industry: The Guide to Measuring What Actually Matters
Best Entertainment Industry Financial Metrics
If you work in entertainment, you already know the industry runs on gut instinct as much as data. But in a sector where a single film can cost $200 million to produce and a streaming show can be cancelled after one season, gut instinct alone is not a strategy. Understanding the right kpi for entertainment industry contexts is what separates companies that grow deliberately from those that lurch from project to project and hope things work out. This guide covers every major metric you need, why it matters, how to calculate it, and what good performance actually looks like across film, television, music, gaming, sports, and live events.
Why KPIs Are Different in Entertainment
Most industries can borrow a standard KPI framework from a textbook and get reasonably far. Entertainment cannot. The reasons are structural.
First, revenue is unpredictable and lumpy. A film studio might generate almost no revenue for 18 months during production, then collect hundreds of millions in a matter of weeks at the box office. A music label might see 80% of its annual streaming income come from catalog titles that are decades old. A game studio might generate nothing for three years, then launch a title that earns a billion dollars in its first month.
Second, costs are notoriously hard to pin down. Production budgets have above-the-line costs (cast, directors, writers) and below-the-line costs (crew, equipment, locations, post-production) that do not always appear on a single balance sheet. Marketing and distribution costs are often treated separately but can rival the production budget itself.
Third, success in entertainment is partly cultural. A critically acclaimed album that generates modest streaming revenue may still be enormously valuable as a brand asset. A blockbuster sequel that earns $800 million globally might still be considered a financial disappointment if its budget and marketing spend were excessive.
This is exactly why defining the right kpi for entertainment industry use cases matters so much. The metrics need to reflect both the financial reality and the creative economics of each sector.
The Current State of the Entertainment Industry
Before diving into metrics, it helps to understand the terrain. The global entertainment and media market is expected to surpass $3 trillion by 2028, driven primarily by digital content, gaming, and streaming. Several trends are reshaping how companies measure performance.
Streaming maturity. The explosive subscriber growth phase is largely over for major SVOD platforms. Services that once measured success purely by subscriber additions are now tracking profitability, retention, and average revenue per user. The shift from growth metrics to efficiency metrics is one of the defining strategic pivots of the mid-2020s.
The live entertainment comeback. Concert touring, sports, and theater are performing exceptionally well. Live Nation reported record revenue figures in recent years, and sports rights valuations continue to climb. The in-person experience has proven it cannot be fully replaced by digital alternatives, which has given venue operators and promoters strong leverage.
Gaming as the dominant entertainment category. By revenue, gaming now exceeds film and music combined. Mobile gaming, in-app purchases, battle passes, and esports viewership have created entirely new KPI categories that simply did not exist 15 years ago.
AI-driven production. Artificial intelligence is beginning to compress production timelines and reduce costs in areas like visual effects, sound design, localization, and script development. This will eventually change cost-based KPIs significantly as benchmarks shift.
Understanding this landscape is the starting point for any serious kpi for entertainment industry analysis.
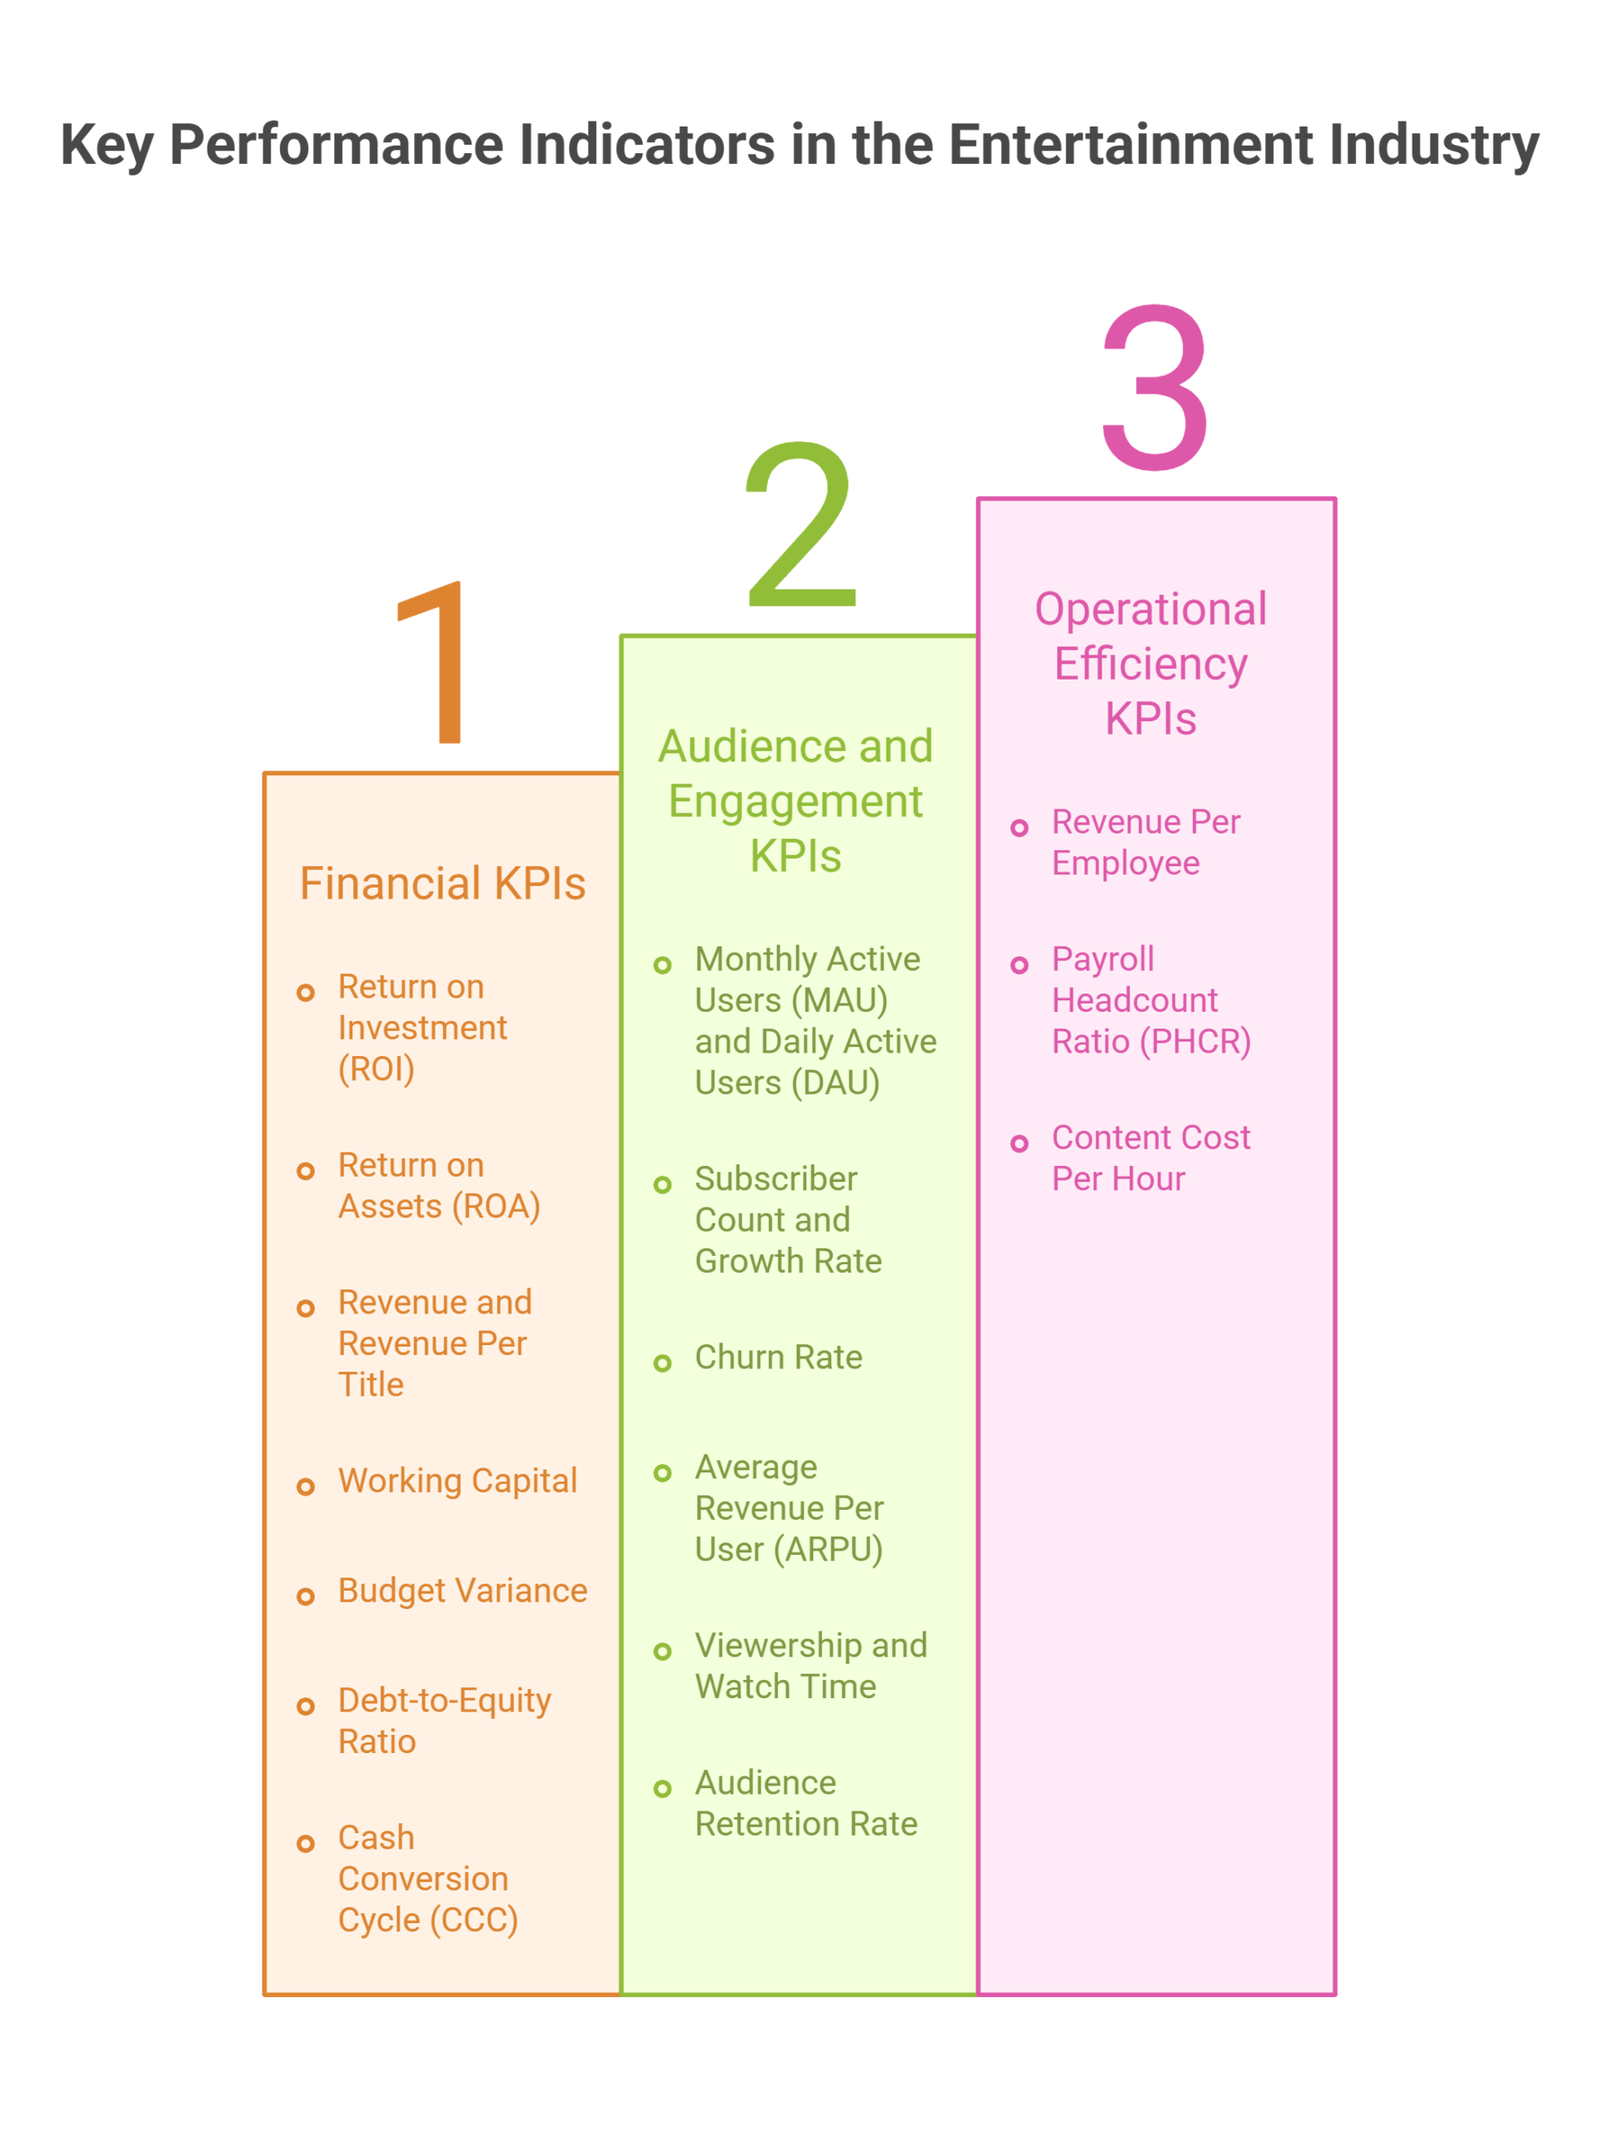
Financial KPIs
1. Return on Investment (ROI)
ROI is the foundational financial metric in any industry, but it gets genuinely complicated in entertainment. The basic formula is straightforward:
ROI = (Net Profit / Total Investment) x 100
The challenge is defining “total investment” accurately. For a film, this needs to include production costs, marketing and prints and advertising (P&A) spend, distribution fees, and any residuals or profit participations. Studios that calculate ROI without accounting for P&A tend to dramatically overstate their returns.
A useful adjustment many studios now make is calculating ROI across the full revenue lifecycle of a property: theatrical, home video, streaming rights, international licensing, merchandise, and sequel value. A film that looks like a modest theatrical performer can be highly profitable when all revenue windows are included.
What to aim for: ROI varies widely by segment. Theatrical releases typically need to earn 2x to 2.5x their combined production and marketing budget just to break even at the box office (due to exhibitor splits). A 15 to 25% ROI on a fully loaded basis across all windows is considered healthy for studio productions. Independent films can target higher ROI with lower budgets, though the revenue ceiling is also lower.
2. Return on Assets (ROA)
ROA measures how efficiently a company generates profit from its asset base.
ROA = Net Income / Total Assets
In entertainment, assets include intellectual property, content libraries, studios, technology infrastructure, and brand equity. For streaming companies, the content library is the primary asset, and a low ROA on that library signals that content spending is not generating sufficient subscriber value.
ROA becomes particularly important when evaluating music labels and studios with large back catalogs. A company sitting on a valuable but undermonetized catalog has a structural ROA problem that is actually an opportunity.
3. Revenue and Revenue Per Title
Revenue is still the most basic measure of commercial activity, but aggregated revenue numbers hide more than they reveal. Break revenue down by:
- Revenue per title (how much did each film, series, or album generate?)
- Revenue by window (theatrical vs. streaming vs. physical vs. licensing)
- Revenue by geography (domestic vs. international)
- Revenue by format (subscription vs. ad-supported vs. transactional)
This granularity is what separates strategic financial management from mere bookkeeping.
4. Working Capital
It measures whether a company has enough liquidity to fund day-to-day operations.
Working Capital = Current Assets – Current Liabilities
In entertainment, working capital requirements vary significantly by sector. A film production company typically needs three to six months of operational expenses held in reserve because production timelines are long, costs are front-loaded, and revenue arrives late. A television network operates closer to a subscription model and can get by with three months of revenue coverage. A music touring operation needs enough capital to fund venue deposits, crew, and equipment well before ticket revenue flows in.
A consistent working capital deficit is one of the earliest warning signs that an entertainment company is overleveraged or underpricing its services.
5. Budget Variance
It tells you how far off your financial plan you are at any given point in a project.
Budget Variance = Actual Cost – Budgeted Cost
Positive variance means you are over budget. Negative variance means you are under. In entertainment, budget overruns are common enough that they are almost expected, but the degree matters enormously. Productions that consistently run 10% or more over budget signal a systemic planning problem, not just bad luck.
Tracking budget variance at the line-item level (cast, crew, locations, post-production, marketing) is more valuable than tracking it in aggregate. It tells you where your estimates are consistently wrong and allows you to build more accurate projections over time.
6. Debt-to-Equity Ratio
This ratio compares a company’s total liabilities to its shareholder equity.
Debt-to-Equity Ratio = Total Liabilities / Total Shareholders’ Equity
Entertainment companies frequently carry substantial debt to fund content development. Netflix famously operated with a negative free cash flow for years while building its content library, funded by debt markets. This is not inherently problematic, but it requires careful management. A high debt-to-equity ratio makes a company vulnerable to interest rate changes and revenue shortfalls.
For entertainment companies, a debt-to-equity ratio above 2.0 warrants close scrutiny. Above 3.0 suggests the company is significantly leveraged and dependent on continued revenue growth to service its obligations.
7. Cash Conversion Cycle (CCC)
The CCC measures how quickly a company converts its operational investments into cash.
CCC = Days Inventory Outstanding (DIO) + Days Sales Outstanding (DSO) – Days Payables Outstanding (DPO)
In entertainment, this metric looks a bit different from manufacturing because the “inventory” is content rather than physical goods. But the principle applies: how long does it take from the moment you start spending on a production to the moment you start collecting revenue?
A streaming platform with a short CCC (meaning it begins generating subscription revenue quickly after content launches) is in a healthier cash position than a studio waiting 12 to 18 months for a film to move through its theatrical window before collecting streaming rights income.
Audience and Engagement KPIs
Financial metrics tell you what happened. Audience metrics tell you why it happened and what is likely to happen next. For most entertainment businesses, audience data is actually more predictive of future financial performance than last quarter’s income statement.
8. Monthly Active Users (MAU) and Daily Active Users (DAU)
For streaming platforms and gaming companies, MAU and DAU are core health metrics. The DAU/MAU ratio (sometimes called the “stickiness ratio”) is particularly revealing: divide daily active users by monthly active users and multiply by 100.
Stickiness Ratio = (DAU / MAU) x 100
A stickiness ratio above 20% is considered good for most apps. Gaming platforms often target 40% or higher. If your platform has 10 million monthly users but only 500,000 log in on any given day, you have a serious engagement problem regardless of what your subscriber count looks like.
9. Subscriber Count and Growth Rate
Subscriber count is the headline metric for subscription-based entertainment businesses, but raw subscriber numbers without context are almost meaningless. What matters more is the rate of growth, the mix of new versus returning subscribers, and whether growth is coming from organic channels or paid acquisition.
Monthly Subscriber Growth Rate = ((New Subscribers – Churned Subscribers) / Starting Subscribers) x 100
Track this monthly and segment it by geography, content tier, and acquisition channel.
10. Churn Rate
Churn rate is arguably more important than subscriber growth for mature streaming services. It measures the percentage of subscribers who cancel within a given period.
Monthly Churn Rate = (Subscribers Lost in Period / Subscribers at Start of Period) x 100
Industry benchmarks for streaming churn typically range from 2% to 6% per month for established platforms. A churn rate above 6% indicates that subscribers are not finding enough value to stay, which is almost always a content library problem. The US streaming market has seen churn rates climb significantly as consumers become more selective about which subscriptions they maintain simultaneously.
11. Average Revenue Per User (ARPU)
ARPU translates your subscriber base into a revenue-per-customer view.
ARPU = Total Revenue / Total Active Users
For advertising-supported tiers, ARPU reflects both subscription fees and ad revenue. For premium tiers, it reflects subscription fees plus any upsells or add-ons. Rising ARPU alongside stable or growing subscribers is the strongest financial signal in subscription entertainment.
12. Viewership and Watch Time
For TV networks, streaming services, and video platforms, total viewing hours is a more honest engagement metric than unique viewers alone. A user who watches 40 hours of content per month is far more valuable to the business than one who watches 4 hours, even though both count as one subscriber.
Netflix introduced total viewing hours as a public metric for this reason: it reflects actual consumption rather than just account activations.
13. Audience Retention Rate
For individual pieces of content, audience retention measures what percentage of viewers who start watching continue through to the end. High-retention content is more likely to generate word-of-mouth, drive new subscriber sign-ups, and justify renewal decisions.
Retention Rate = (Viewers Who Completed Content / Total Who Started) x 100
For streaming, a completion rate above 70% is considered strong for episodic content. For feature films, reaching 80% completion is generally a positive signal.
Operational Efficiency KPIs
14. Revenue Per Employee
It helps you benchmark how productive your workforce is relative to the revenue the company generates.
Revenue Per Employee = Total Revenue / Total Number of Employees
Entertainment companies vary enormously on this metric. A lean digital music distributor might generate $1 million or more per employee. A full-service film studio with large production and distribution teams might sit closer to $200,000 to $400,000 per employee. Trending upward over time is the goal; a declining revenue-per-employee ratio suggests your headcount is growing faster than your revenue.
15. Payroll Headcount Ratio (PHCR)
The PHCR measures how much of the company’s total operating cost goes to payroll.
PHCR = Total Payroll Cost / Total Number of Employees
Entertainment is a labor-intensive industry. Actors, directors, musicians, writers, developers, and support staff all command significant compensation. A high PHCR relative to revenue is not automatically a problem if that talent is generating proportionate value, but it does mean the business has limited flexibility to cut costs in a downturn without making painful workforce decisions.
16. Content Cost Per Hour
For streaming platforms specifically, this metric divides total content spending by the total hours of content added to the library.
Content Cost Per Hour = Total Content Spend / Total Hours of Content Added
This helps compare the efficiency of different content strategies. An original drama series that costs $10 million per hour and generates 50 million viewing hours is outperforming a documentary series that costs $3 million per hour but generates only 5 million viewing hours, even though the documentary looks cheaper on the surface.
Sector-Specific KPIs
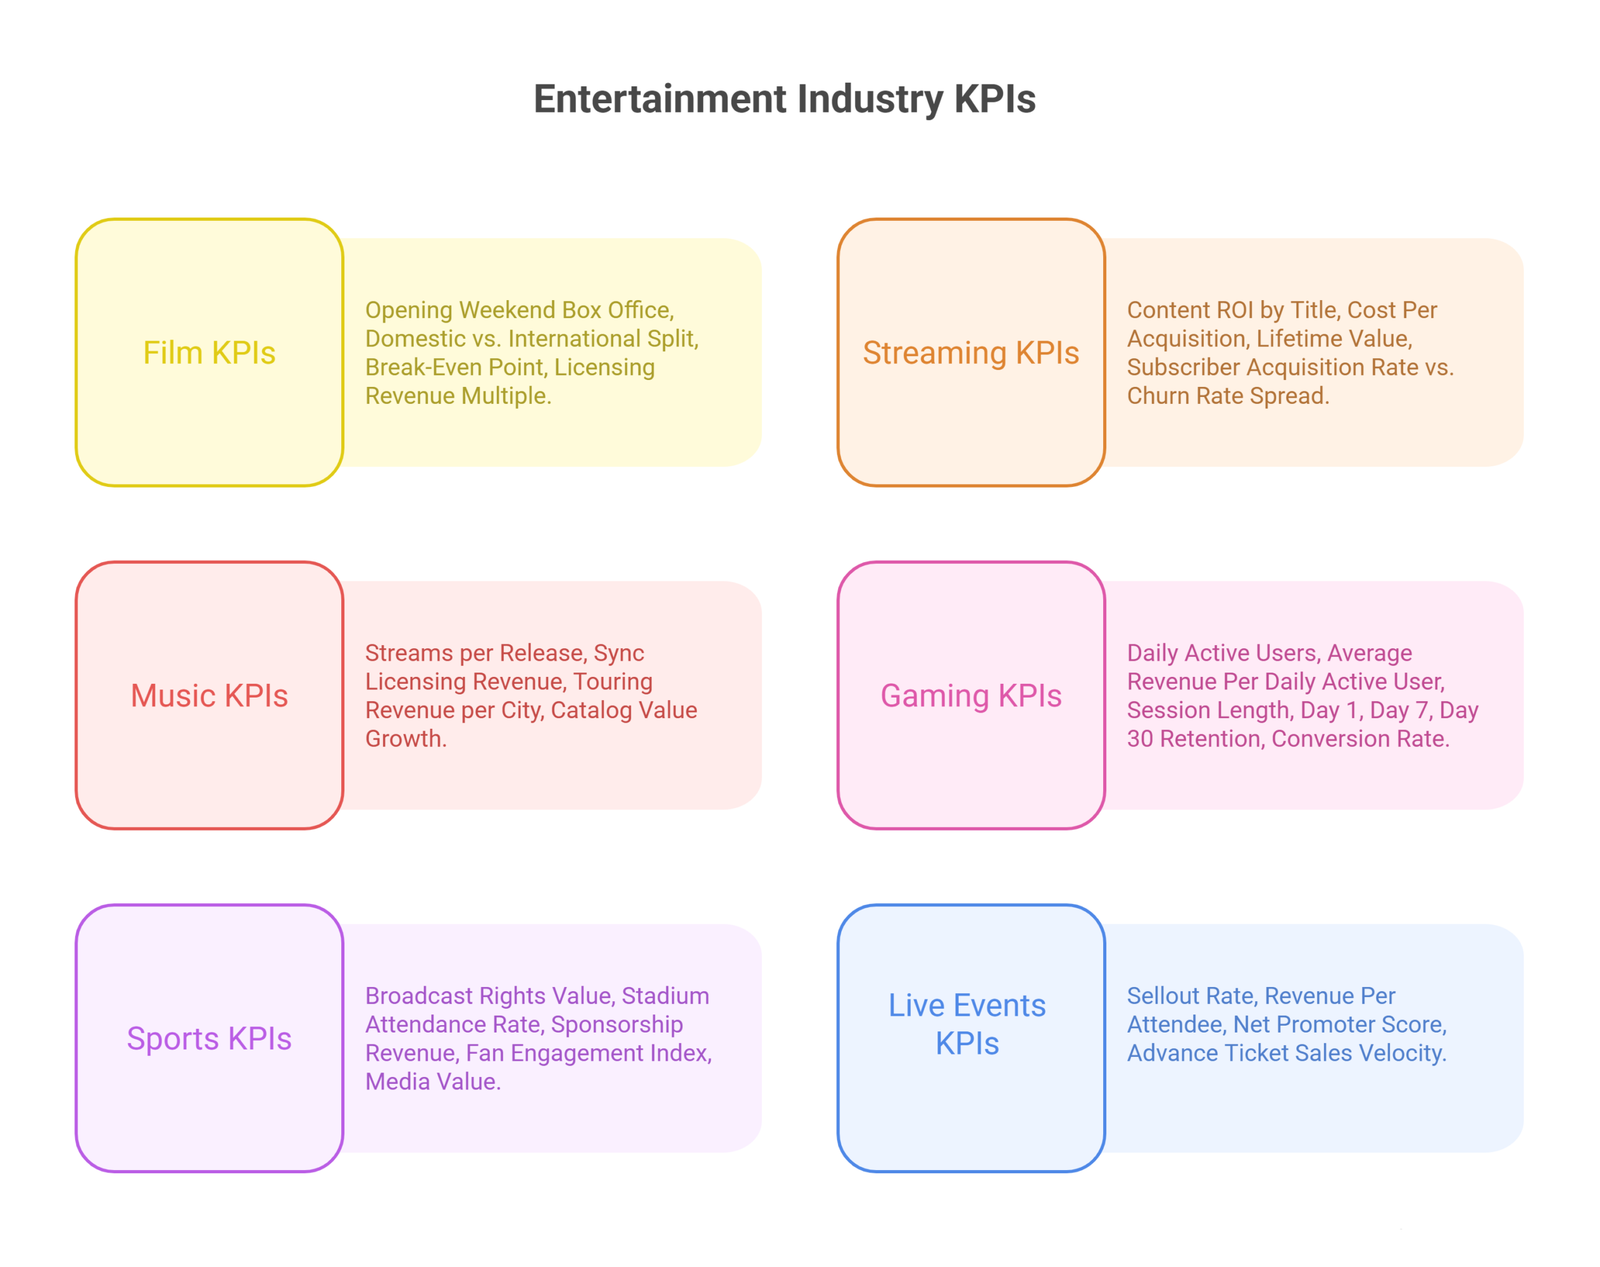
Understanding the kpi for entertainment industry means recognizing that each segment has its own primary scorecard. Here is how the major sectors approach performance measurement.
Film
- Opening Weekend Box Office: Still the standard benchmark for theatrical releases. It signals word-of-mouth potential and determines whether a film gets expanded to more screens.
- Domestic vs. International Split: Major studio tentpole films often generate 60% or more of their box office internationally. Tracking this split informs both production decisions (does the story travel?) and marketing allocation.
- Break-Even Point: The revenue level at which total costs (production plus marketing plus distribution) are recovered. Most studios set this as the primary financial hurdle for greenlight decisions.
- Licensing Revenue Multiple: How many times the initial box office revenue is multiplied across ancillary windows (streaming, TV, home video, merchandise).
Streaming and SVOD
- Content ROI by Title: Revenue attributed to a title (subscriber acquisitions, retention attributable to the title) relative to its production cost.
- Cost Per Acquisition (CPA): How much it costs to acquire a new subscriber, broken down by channel (organic search, paid social, referral, partnership).
- Lifetime Value (LTV): Total revenue expected from a subscriber across their entire relationship with the platform. The LTV to CPA ratio should ideally be 3:1 or higher for a healthy unit economics model.
- Subscriber Acquisition Rate vs. Churn Rate Spread: Growing subscribers only when new additions exceed losses seems obvious, but tracking the spread between these two rates monthly tells you whether growth is accelerating or decelerating.
Music
- Streams per Release: Total streams generated per song or album in the first 30 days and at 90 days.
- Sync Licensing Revenue: Revenue from placing music in films, TV shows, advertising, and games. This has become a major revenue line for publishers and labels.
- Touring Revenue per City: For artists, the profitability of each stop on a tour. Fixed costs (production, crew travel) versus variable revenue (ticket sales, merchandise).
- Catalog Value Growth: The increase in the estimated value of a music catalog, particularly relevant as catalog acquisitions have become a major investment category.
Gaming
- Daily Active Users (DAU): Core engagement metric. Games with high DAU relative to their install base have strong retention mechanics.
- Average Revenue Per Daily Active User (ARPDAU): Revenue generated per person who plays on a given day. Mobile games live and die by this metric.
- Session Length: How long players stay in a single gaming session. Longer sessions correlate with higher spend and longer retention.
- Day 1, Day 7, Day 30 Retention: The percentage of players who return after 1 day, 7 days, and 30 days post-install. These benchmarks reveal how quickly a game’s audience drops off and at what rate. Industry averages hover around 40% for Day 1, 20% for Day 7, and 10% for Day 30.
- Conversion Rate (Free to Paid): For free-to-play games, the percentage of players who make at least one in-app purchase. Even 2 to 5% conversion can sustain a highly profitable game if ARPDAU from paying players is high enough.
Sports
- Broadcast Rights Value: The negotiated value of TV and streaming rights contracts is the single largest revenue driver for most major sports leagues.
- Stadium Attendance Rate: Actual attendance as a percentage of stadium capacity. High attendance rates support premium ticket pricing and sponsorship valuations.
- Sponsorship Revenue: Total revenue from brand partnerships, jersey deals, naming rights, and in-stadium advertising.
- Fan Engagement Index: A composite metric tracking social media followers, app downloads, merchandise sales, and community interactions.
- Media Value: The estimated monetary value of earned media coverage, calculated based on the equivalent advertising cost for the exposure received.
Live Events and Concerts
- Sellout Rate: Percentage of shows that sell to full or near-full capacity.
- Revenue Per Attendee: Total event revenue divided by total attendees, capturing ticket sales, concessions, merchandise, and VIP upgrades.
- Net Promoter Score (NPS): How likely attendees are to recommend the event to others. NPS correlates strongly with repeat ticket purchases and organic word-of-mouth growth.
- Advance Ticket Sales Velocity: How quickly tickets sell after they go on sale. Slow velocity early signals pricing or demand problems that need correcting before the event.
How to Build a KPI Dashboard That Actually Gets Used
Knowing the right kpi for entertainment industry use cases is only half the job. The other half is building a reporting system that people actually look at and act on.
Keep your top-level dashboard to 8 to 12 metrics. More than that and the dashboard becomes noise. Senior leadership should see the metrics that directly connect to strategic goals. Functional teams (production, marketing, distribution) maintain more granular dashboards relevant to their work.
Update frequency should match decision-making cadence. Box office data updates daily during a theatrical run, so that dashboard needs daily updates. Content library metrics might refresh weekly. Financial summaries are often most useful on a monthly and quarterly cadence.
Set targets before the period begins. A metric without a target is just a number. Before each quarter or project, define what good performance looks like. This makes variance analysis meaningful and creates accountability.
Connect leading metrics to lagging ones. A classic mistake is tracking only lagging metrics like revenue and profit, which tell you what already happened. Pair each financial metric with a leading indicator: churn rate predicts future subscriber revenue, opening weekend box office predicts total theatrical run, Day 7 game retention predicts 90-day monetization.
Review your metric selection annually. The right kpi for entertainment industry applications changes as the business evolves and as the industry shifts. A streaming service that tracked subscriber growth as its primary metric in 2019 should be tracking ARPU and content ROI today. What you measure should reflect where the business is, not where it was.
Frequently Asked Questions
What is the single most important KPI for a streaming platform?
It depends on the stage of the business. Early-stage platforms should prioritize subscriber growth rate and cost per acquisition. Mature platforms should prioritize churn rate and average revenue per user. Profitability-focused platforms should add content ROI and free cash flow margin to the top of the list.
How do entertainment companies measure the success of a specific piece of content?
Typically through a combination of viewership data (total streams, completion rate), subscriber impact (how many new subscribers attribute their sign-up to that title), retention impact (are subscribers who watched that title churning at a lower rate?), and direct revenue where applicable (theatrical box office, digital sales).
Are financial KPIs or engagement KPIs more important in entertainment?
Both matter, but engagement KPIs tend to be more forward-looking. A company can post strong financial results in a quarter while its engagement metrics are deteriorating. Those deteriorating engagement metrics will eventually show up in the financials; they just do so with a lag. Tracking both in parallel gives the most complete picture.
How should an independent film production company approach KPI tracking?
Start with budget variance, ROI per project, and cash conversion cycle. These three metrics, tracked consistently across every production, will reveal patterns in your cost management, your ability to recover investment, and your cash flow timing. From there, add audience metrics relevant to your distribution strategy, whether that is festival submissions, streaming placement, or theatrical distribution.
How often should entertainment companies review their KPIs?
Operational KPIs (box office, streaming numbers, ticket sales) should be reviewed weekly or even daily during active campaigns. Financial KPIs should be reviewed monthly with a full quarterly reconciliation. Strategic KPIs tied to long-term goals should be formally reviewed quarterly at leadership level.
Conclusion
The kpi for entertainment industry landscape is broader, more nuanced, and more sector-specific than most general business frameworks acknowledge. A metric that is essential for a gaming studio (Day 30 retention) is irrelevant for a concert promoter, and a metric that drives decisions at a major record label (catalog value growth) does not translate to a film studio at all.
What does translate across the entire industry is the discipline of measuring intentionally. Entertainment companies that define their most important metrics before a project begins, track them consistently throughout, and use them to inform decisions rather than just confirm intuitions outperform those that rely on instinct and retrospective analysis.
Start with your financial foundation: ROI, working capital, budget variance, and cash conversion cycle. Layer on your audience metrics: the specific ones depend on your sector, but churn, engagement depth, and revenue per user are almost universally relevant. Add your operational metrics to keep efficiency visible. And then build sector-specific KPIs on top that reflect the actual economics of your piece of the entertainment world.
The right kpi for entertainment industry measurement is not about tracking everything. It is about tracking the right things consistently enough that you actually know what is working, what is not, and what to do next. That clarity is what turns creative businesses into durable ones.
Is your entertainment business running on creative intuition, or real numbers? In an industry with lumpy revenue and volatile production budgets, gut instinct isn’t a financial strategy. Oak Business Consultant provides Fractional CFO services built for media, gaming, and entertainment. We help you track true content ROI, master your cash conversion cycle, and manage tight budget variances—without the full-time executive cost. Schedule Your Free Entertainment Strategy Session.