8 Key Retail Metrics Every Retail Business Should Track
Metrics Every Retail Business Should Track
Most retail owners can quote last month’s revenue without checking a single spreadsheet. Far fewer can say, with any confidence, whether their store is converting visitors into buyers, how much of their sales come from repeat customers, or whether the inventory sitting on their shelves is actually generating a return. Revenue tells you what happened. The eight metrics below tell you why, and what to fix next.
1. Sales growth
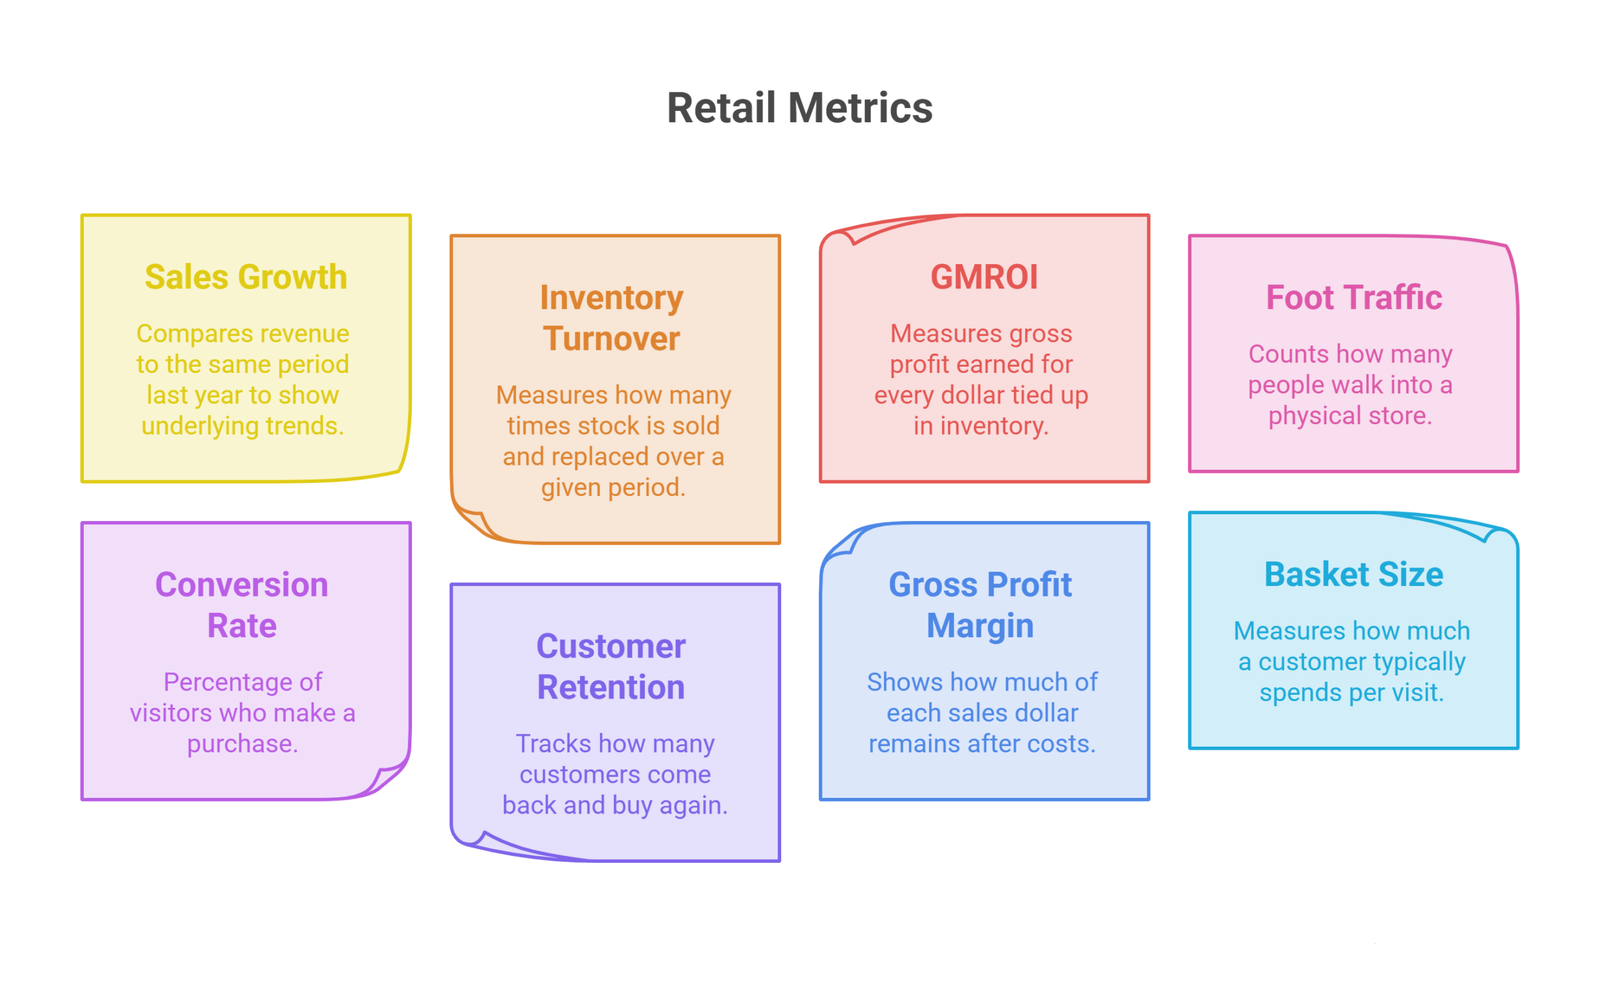
Sales growth compares revenue in one period to the same period a year earlier. Comparing against last year, rather than last month, strips out normal seasonal swings and shows the real underlying trend.
Formula: (Current period sales − same period last year’s sales) / same period last year’s sales × 100
A retailer with flat or declining year-over-year sales for two straight quarters has a real problem worth investigating, even if this month’s raw number still looks fine on paper. New retailers without a full year of history can track month-over-month growth instead, until enough data builds up for a fair comparison.
2. Inventory turnover
Inventory turnover measures how many times a retailer sells and replaces its stock over a given period. A high turnover generally signals strong sales and efficient buying. A low one usually means cash is parked on shelves instead of moving through the business.
Formula: Cost of goods sold / average inventory value
A retailer carrying $90,000 in annual cost of goods sold against $7,500 in average inventory turns that stock over 12 times a year, roughly once a month. Watching this number over time helps set reorder schedules and flags slow-moving stock before it needs a markdown. Building a retail store financial model that links inventory assumptions to cost of goods sold makes this calculation automatic as sales come in, instead of a manual spreadsheet chore at month-end.
3. Gross Margin Return on Investment (GMROI)
Turnover alone can be misleading. A store can turn inventory over quickly and still lose money on every unit if margins are thin. GMROI closes that gap by measuring the gross profit earned for every dollar tied up in inventory.
Formula: Gross profit / average inventory cost
A GMROI of 3.0 means every dollar invested in stock returns three dollars in gross profit. Most healthy retail categories sit somewhere between 2.5 and 3.5; anything below 2.0 usually points to overbuying, poor category mix, or pricing that hasn’t kept pace with cost increases. GMROI is the metric that tells a buyer which product lines are worth reordering and which ones are quietly draining cash, something turnover and margin can’t show on their own.
4. Foot traffic
Foot traffic counts how many people walk into a physical store, regardless of whether they buy anything. It’s the retail equivalent of website sessions, and every other in-store metric depends on it for context.
Formula: Number of visitors / unit of time (day, week, or month)
Foot traffic alone only tells half the story. A jump in visitors after a window display refresh or a local ad push is only a win if it also moves the next metric on this list. Ecommerce-only retailers can substitute website sessions here and track the two side by side if they run both a store and an online channel.
5. Conversion rate
Conversion rate is the percentage of visitors, in-store or online, who actually make a purchase. It’s arguably the single most telling retail metric because it isolates how well a store turns interest into revenue.
Formula: (Number of sales / number of visitors) × 100
A store with rising foot traffic but a falling conversion rate usually has a layout, staffing, pricing, or product-mix problem, not a marketing problem. Watching the two together, rather than in isolation, is what actually points to the fix.
6. Customer retention
Retention tracks how many customers come back and buy again, as opposed to shopping once and never returning. It matters because keeping an existing customer is consistently cheaper than acquiring a new one.
Formula: (Customers at the end of a period − new customers gained during the period) / customers at the start of the period × 100
A retailer with strong retention can often spend less on acquisition and more on loyalty programs, personalized offers, or service improvements that keep existing customers coming back. That tends to be a better return on marketing spend than constantly chasing new traffic. Retailers building out a custom financial model often use retention data to test how a loyalty program or subscription tier would change cash flow over a full year, before committing budget to it.
7. Gross profit margin
Gross profit margin shows how much of each sales dollar remains after accounting for the direct cost of the goods sold. It’s the clearest single indicator of whether a retailer’s pricing and sourcing are actually working.
Formula: (Revenue − cost of goods sold) / revenue × 100
A shrinking margin over time, even with revenue holding steady, usually points to rising supplier costs, discounting that’s gone too deep, or a shift in sales mix toward lower-margin items. Any of those is worth catching early rather than at year-end reporting. Margin benchmarks vary widely by category, so a hardware retailer and a clothing boutique will naturally sit at very different healthy ranges; an industry-specific model is more useful here than a generic rule of thumb.
8. Basket size (average transaction value)
Basket size, also called average transaction value, measures how much a customer typically spends per visit. It’s the metric most directly shaped by merchandising and cross-selling decisions.
Formula: Total revenue / number of transactions
Retailers commonly grow this number through bundling, strategically placed complementary products, or minimum-spend incentives like free shipping thresholds. Even a small, consistent increase in basket size compounds meaningfully over a full year of transactions. Online-only sellers building out an e-commerce financial model usually find this is the fastest lever to pull before touching acquisition spend, since it doesn’t require a single new visitor.
Quick reference: retail metrics at a glance
| Metric | Formula | What it tells you |
| Sales growth | (This period − last year) / last year × 100 | Whether the business is actually growing |
| Inventory turnover | COGS / average inventory | How efficiently stock moves |
| GMROI | Gross profit / average inventory cost | Return generated per dollar of inventory |
| Foot traffic | Visitors / unit of time | Store visibility and reach |
| Conversion rate | (Sales / visitors) × 100 | How well visits turn into revenue |
| Customer retention | (End customers − new customers) / start customers × 100 | Loyalty and repeat business strength |
| Gross profit margin | (Revenue − COGS) / revenue × 100 | Pricing and sourcing health |
| Basket size | Revenue / number of transactions | Spend per customer visit |
Frequently Asked Questions
Which retail metric should a new store owner track first?
Gross profit margin and inventory turnover, since both reveal whether the core business model is profitable before layering on customer-behavior metrics like conversion rate or retention.
Why add GMROI if margin and turnover are already on the list?
Margin shows profitability per sale and turnover shows how fast stock moves, but neither shows the return on the cash actually tied up in inventory. A category can turn over fast at thin margins, or sit at healthy margins while barely moving. GMROI is the number that catches both failure modes at once.
How often should retail metrics be reviewed?
Sales, foot traffic, and conversion rate benefit from weekly review since they shift quickly. Margin, GMROI, and retention are better tracked monthly or quarterly, where the trend matters more than any single data point.
Can these metrics be tracked without expensive software?
Yes, for a single-location retailer. A well-built spreadsheet linked to point-of-sale export data can calculate all eight. Multi-location retailers usually find a POS or ERP system with built-in reporting pays for itself once manual tracking becomes too time-consuming.
What’s a good conversion rate for a retail store?
It varies significantly by category and channel. A high-consideration purchase like furniture will naturally convert lower than a low-cost impulse item. The number that matters most is the trend for your own store over time, not a generic industry benchmark.
Do online and in-store retailers track different metrics?
The core eight apply to both, but the inputs differ. Ecommerce retailers substitute foot traffic with website sessions and often add cart abandonment rate, while brick-and-mortar retailers weigh foot traffic and basket size more heavily.
Conclusion
None of these eight metrics means much in isolation. A strong conversion rate paired with weak foot traffic points to a marketing gap. Rising sales with a shrinking margin points to a pricing gap. Healthy turnover with a low GMROI points to a buying gap that margin and turnover alone would have missed. The value comes from tracking all eight together and asking what one number explains about the others.
Building the systems to calculate and monitor these metrics accurately, especially across multiple locations or channels, is where Oak Business Consultant’s financial modeling work comes in. We’ve built more than 80 retail-specific financial models covering everything from inventory planning to full P&L forecasting. Contact us to get a model built around your business.