The most significant B2B KPIs according to more than 50 Businesses
The B2B KPIs that actually move revenue and cash flow
Most “B2B KPI” lists read the same way: a grab bag of marketing numbers, sales numbers, and a vague line about customer satisfaction, with no indication of which ones actually decide whether the business survives the quarter. A dashboard with twenty metrics tells you nothing if you cannot say which three predict whether payroll clears next month.
This guide sorts B2B KPIs by what they actually control: pipeline, revenue, and cash. It gives you the formula, the benchmark, and who should own each one, including the financial KPIs that most sales-and-marketing-focused guides skip entirely, even though they are usually the ones that decide whether a growing B2B company stays solvent.
What separates a KPI from a metric
A metric is anything you can count: page views, calls made, emails sent. A KPI is a metric tied to a target that leadership actually uses to make decisions. Website traffic is a metric. Lead-to-customer conversion rate is a KPI, because it tells you whether that traffic is worth anything.
The distinction matters because most B2B teams report activity, not outcomes. It is easy to fill a dashboard with impressions and call counts. It is harder, and more useful, to show which numbers move revenue and which ones move cash.
Sales KPIs that predict revenue, not just activity
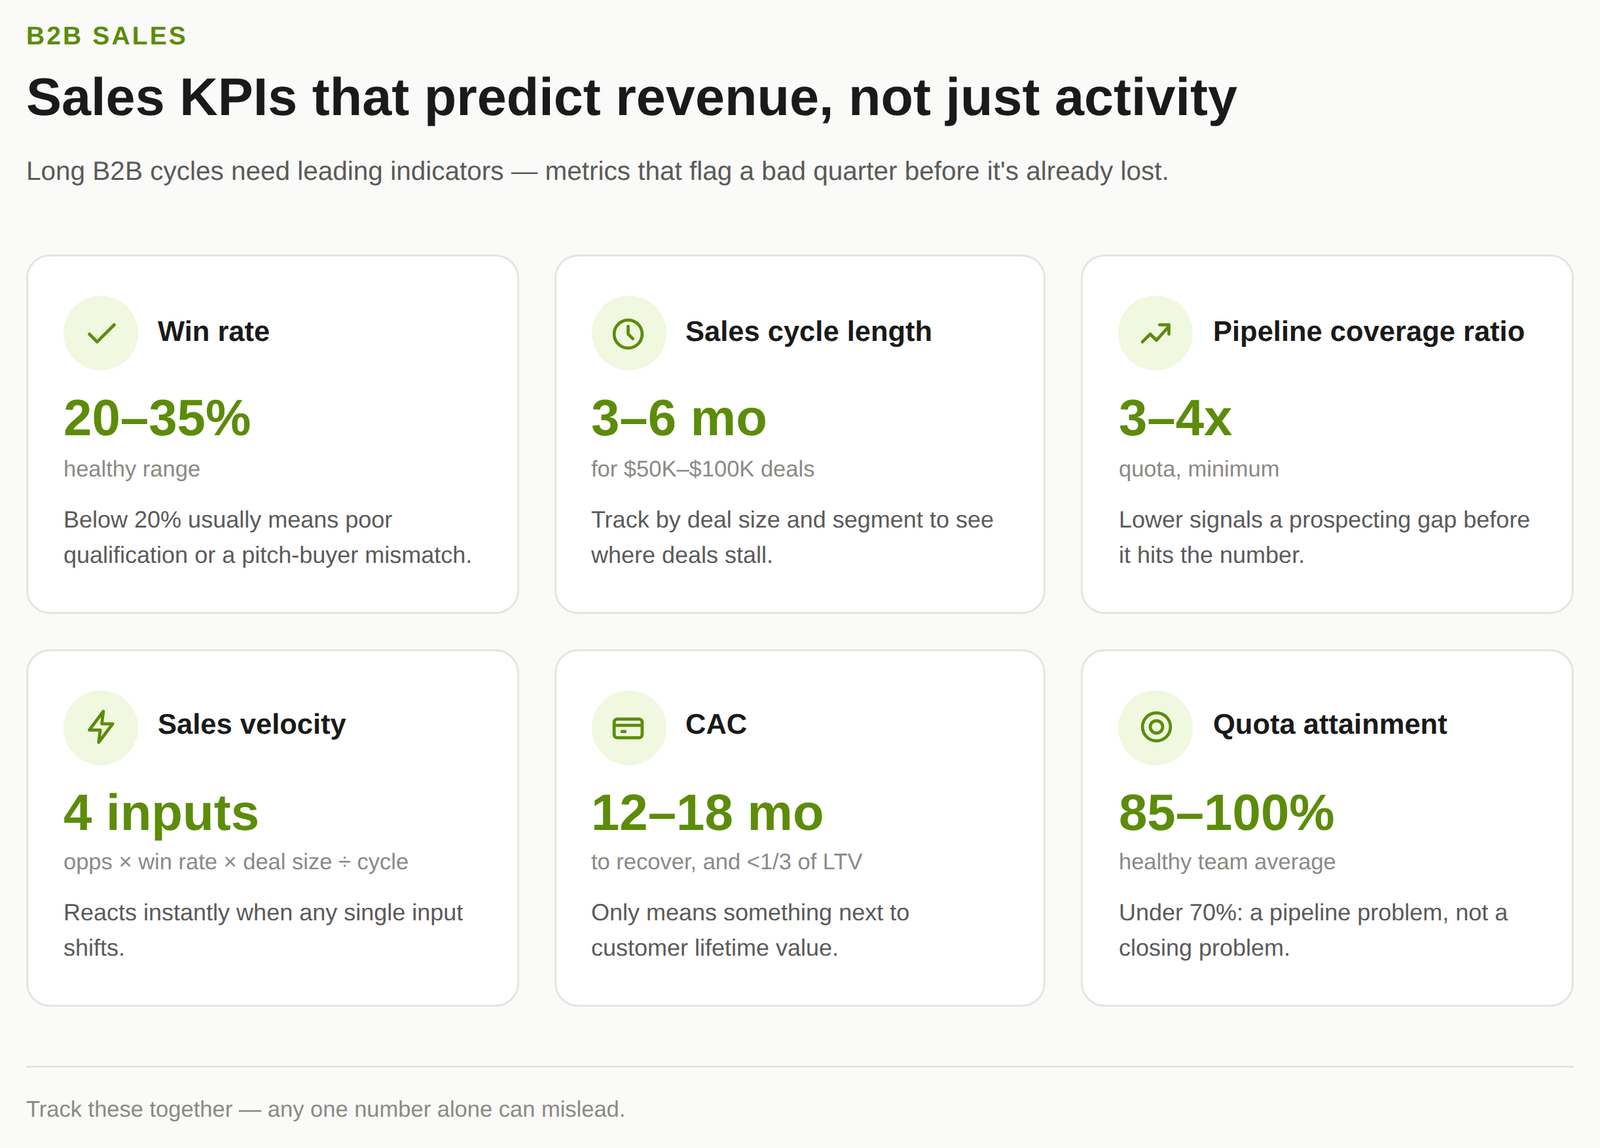
B2B sales cycles are long and involve multiple stakeholders, so the KPIs that matter are the ones that catch problems before a quarter is already lost.
Win rate. Deals won divided by total closed deals. A healthy B2B win rate typically sits between 20% and 35%, depending on industry and deal complexity. A win rate below 20% usually points to poor qualification or a mismatch between the sales pitch and what the buyer actually needs.
Sales cycle length. Average days from first contact to close. Most B2B deals in the $50,000 to $100,000 range close in three to six months. Tracking this by deal size and segment shows you where deals are getting stuck.
Pipeline coverage ratio. Total pipeline value divided by sales quota. A coverage ratio of three to four times quota is the standard minimum for consistent goal attainment. Anything lower signals a prospecting gap before it shows up as a missed number.
Sales velocity. (Number of opportunities × win rate × average deal size) ÷ sales cycle length. This single formula tells you how fast the team converts pipeline into revenue, and it reacts immediately when any of its four inputs changes.
Customer acquisition cost (CAC). Total sales and marketing spend divided by new customers acquired. CAC only means something next to customer lifetime value. As a rule of thumb, CAC should be recoverable within 12 to 18 months and should not exceed a third of a customer’s lifetime value.
Quota attainment rate. Total sales divided by total quota. Healthy B2B teams average 85% to 100% attainment across the team. A team that consistently blows past 100% may have quotas set too low; a team stuck under 70% likely has a pipeline or qualification problem, not a closing problem.
Marketing KPIs worth reporting to your CFO
The mistake most B2B marketing dashboards make is leading with activity. Impressions, clicks, and content volume are easy to pull, so they end up filling the report, and leadership reads them as effort rather than results.
A more useful way to organize marketing KPIs is by how close they sit to revenue:
- Activity metrics (impressions, MQL volume, cost per lead) explain what the team did. Useful for diagnosing a campaign, not for proving value to a CFO.
- Engagement metrics (target-account reach, meeting rate, reply rate) show whether the right accounts are paying attention. These move before pipeline does, so they work as an early warning system.
- Pipeline metrics (pipeline created or influenced, opportunity conversion rate, sales cycle length on marketing-touched deals) show whether marketing is actually creating and moving opportunities.
- Revenue metrics (revenue influenced, revenue sourced, marketing ROI, CAC payback period) are the numbers that decide budgets, because they are the only ones a CFO can trace to the bank account.
The practical takeaway: report the revenue and pipeline numbers first, and keep activity metrics as supporting detail your team uses to diagnose a campaign, not as the headline of the report.
The financial KPIs most B2B companies skip
This is the gap in almost every generic “B2B KPI” article: sales and marketing metrics tell you if you are winning deals. They do not tell you if the business can pay its bills while you win them. A company can hit every sales target and still run out of cash, which is why a fractional CFO tracks a different layer of KPIs alongside the sales and marketing numbers.
| KPI | Formula | What it tells you | Typical benchmark |
| Gross profit margin | (Revenue − COGS) ÷ Revenue × 100 | Pricing power and production efficiency | 40–60% for services; varies sharply by industry |
| Net profit margin | Net income ÷ Revenue × 100 | What’s actually left after every expense | 10–20% for healthy SMBs |
| Operating cash flow | Cash generated from core operations | Whether the business can fund itself day to day | Positive and growing; the single most cited predictor of small-business survival |
| Days sales outstanding (DSO) | (Accounts receivable ÷ Total credit sales) × Number of days | How long customers take to actually pay you | Lower is better; track the trend, not just the number |
| Quick ratio | (Current assets − Inventory) ÷ Current liabilities | Ability to cover short-term liabilities without selling inventory | Above 1.0 is generally considered healthy |
| Burn rate / runway | Monthly cash outflow; Cash on hand ÷ burn rate | How many months of survival remain at the current spend rate | Company- and stage-specific, but this is the number every investor asks for first |
A B2B company can be profitable on paper and still fail because operating cash flow never turns positive, or because DSO creeps up quietly while the sales team celebrates a strong pipeline. That is exactly why gross margin, cash flow, and DSO deserve a permanent seat on the same dashboard as win rate and pipeline coverage, not a separate spreadsheet nobody opens until year-end. Getting these numbers reliably in the first place usually starts with clean bookkeeping and a properly structured chart of accounts, since a KPI is only as trustworthy as the ledger behind it.
How many KPIs should you actually track
More than most teams think you should, but fewer than most dashboards actually contain. The pattern that shows up across sales, marketing, and finance guidance is remarkably consistent: five to seven core KPIs per function, reviewed on a cadence that matches how fast that number actually moves.
- Daily or weekly: activity metrics, pipeline movement, and cash position for anyone directly responsible for them.
- Monthly: win rate, sales cycle length, marketing pipeline contribution, gross margin, and operating cash flow.
- Quarterly: strategic KPIs like CAC, LTV, and burn rate, where short-term noise would only mislead.
Dashboards that exceed ten to twelve KPIs per audience tend to get reviewed once and then ignored. A short, layered dashboard, built around the handful of numbers that actually decide budget and hiring decisions, gets checked every week.
Building a KPI dashboard that ties sales, marketing, and finance together
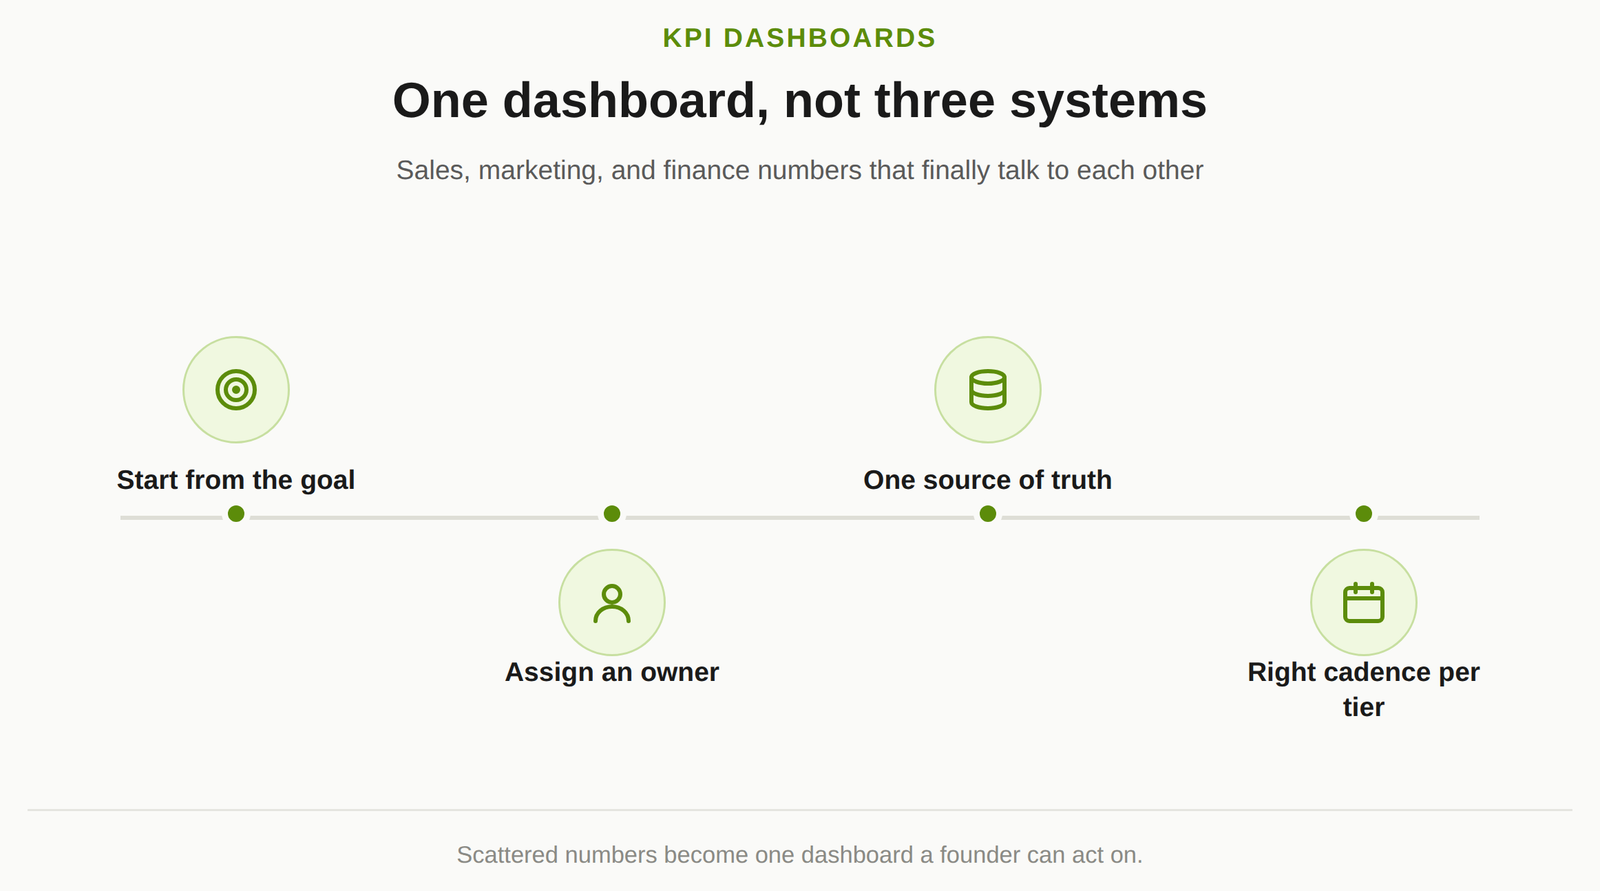
The most common failure in B2B KPI tracking is not choosing the wrong metrics. It is keeping sales, marketing, and finance numbers in three separate systems that never talk to each other, so nobody can answer a simple question: does this quarter’s pipeline growth actually translate into cash in the bank?
A workable dashboard structure:
- Start from the business goal, not the available data. If the goal is extending runway, the dashboard leads with burn rate and operating cash flow, not impressions.
- Assign an owner to every KPI. A number with no owner becomes a reporting exercise instead of an accountability tool.
- Pull from one source of truth. KPIs that live in a spreadsheet drift from the CRM and the general ledger they are supposed to describe. Connecting a live financial KPI dashboard directly to your accounting data avoids the manual reconciliation that quietly kills most DIY dashboards within a few months.
- Review at the right cadence for each tier, not the same cadence for everything.
For companies that do not have the internal bandwidth to build and maintain this themselves, this is precisely the kind of cross-functional reporting a fractional CFO is built to own: turning scattered sales, marketing, and accounting numbers into one dashboard that a founder or board can actually act on. Reliable financial forecasting depends on exactly this kind of clean, connected KPI data, and most FP&A teams spend more time chasing numbers across systems than analyzing them, which is usually the first thing an FP&A manager fixes when they join a growing company. Even a lean budgeting tool from a list of budgeting apps for SMEs is a reasonable starting point if a full dashboard build is not yet in the budget.
Frequently Asked Questions
What’s the difference between a B2B KPI and a B2C KPI?
B2B KPIs account for longer sales cycles, multiple decision-makers per deal, and higher average deal sizes, so metrics like pipeline coverage and sales cycle length matter more than they do in B2C. B2C dashboards lean harder on conversion rate and average order value, since the buying decision is faster and usually made by one person.
How often should B2B KPIs be reviewed?
Activity and cash-position metrics deserve a weekly look. Win rate, sales cycle length, and gross margin fit a monthly review. CAC, LTV, and burn rate are better assessed quarterly, since they move slowly enough that weekly tracking mostly adds noise.
Can a small B2B company track financial KPIs without a full finance team?
Yes, though it requires a clean chart of accounts and consistent bookkeeping before any KPI is trustworthy. Many small B2B companies get here with budgeting software plus a fractional CFO who sets up the dashboard once and reviews it monthly, rather than hiring a full finance department from day one.
What is a good win rate for a B2B sales team?
Most B2B sales teams land between 20% and 35%, with professional services often running higher and complex enterprise sales running lower. The number matters less on its own than the trend: a win rate that is declining quarter over quarter usually points to a qualification or positioning problem worth investigating immediately.
Why do sales targets get hit while cash flow still tightens?
This happens when a company tracks revenue and pipeline closely but loses sight of days sales outstanding, gross margin, or burn rate. Revenue booked is not the same as cash collected, and a growing DSO can quietly starve a business that looks healthy on every sales report.
Conclusion
The B2B companies that avoid nasty surprises are not the ones tracking the most KPIs. They are the ones tracking the right handful across sales, marketing, and finance, with a clear owner and formula behind each one, reviewed at a cadence that matches how fast the number actually moves. Pipeline and win rate tell you if you are winning. Gross margin, cash flow, and DSO tell you if winning is actually paying off.
If your dashboard currently lives in three disconnected spreadsheets, or if nobody can tell you this quarter’s burn rate without pulling an all-nighter first, a fractional CFO can build the reporting structure once and hand you a dashboard you actually trust.