


Super App Excel Financial Model Template


Original price was: $350.$210Current price is: $210.
The Financial Analysts at Oak Business Consultant have made this complete and dynamic Super App Excel Financial Model Template for your complete financial planning needs. The model has a 5-year financial projection plan to track steady growth and profitability. It can also estimate ongoing operating expenses, monthly sales revenue, and startup investment requirements. With this easy-to-use template there is no further need for complex calculation, you just need to add numbers and you are all set.
- Description
- Reviews (1)
Description
Super App Excel Financial Model Template
A Super App can be profitable as it targets multiple customer needs in one place. However, to make this business a success, it is essential to have proper planning and management of resources. Our Super App Excel Financial Model Template can make business planning easier and faster.
Introduction to our Super App Financial Model
Super App Excel Financial Model presents the business case of a brand-new start-up. The model contains the three financial statements, including the cash flows and calculates the relevant metrics (Sensitivity Analysis, Break-even Analysis, Diagnostic Tools, Project evaluation, and Charts). The financing options for the project include a standard long-term loan and an investment made by the investors.
How to Use Super App Financial Model Template
A quick overview of the Financial Model: in the contents tab, you can see the structure of the model, and by clicking on any of the headlines, you will be redirected to the relevant worksheet.
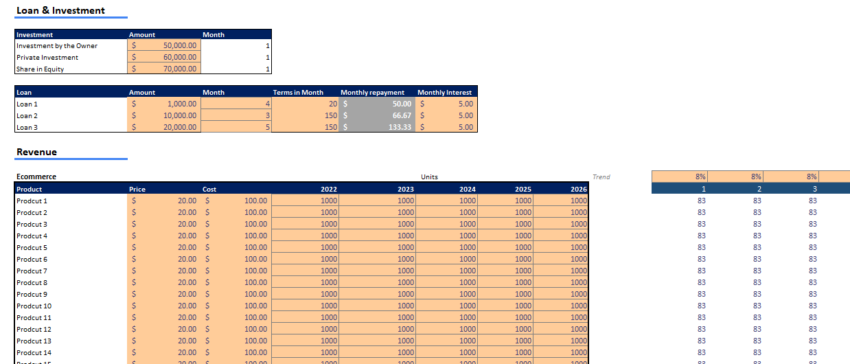
On the Input tab, you can feed the financial information for the model, such as sales price, cost, expenses, etc. Inputs are always depicted with a Peach fill and grey letters, while the call-up (direct links from other cells) are filled in grey with black letters and calculations are depicted with white fill and black characters.
Tabs based on Calculations
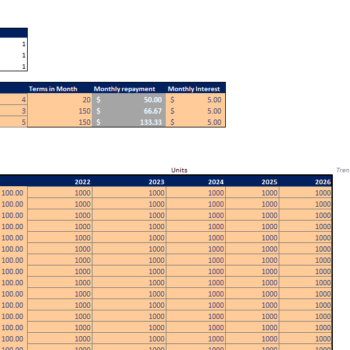
The Revenue sheet is structured to perform calculations according to the inputs entered by the user. Our Super App Excel Financial Model Template provides separate sheets for Loan and Depreciation calculation. The PnL Monthly tab has aggregation along with other relevant statements like the balance sheet and cash flow for every month.
In the sensitivity analysis tab, you can see a high-level report with the main business scenarios. It shows the company’s profit in case of any uncertainty. For example, how will the profit change if the cost or expenses increase by 10%.
The break-even analysis tab is helpful in determining the number of units and revenue required to achieve break-even.
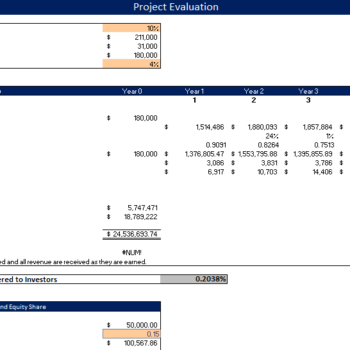
Moving to the Project Valuation tab, a company valuation is performed by using the free cash flows with discount rates to the firm. Then a series of investment metrics are presented (IRR, NPV, ROE).
In the Dashboard tab: Various graphs present the revenues, cash analysis, break-even analysis, sensitivity, assets vs liabilities, startup summary etc.
Key Inputs of Super App Excel Financial Model
- The growth rate
- Various prices and segmentation of revenue
- Revenue Assumptions
- Average Payable and Receivable days your business is following
- Cost of Goods
- Fixed Asset and Capital Expenditure.
- Tax Rate
- Investment table
- Loan table
Key Features of Super App Excel Financial Model
Input Sheet

This financial model template contains inputs that, when changed, impact the calculations, and, therefore, the changes are applied to all relevant sheets. This financial model always has built-in flexibility to display different outcomes or final calculations based on this sheet’s changes. This also helps in calculating future projections.
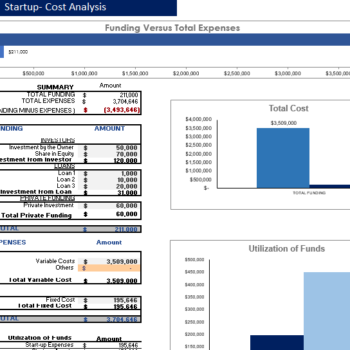
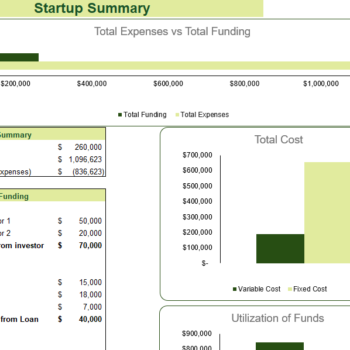
Startup Summary for Super App Excel Financial Model
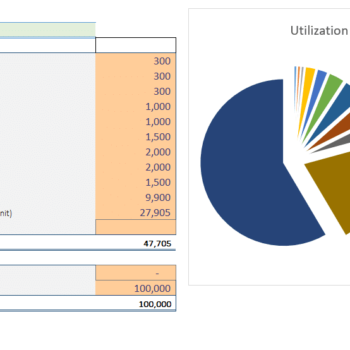
A start-up summary tab includes the total cost incurred at the start of business and capital expenditure, how much cash has been injected by the company so far, and the amount of investment required is calculated based on the number of months.
A Startup Summary helps you take a realistic view of your idea and double-check whether the business has enough funds to support operations.
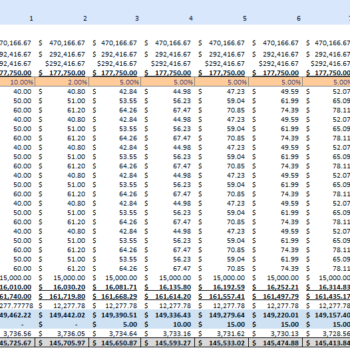
Monthly & Yearly Income Statement

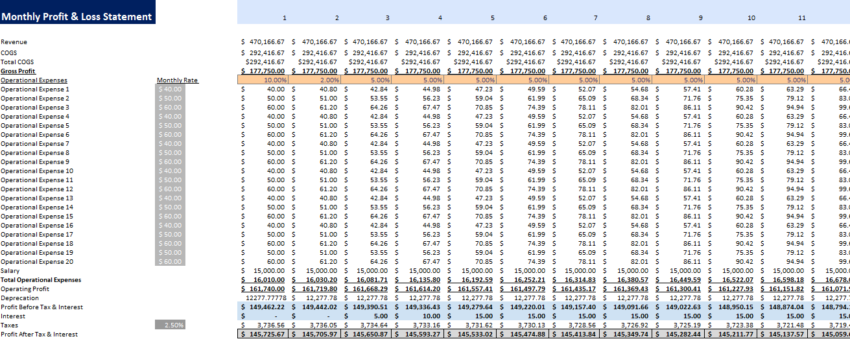
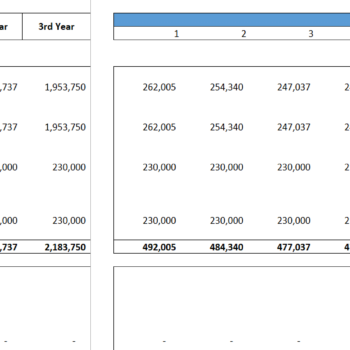
The Super App Excel Financial Model provides the monthly and yearly income statement structure and a framework for creating a full corporate forecasting model tailored to your business.
This integrated financial model is powerful since it enables the Financial Model user to change any assumption in one part of the statement. This is to see how it impacts all other parts of the statements accurately and consistently. This feature helps in calculating future projections.
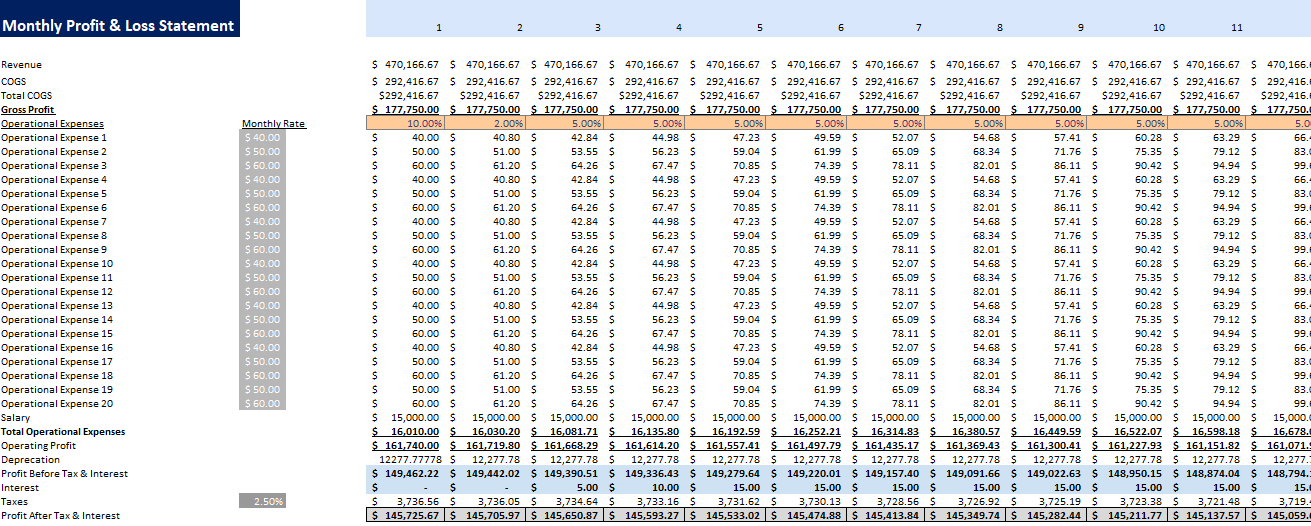
The Super App Excel Financial Model’s monthly Income Statement sheet is perfect for those requiring regular reporting and details. It has gross earnings and net earnings linked with a revenue analysis sheet to ensure accurate reporting. Additionally, Income Statement contains all revenue streamlines. Oak Business Consultants understands every Super App business’s goal. Therefore, we have developed a mechanism that helps business owners determine whether they are making profits.
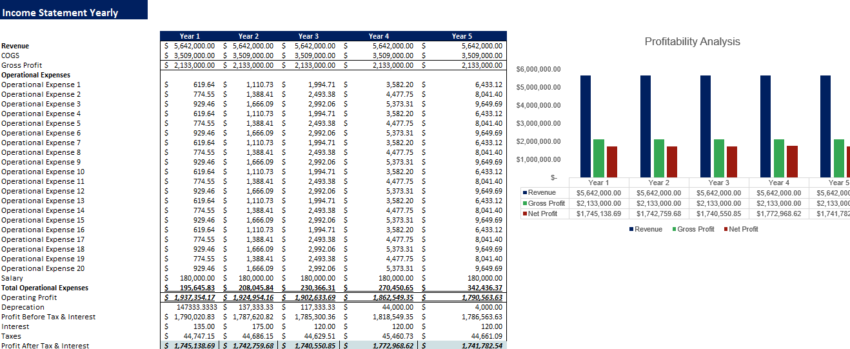
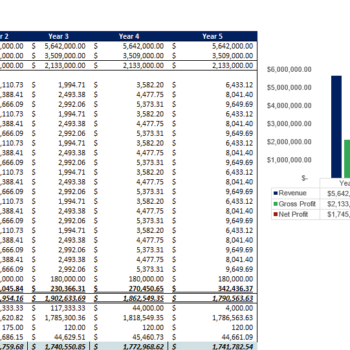
Furthermore, the Yearly Income Statement gives you complete insights into revenue and general & administrative expenses. The Yearly Income Statement also contains several graphs, assumptions, ratios, margins, net profit, earnings, cost of services, and profit after tax.
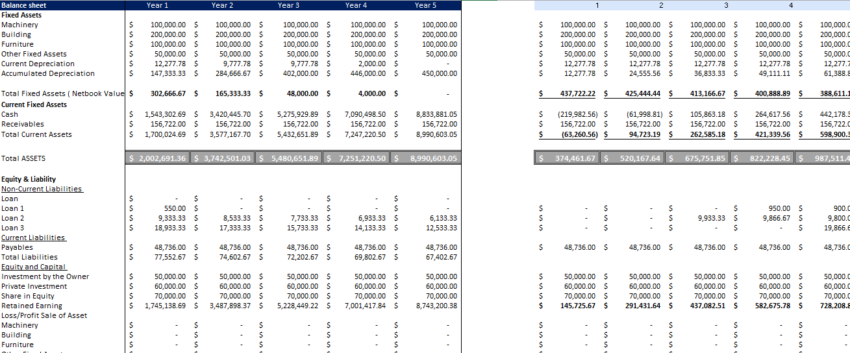
Balance Sheet for Super App Excel Financial Model

This balance sheet enables you to analyze your position of current assets, fixed assets, liabilities, and equity. This also allows you to monitor your accounts receivable, accounts payable, accrued expenses, etc. Therefore, this specific, financial model gives you the perfect space to analyze your key financial balance accounts.
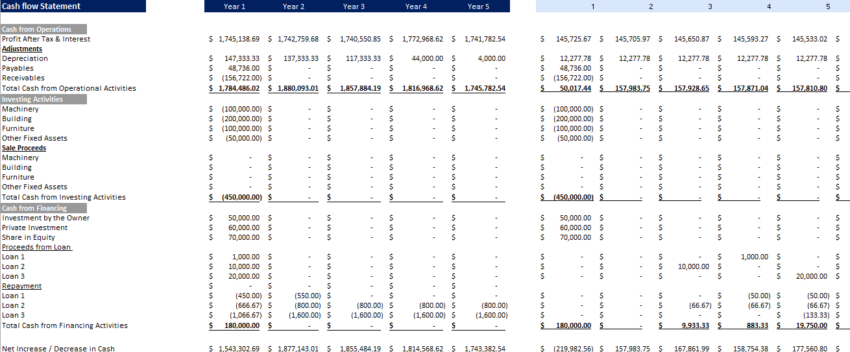
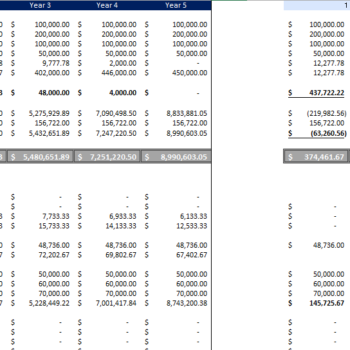
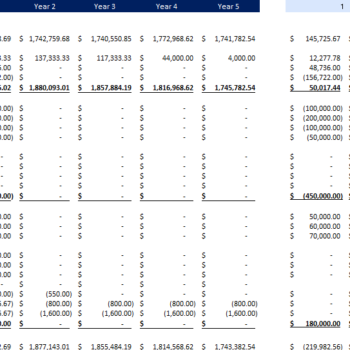
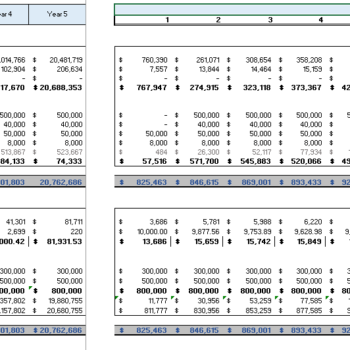
Cash Flow for Super App Excel Financial Model

The Cash Flow Statement is the vital part of the three statements that report the cash spent and generated during a specific period. The Cash Flow Statements act as a bridge between the income statement and the balance sheet. It depicts how money moves in and out of business.
Three main sections of the Cash flow Statement:
- Operating Activities: We have included all cash in and out related to the operations of the business
- Investing Activities: Any cash from the disposal of an asset and acquisition and investments is included in this section linked to the inputs and fixed asset tab.
- Financing Activities: We have separately made a loan-related tab where you can enter all loan-related information. The tab is linked to the Financing Activities of Cash flow Statement.
The Cashflow Statement in our Model contains a dedicated sheet to monitor and analyze your company cash-ins and out. This cash flow statement is based on several key inputs, such as Payable and Receivable Days, yearly income, working capital, long-term debt, net cash, etc. This calculation computes your net cash flow and beginning and end cash balances. This is a perfect template for your company’s cash flow management.
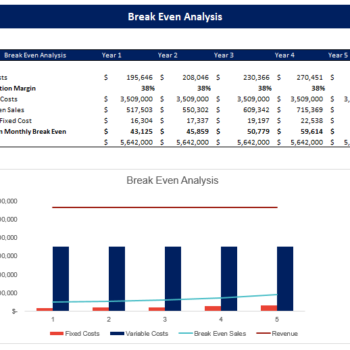
Break-Even Analysis
A break-even analysis can help you measure how different scenarios might play out financially. For example, if you increase the marketing budget or add another employee to the payroll, how many extra sales will be needed to recover that additional expense?
We have included a Break-even analysis to our Financial Model which will help the user to determine sales. The break-even analysis will help you know at a glance, the profits generated at the various sales levels. The Break-Even Analysis refers to the point where your total sales contribution refers to fixed cost at zero profit and loss. This Technique is primarily based on marginal costing, which behaves differently at various levels of output activity.
Project Evaluation for Super App Business
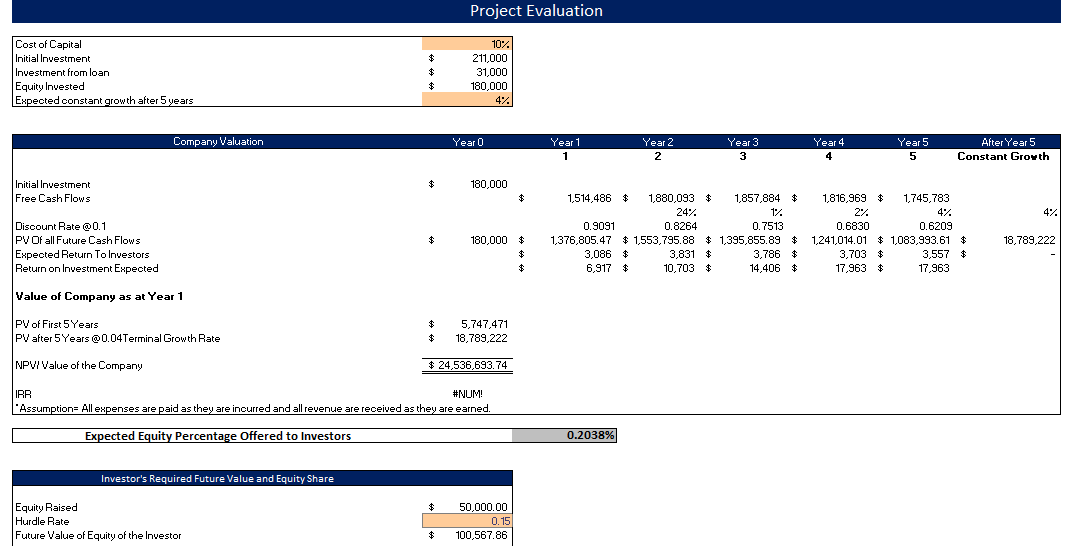
Since the table calculates Return on Investment, Investor’s Future Equity Share, and Cash Burn Rate Analysis, analyzing the company’s performance becomes easy to capture potential investors.
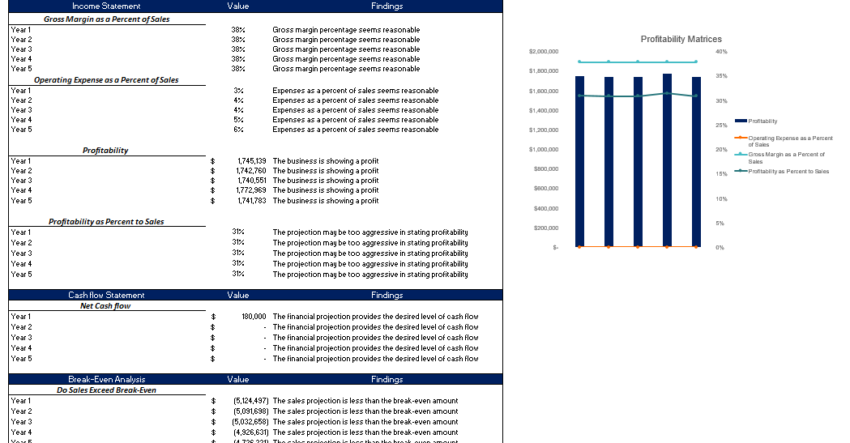
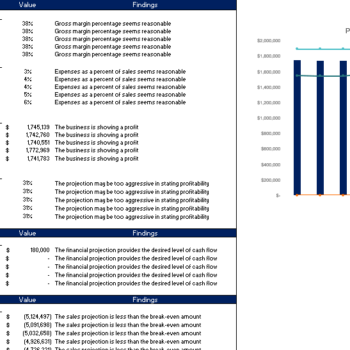
Diagnostic Sheet
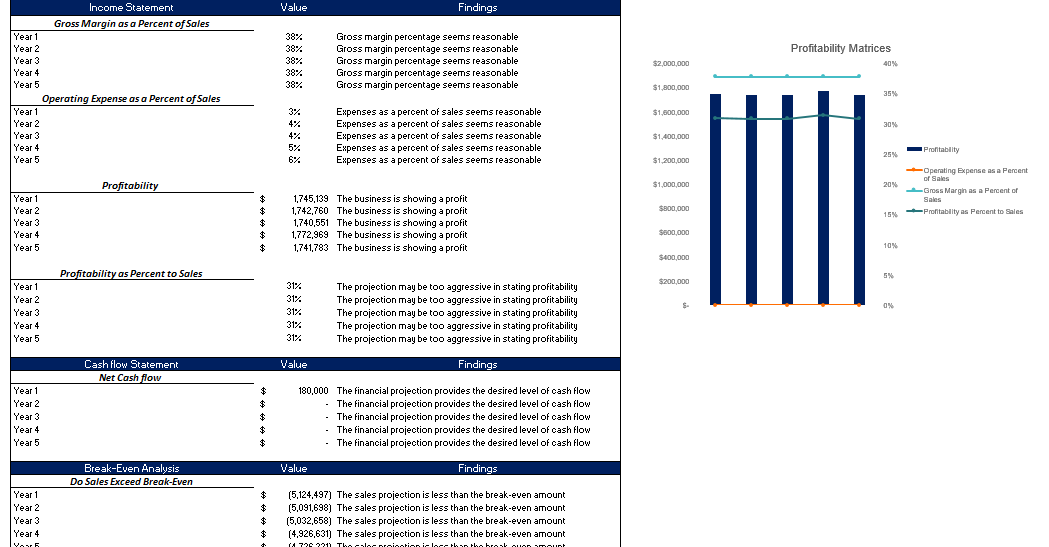
This Diagnostic sheet is a new inclusion to our financial model. This automatically explains the condition of the business. For example, if your company’s profit is 30% of the total sales, the sheet will include favorable comments (As mentioned in the above picture). These comments are based on the financial data in the income statement, balance sheet, and Cash flow. The Diagnostic Sheet is very helpful in giving the company’s insights in just one line.
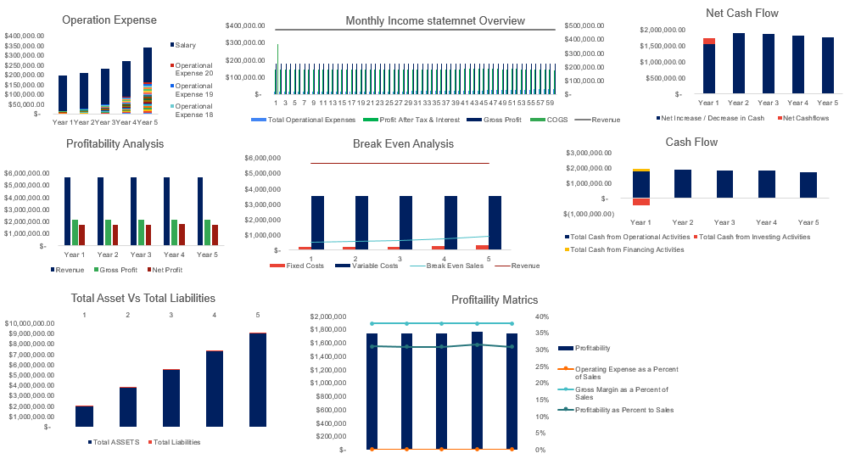
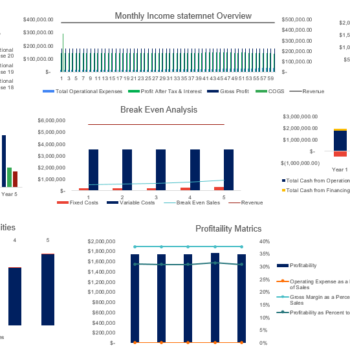
Dashboard

Users and readers respond and process visual graphs better than data. Furthermore, This dashboard provides you with a graphical management tool that enables you to track all your relevant financial KPIs, improve cash flow management, and track expenses, sales, and net revenue in detail to meet and outperform the financial objectives of your business.
Benefits of Super App Excel Financial Model
Encapsulate Company Performance- The Super App Excel Financial Model analysis simplifies a company’s financial statements. It allows the user to express critical profitability and financial position information in just a few numbers. For example, the company’s net profit margin encapsulates the net effect of a company’s revenues and all expenses. It will enable the user to conclude a company’s profitability without going through lengthy accounts statements.
Bottom Line – A Super App Excel financial model can be the key to your company’s better and informed future. Succeeding in planning your Company’s finances well will mean overall success in making wise investment decisions, purchasing the right operating assets, controlling costs, and determining company valuation.
Accommodates Investors – This model provides valuation and performance analysis charts. It enables the investors and banks to clearly determine the company’s actual worth considering lending funds to your company.
Based on Financial Principles – We did in-depth research on the Super App business model to create this financial model with logically correct financial and economic principles and assumptions.
Properly Integrated – The model assumptions and calculation have proper integration. So, the change in the main sheet will automatically lead to the change in all related sheets easily.
Visualization Tool – This Financial model also prepares a clear communication of the quantitative outcomes. As obtained by calculations via various graphs and charts. Therefore, the user does not need to pay much attention to the financial model’s inner workings.
This Product Includes: 1 Excel File
1 review for Super App Excel Financial Model Template
Add a review
You must be logged in to post a review.


Brittany Scott –
I was impressed with how it estimated ongoing operating expenses, monthly sales revenue, and startup investment requirements in a matter of minutes.Highly recommended!