
Why NPV is The Metric that Decides if Your Financial Model Gets Funded
Net Present Value Explained: The Formula Investors Actually Check First
An investor does not read your financial model line by line. They scroll to one number: the net present value. If it is positive, they keep reading. If it is negative or missing, the conversation is often over before it starts.
Building a financial model in excel means working with dozens of formulas and assumptions. NPV is the one that turns all of those inputs into a single yes-or-no signal. Get the discount rate wrong, mix up the Excel functions, or skip the sensitivity check, and the number you hand to an investor can be misleading. This holds true even when every other tab in the model looks polished.
What net present value actually measures
Net present value is the sum of every future cash flow a project or business is expected to generate. Each cash flow is discounted back to today’s dollars, then the initial investment is subtracted. It answers a narrower question than people assume: not “will this be profitable,” but “will this be more profitable than simply investing the money elsewhere at the required rate of return.”
That distinction matters. A project can generate a solid accounting profit and still have a negative NPV. This happens when the return it produces is lower than what the capital could have earned in an alternative investment of similar risk. NPV is a relative measure of value creation, not a raw profitability count.
The NPV formula, without the jargon
The standard formula is:
NPV = Σ [Cₜ / (1 + r)ᵗ] − C₀
Where Cₜ is the cash flow in period t, r is the discount rate, and C₀ is the initial investment. In plain terms: take each future cash flow and shrink it by how far away it is and how risky it is. Add those shrunk values together, then subtract what you had to spend to get the project started.
The “shrinking” step is the part people underestimate. Two projects with identical cash flow totals can have very different NPVs purely because of when the cash arrives and how risky it is judged to be.
Choosing the right discount rate
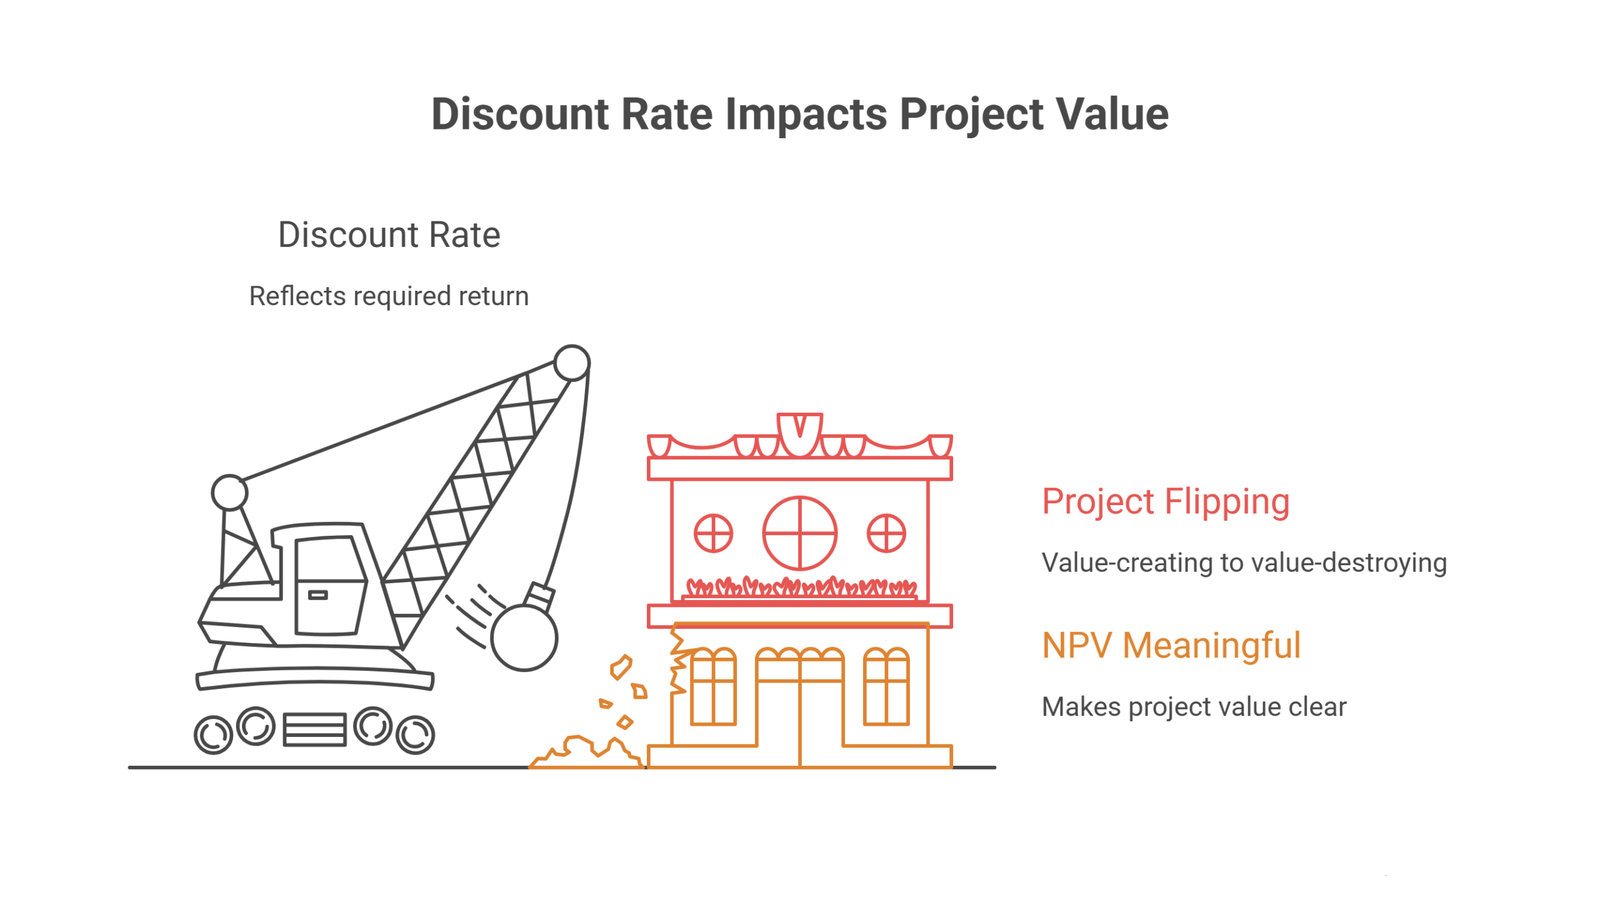
This is where most financial models in Excel go wrong. The discount rate is not a placeholder number. It is what makes NPV meaningful, and picking it carelessly can flip a project from value-creating to value-destroying on paper.
Most companies use their weighted average cost of capital (WACC) as the discount rate for company-wide valuations. It reflects the blended return required by both debt and equity holders. The formula is:
WACC = (E/V × Re) + (D/V × Rd × (1 − Tc))
Where E and D are the market values of equity and debt, V is total capital, Re is the cost of equity (often estimated using CAPM), Rd is the pre-tax cost of debt, and Tc is the corporate tax rate.
A few practical rules keep this step honest:
- Use market values for the equity and debt weights, not book values. Book values reflect historical accounting entries, not what the capital is actually worth today.
- Adjust the discount rate up for riskier projects and down for safer ones. A single company-wide WACC applied to every project understates the risk of a brand-new market entry and overstates the risk of a low-risk equipment upgrade.
- Stay consistent with inflation. If your cash flows are in nominal terms, your discount rate needs to be nominal too. Mixing real cash flows with a nominal discount rate, or the reverse, is one of the fastest ways to produce a distorted NPV.
| Discount rate | Best used for |
| Risk-free rate | Government bonds, near-certain cash flows |
| Cost of debt (after-tax) | Debt-only or highly leveraged projects |
| Cost of equity (CAPM) | Equity-funded projects, startup valuations |
| WACC | Whole-company valuation, blended capital structure |
| Project-specific hurdle rate | Individual projects with a different risk profile than the core business |
NPV in Excel: the mistake that quietly inflates your numbers
Excel gives you two functions for this: NPV and XNPV. The regular =NPV() function assumes all cash flows land at even, regular intervals. The =XNPV() function lets you assign an actual date to each cash flow. This matters whenever your projections do not fall neatly on annual or quarterly boundaries.
The bigger issue is not which function to use. It is how people use it. Excel’s =NPV() function only discounts the cash flow series you feed it. It does not subtract your initial investment for you. If you include the initial outlay as the first value inside the NPV formula, Excel treats it as a period-1 cash flow and discounts it by one period. This understates the true cost and overstates your NPV.
The correct approach is always:
=NPV(rate, CF1:CFn) − Initial Investment
Subtract the initial investment outside the function, in a separate cell reference, every time. This single habit prevents one of the most common overstated-NPV errors in financial models built in Excel.
A worked example
Suppose a project requires an investment of $100,000 today and is projected to return $20,000 per year for seven years. At a 10% discount rate, the calculation looks like this:
| Year | Cash flow | Discount factor (10%) | Present value |
| 0 | -$100,000 | 1.000 | -$100,000 |
| 1-7 | $20,000/yr | 4.868 (annuity factor) | $97,360 |
| NPV | -$2,640 |
At a 10% discount rate, this project has a slightly negative NPV. That means it would not clear the required rate of return. Lower the discount rate to 8%, or extend the cash flow period, and the same project can flip positive. This is exactly why the discount rate assumption deserves more scrutiny than most models give it.
NPV vs IRR: when they disagree and which one wins
The internal rate of return (IRR) is the discount rate at which a project’s NPV equals exactly zero. It answers a related but different question. Not “how much value does this create,” but “what rate of return does this investment actually deliver.”
Most of the time, NPV and IRR point to the same decision. But when you are comparing two mutually exclusive projects of different sizes or durations, they can disagree. A smaller project might show a higher IRR simply because a smaller base is easier to generate a high percentage return on. A larger project can still create more total value in dollar terms despite the lower percentage.
When the two conflict, NPV is the more reliable decision-maker for capital budgeting. It measures value in absolute dollars rather than a percentage rate. IRR remains useful as a sanity check and for comparing projects of similar size, but it should not override NPV when the two disagree. Our project evaluation guide walks through this comparison with additional worked examples.
Advantages and limitations of NPV in a financial model
| Advantages | Limitations |
| Accounts for the time value of money | Highly sensitive to the discount rate assumption |
| Expresses value creation in absolute dollars, not percentages | Requires forecasting cash flows years into the future |
| Works for irregular cash flows using XNPV | Can be manipulated by adjusting assumptions to produce a desired result |
| Directly comparable across projects of different sizes | Assumes a constant discount rate over the full project life |
| Widely accepted by investors and lenders as the standard capital budgeting metric | Does not capture strategic or second-order effects outside the cash flow forecast |
None of these limitations make NPV less essential. They make the assumptions behind it worth documenting and stress-testing before you present the number to anyone outside your team.
Applying NPV to your financial model
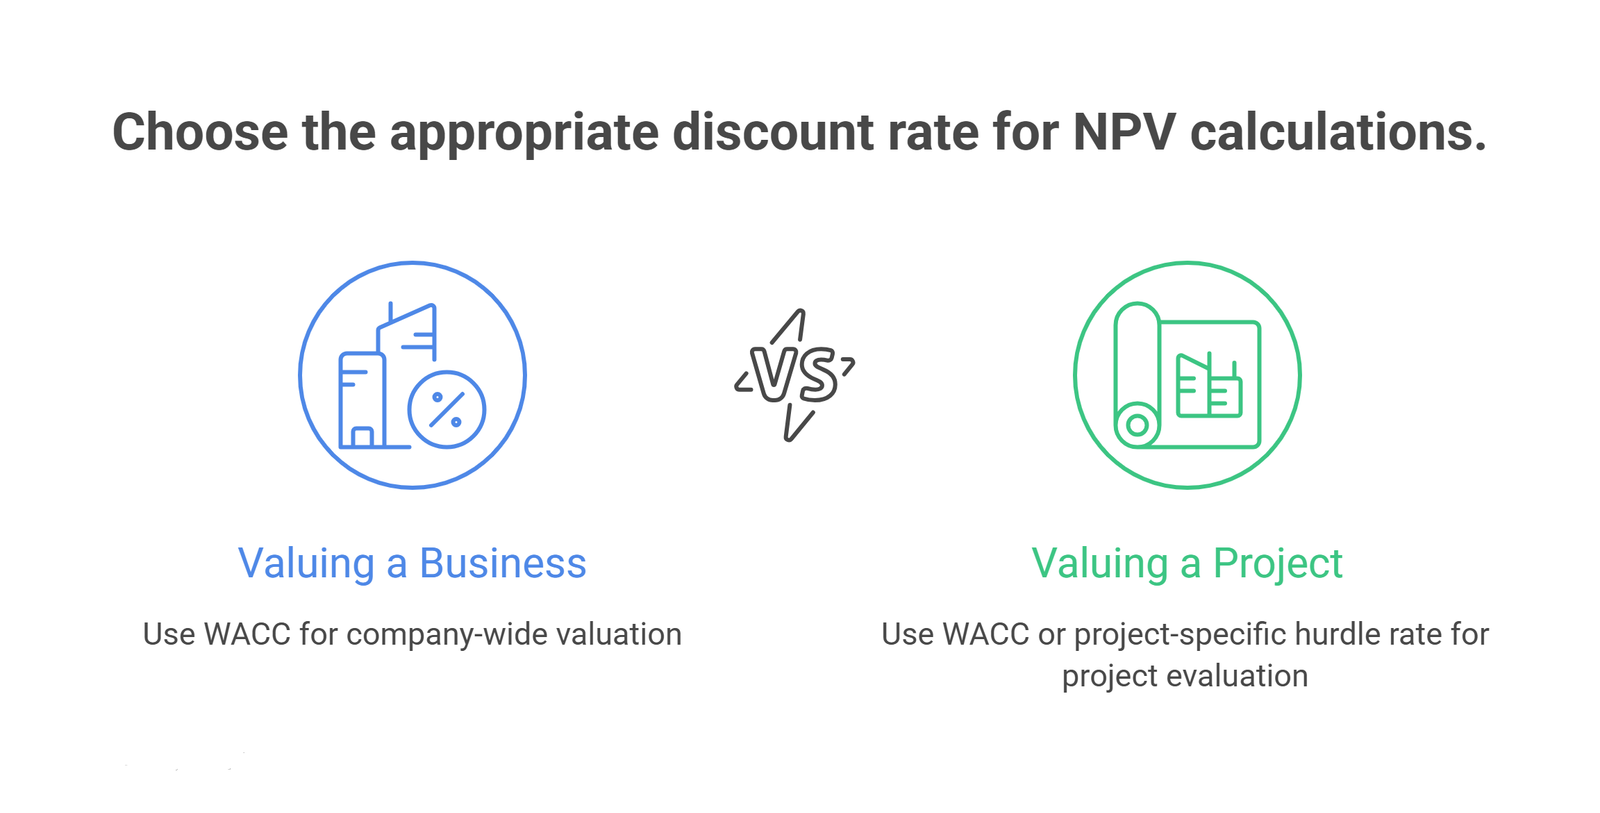
There are two common applications, and they call for slightly different discount rate choices.
Valuing a business. Building a discounted cash flow model for a whole company means forecasting free cash flow to the firm across a five-year horizon. You add a terminal value beyond that period, then discount everything at the company’s WACC. This is the backbone of most business valuations prepared for investors, acquirers, or internal planning.
Valuing a project. Evaluating a single project inside an already-operating business is more contained. You forecast free cash flow for the life of the project only, without a terminal value. Discount it at either the company’s WACC or a project-specific hurdle rate if the risk profile differs meaningfully from the core business.
Running a sensitivity analysis on the discount rate and growth assumptions shows how much your NPV moves if reality lands a little worse than your base case. That is usually the first question a serious investor will ask.
Frequently Asked Questions
Should I use NPV or IRR to compare two projects?
Use NPV as the primary decision metric, especially when comparing projects of different sizes. IRR is a useful secondary check but can be misleading when project scales differ significantly.
What discount rate should a startup use for NPV?
Startups without an established capital structure often use a higher hurdle rate than an established company’s WACC, to reflect the added risk of unproven cash flows. Rates in the 20-40% range are common for early-stage venture-backed companies. The right figure still depends on the sector and stage.
Why does my NPV change so much when I adjust the discount rate slightly?
NPV is highly sensitive to the discount rate, especially for projects with cash flows spread far into the future. A one or two percentage point change in the discount rate can meaningfully shift the result. This is why documenting and defending that assumption matters as much as the cash flow forecast itself.
Is a positive NPV always a green light to proceed?
A positive NPV means the project is expected to create value above your required return. It should still be weighed against liquidity needs, strategic fit, and execution risk. NPV is one input into a capital allocation decision, not the entire decision.
What is the difference between NPV and XNPV in Excel?
NPV assumes evenly spaced cash flows, typically annual or quarterly. XNPV lets you assign a specific date to each cash flow. This produces a more accurate result when your projections do not fall on regular intervals.
NPV for your financial model: the bottom line
NPV is the single number most investors and lenders use to judge whether your model holds up. Getting the formula right is the easy part. The discount rate, the correct Excel functions, and honest stress-testing of the assumptions behind both are what separate a financial model that gets funded from one that gets questioned.
Building this correctly from the start, or reviewing a model that already exists, is exactly the kind of work our financial modeling team handles daily for founders preparing to raise capital.
Get a financial model built around a defensible NPV, not just a plausible one. Book a free consultation with Oak Business Consultant.