TAM, SAM, SOM: What They Really Reveal Beyond The Pitch Deck
TAM, SAM, SOM: What They Actually Tell You Beyond The Pitch Deck
Most founders learn TAM, SAM, and SOM as three numbers to calculate once, drop into a pitch deck, and never look at again. That is the single biggest reason market sizing loses its value. These three figures are not a one-time fundraising formality. Read correctly, they tell a business where to hire, where to spend, when a strategy is working, and when it has quietly stopped working. For a full walkthrough of how to actually calculate each number, see TAM, SAM, SOM: how to define and capture your market share. This piece is about what to do with the numbers once you have them.
The real question each number answers
Strip away the acronyms and each metric is really answering a different question about the business, not just a different slice of the market.
TAM answers: is this opportunity big enough to be worth pursuing at all? SAM answers: given our actual product and reach today, who can we realistically sell to? SOM answers: what will we actually win, this year, with the team and budget we have right now? Founders who treat all three as fundraising trivia miss that SOM in particular is really a forecast, and forecasts are meant to be tested against reality, not filed away after the pitch.
Why founders misuse these numbers even after calculating them correctly
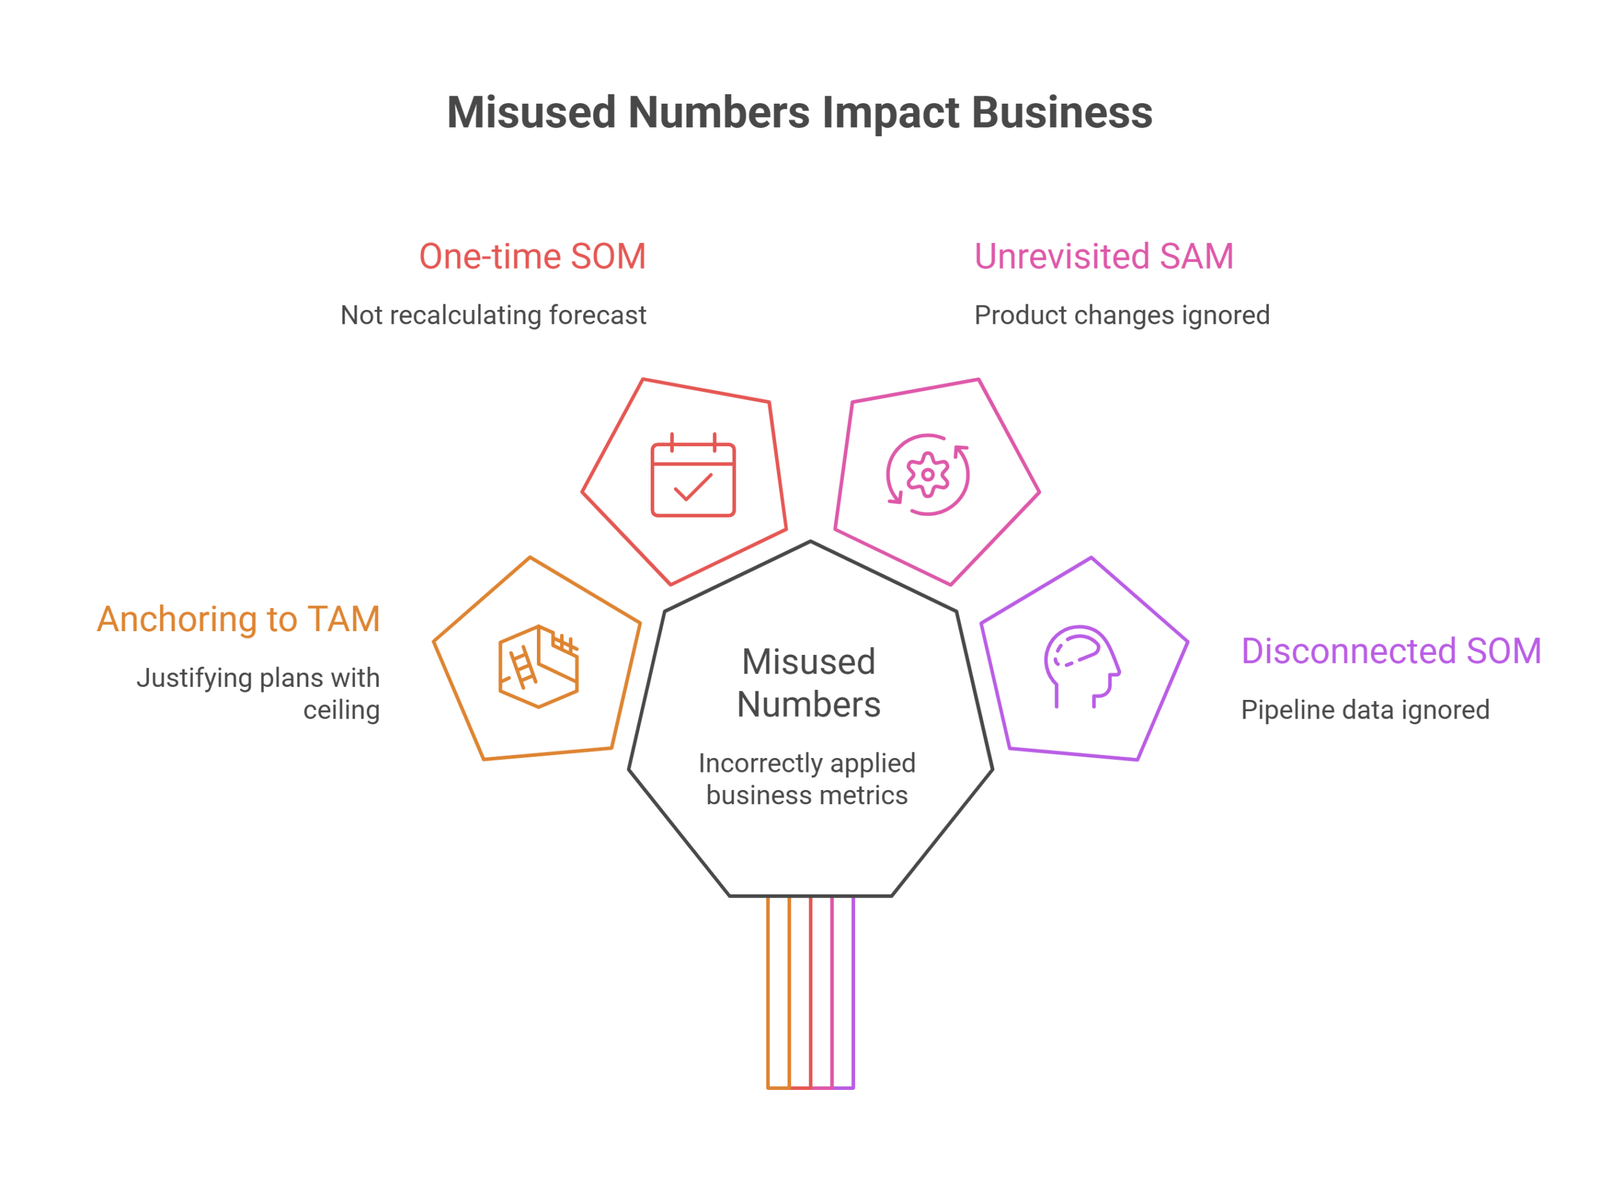
Getting the math right is not the same as using the numbers correctly. Three patterns show up repeatedly, and none of them is a calculation error.
Anchoring every decision to TAM. A founder who quotes TAM in an investor meeting and then quietly uses that same figure to justify a hiring plan or a marketing budget has confused the ceiling with the plan. TAM never pays a salary. SOM does.
Treating SOM as a one-time number. SOM is a forecast for a specific window, usually twelve to thirty-six months. Once that window passes, the number needs to be recalculated against what actually happened, not carried forward untouched into the next year’s plan.
Never revisiting SAM as the product changes. SAM is defined by what the current product and distribution can reach. When a company adds a new feature, enters a new geography, or shifts its pricing model, SAM shifts with it. A SAM calculated before a major pivot is describing a business that no longer exists.
Disconnecting SOM from actual pipeline data. SOM should be reconciled against what sales and marketing are actually seeing: real pipeline, real conversion rates, real deal sizes. A SOM that lives only in a spreadsheet, untouched by CRM data, tends to drift further from reality every quarter it goes unchecked. The moment SOM and pipeline start telling different stories, one of them is wrong, and it is worth finding out which before it shapes another budget cycle.
Using SOM to guide hiring, budget, and go-to-market
The most practical use of SOM has nothing to do with investors. It is the number that should set the ceiling on how aggressively a company staffs up, how much it commits to marketing spend, and how ambitious its sales targets can honestly be.
A company with a SOM of $3 million for the year that builds a sales team sized for $10 million in bookings is not being ambitious, it is setting itself up for a painful correction. Conversely, a company consistently closing in on its SOM quarter after quarter has a credible case for expanding SAM, whether through a new customer segment, a new region, or a new product line, because it has demonstrated it can convert the market it already has access to.
How the SOM-to-SAM ratio signals execution maturity
One number worth tracking over time that rarely gets discussed: the ratio of SOM to SAM. It is a rough proxy for how much of the reachable market a company is actually capturing, and it tends to follow a pattern as a business matures.
| Stage | Typical SOM as % of SAM | What it signals |
| Early stage, pre-product-market fit | Under 5% | Still validating the offer; low capture is expected and not yet a red flag |
| Growth stage, scaling go-to-market | 5% to 15% | Execution is working; the gap to SAM represents genuine near-term upside |
| Established player in its niche | 15% to 30% | Strong market position; further growth increasingly depends on expanding SAM itself |
| Category leader or near-monopoly | Above 30% | Rare outside of dominant incumbents; usually means SAM was defined too narrowly or competitive dynamics are unusually favorable |
This is a directional signal, not a scientific benchmark, since ratios vary by industry and business model. But a company whose SOM has been flat relative to SAM for several years, without a clear external reason, is showing a stall that the raw dollar figures alone can hide.
How market sizing scrutiny changes from seed to Series B
The bar for defending TAM, SAM, and SOM rises at every funding stage, and founders who prepare the same slide for every round are usually underprepared for at least one of them.
At seed,
Investors mostly want to see that the TAM is large enough to support a venture-scale outcome and that the founder has a coherent, if still assumption-heavy, story for SAM. SOM at this stage is understood to be a rough estimate, since there is little to no sales data yet to ground it.
At Series A
The questions get sharper. Investors expect SAM to be grounded in early customer data rather than pure top-down assumptions, and they will ask how SOM projections compare to actual bookings so far. A SOM that has consistently outpaced or lagged the original forecast becomes a direct topic of discussion, not a footnote.
At Series B and beyond
TAM barely comes up. By this point, investors are underwriting the company’s ability to execute against SAM, and SOM is expected to be reconciled closely against real revenue and pipeline data. A founder still leaning on a top-down TAM slide at this stage signals that the growth story has not matured alongside the business.
Recognizing which stage a company is in, and adjusting the level of rigor behind SAM and SOM accordingly, prevents the common mistake of walking into a Series B conversation with seed-stage market sizing.
By the time a market sizing question comes up in a serious investor conversation, the investor has usually already sanity-checked the TAM independently. What they are actually testing is whether the founder understands their own SAM and SOM well enough to defend the assumptions behind them under pressure.
A founder who can explain exactly why their SAM excludes certain segments, and exactly what would need to be true for SOM to double next year, comes across as someone who has actually run the business rather than someone who hired an analyst to fill in a slide. This is also why SOM tends to get more scrutiny than TAM in later funding rounds. Early on, investors are buying the size of the opportunity. Later, they are buying evidence that the team can capture it, which is the same evidence that feeds into a credible business valuation as the company matures.
What this looks like in practice
Consider a B2B software company that raised a seed round on a SAM of $200 million and a first-year SOM of $2 million, roughly 1% of SAM. In year one, actual revenue landed at $1.6 million, short of the forecast but close enough to be credible. Rather than quietly rolling the original $2 million forward, the team reforecast SOM for year two based on the sales cycle length and win rate they had actually observed, landing on $3.5 million.
By year three, the company was consistently converting close to its forecasted SOM each quarter, a signal that its go-to-market motion was working within the SAM it had defined. That consistency, not the original TAM figure from the seed deck, became the strongest evidence in the Series B conversation. The company also used it internally to justify entering a second vertical, since it could show investors and its own board that the current SAM was close to being fully captured, and growth from here required expanding the addressable market itself rather than working harder within the existing one.
This is the difference between market sizing as a one-time exercise and market sizing as an operating habit: the numbers become a record of whether the business is doing what it said it would do, not just a number used once to open a fundraising conversation.
Signals that a market sizing exercise needs a redo
A few warning signs suggest it is time to revisit TAM, SAM, and SOM, ideally with fresh market research rather than reused assumptions:
- SAM has not been recalculated since a major product, pricing, or geographic change
- SOM projections have missed actuals by a wide margin for two or more consecutive periods, without an updated explanation why
- A new competitor or regulatory shift has materially changed who can realistically be served
- The business is preparing for a new funding round and the last market sizing exercise predates the current product
Frequently Asked Questions
Should marketing and sales teams look at these numbers, not just founders and investors?
Yes. SOM in particular should inform sales quotas and marketing budgets directly, since it represents the realistic ceiling on what the current go-to-market motion can capture in a given period.
How often should SOM be reforecast?
At least once a year, and immediately after any event that changes distribution, pricing, or competitive positioning, since those are the factors SOM depends on most directly.
Is a low SOM-to-SAM ratio always a bad sign?
No. Early-stage companies are expected to have a low ratio while they are still proving the business model. It becomes a concern only when the ratio stays flat for multiple years without an external explanation.
Does SAM ever need to shrink?
Yes. If a company narrows its focus, exits a segment, or a competitor closes off part of the market, SAM should shrink to reflect that. Treating SAM as something that only ever grows leads to overstated market opportunity.
How does market sizing scrutiny change between seed and Series B?
Seed investors mostly test whether TAM is large enough and SAM is coherent. By Series B, TAM barely matters, and investors expect SAM and SOM to be closely reconciled against actual sales data rather than assumptions.
How do I know if my SOM is disconnected from reality?
Compare it against actual pipeline and closed revenue each quarter. If SOM and CRM data tell noticeably different stories for more than one period in a row, the SOM forecast needs to be rebuilt from current sales data rather than carried forward.
Conclusion
TAM, SAM, and SOM are worth calculating correctly, but the real value shows up afterward, in how consistently those numbers get used to set hiring plans, budgets, and growth targets that match reality. A business that revisits these figures regularly catches drift before it becomes a crisis. A business that calculates them once for a pitch deck and never looks again is flying on assumptions that may no longer be true.
If your team needs help turning market sizing into an actual operating plan, Oak’s Fractional CFO services can build the budgeting and forecasting discipline around your SOM. For founders preparing to raise, pairing that with an investor pitch deck built on defensible market sizing makes the numbers hold up under real scrutiny.