


The Sensitivity Analysis Model Excel Template is a powerful tool that consolidates input data into detailed reports and sensitivity analysis. It generates income statements for 5 years, both monthly and yearly, and includes sales forecasts, revenue evaluation, and scenario analysis. This template helps you plan effectively, offering insights through graphs and visual representations for better performance analysis and decision-making.
-40%


Sensitivity Analysis Excel Template
Original price was: $50.$30Current price is: $30.
Mega Sale Ends In
Frequently Bought Together
- Description
- Reviews (11)
Description
Unlock the Power of Financial Forecasting – Comprehensive Sensitivity Analysis Financial Model
Are you looking to make data-driven business decisions with confidence? The Sensitivity Analysis Excel Financial Model Template is your ultimate tool for financial forecasting and risk analysis. Designed for financial analysts, business owners, and investors, this spreadsheet model helps you understand how key assumptions impact profitability, cash flow, and share price—ensuring you stay ahead in an unpredictable market.
What This Model Helps You Analyze and Forecast
A Sensitivity Analysis Excel Template is a powerful tool designed for financial analysis to help businesses and investors evaluate how changes in key assumptions impact financial outcomes. This model allows users to conduct risk analysis, understand the impact on profit, and make informed decisions based on different financial scenarios.
By using this spreadsheet model, businesses can:
- Forecast future sales and sales revenue.
- Analyze variable costs, profit margin, and annual sales.
- Perform scenario analysis to assess business risks.
- Evaluate internal rate and rate of return for business ventures.
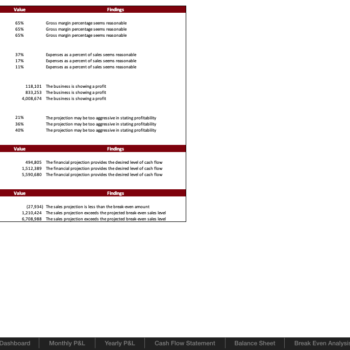
- Identify breakeven points using breakeven analysis.
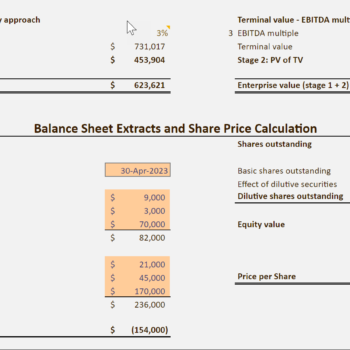
- Assess the effect of revenue growth assumptions on share price.
Key Features of Sensitivity Analysis Excel Template
1. Input Sheet
The plug-and-play template comes with an input sheet where users enter key assumptions. This sheet contains input variables such as sales volume, annual growth rate, charge of sales, and other relevant variables that drive financial projections.
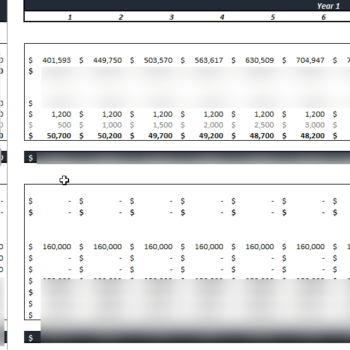
2. Sales Forecast
The Sales Forecast section projects revenue growth based on historical data and key assumptions about consumer behavior and market trends. Users can test different growth rates and evaluate how they influence overall financial performance.
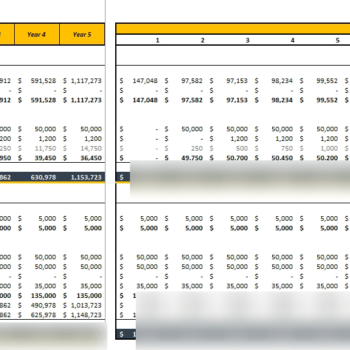
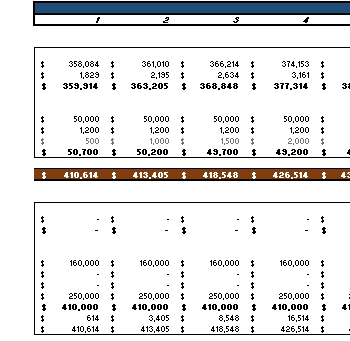
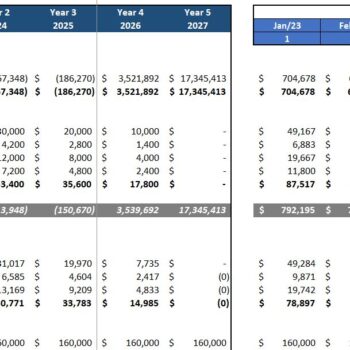
3. Income Statement
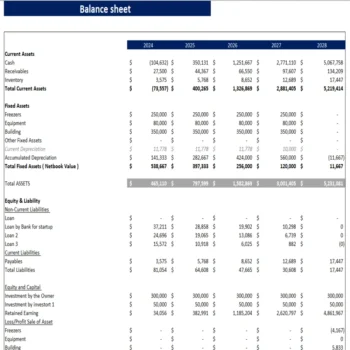
This section provides a detailed breakdown of financial performance, including sales revenue, profit margin, cash flow analysis, and operating costs. By adjusting independent variables, users can assess the financial health of their business projects.
4. Sensitivity Analysis
This section is the core of the model, featuring One-Way Sensitivity Analysis and Two-Way Sensitivity Analysis to examine how changes in independent variables affect dependent variables like profit margin, cash flow, and share price. The sensitivity table allows users to input different assumptions and evaluate the financial implications.
5. Dashboard
The dashboard provides a visual appeal to the financial model, presenting key insights through charts and graphs. This section helps stakeholders quickly understand how changes in assumptions affect financial outcomes.
Who Can Benefit from This Financial Model?
This model is ideal for:
- Financial analysts conducting risk analysis.
- Entrepreneurs evaluating business ventures.
- Investors assessing return potential.
- Business owners optimizing business finances.
- Consultants advising on financial planning.
Make Informed Decisions with Confidence
The Sensitivity Analysis Excel Template is a real-world finance and research tool, offering a wide range of analysis capabilities. It helps users optimize financial decision-making through powerful tools and extensive financial models.
FAQs
1. What is One-Way Sensitivity Analysis?
One-Way Sensitivity Analysis evaluates how a single independent variable affects a dependent variable, such as how sales revenue changes with a shift in sales volume.
2. How does Two-Way Sensitivity Analysis work?
Two-Way Sensitivity Analysis examines how two input variables interact to impact an output variable, allowing for a more comprehensive risk assessment.
3. Can I customize the input variables?
Yes, the plug-and-play template allows full customization of key assumptions, including annual growth rate, pricing, and cost structure.
4. How does this model help with scenario analysis?
By adjusting the row input cell and column input cell, users can create different financial scenarios to understand potential risks and opportunities for their business.
This guide to sensitivity analysis provides a structured approach to financial forecasting, making it an indispensable resource for professionals in a range of fields.
Terms of Use:
Oak Business Consultant and our range of products, including this financial model template, are not endorsed by or officially connected to any specific software or platform unless explicitly stated. Your purchase allows you a SINGLE LICENSE FOR PERSONAL OR BUSINESS USE, exclusive to your individual or company needs. Redistribution, resale, or sharing of the files and templates is strictly prohibited. Please direct others to our shop if you find our financial model valuable and wish to recommend it.
NOTE:
Our product is a digital Excel file. Due to the nature of digital products, we cannot offer returns or exchanges. We encourage you to address any queries or seek clarification before finalizing your purchase.
Walk-Through Video
11 reviews for Sensitivity Analysis Excel Template
Add a review
You must be logged in to post a review.


WIlls Will –
I highly recommend it to any business owner.
Thomas Sarcst –
Template is exactly what I was looking for. It’s well-organized, easy to modify, and has helped me keep my financials in check.Highly recomended
Riche Elin –
This template made accounting much easier for me. It’s detailed, flexible, and easy to customize.
Mill Hunt –
If you’re looking to improve your financial organization, This Template is a Great Investment.
Revan Mnik –
I’m very impressed with its functionality and ease of use.
Jime Agora –
This Chart of Accounts template is excellent! It’s well-designed and has saved me a lot of time in managing my business’s financial records.
Milleri Mocks –
I needed a template to organize my company’s accounts, and this one was a perfect fit. It’s simple yet comprehensive, and the customization options allowed me to tailor it exactly to my business needs.
Chloe Harris –
I needed a template to organize my company’s accounts, and this one was a perfect fit. It’s simple yet comprehensive, and the customization options allowed me to tailor it exactly to my business needs.
Noon Khan –
This template is a great tool for setting up a solid financial structure. It’s clear, easy to navigate, and comprehensive. It has definitely helped me manage my accounts more effectively.
Bin Mughees –
As a financial consultant, I often need to provide clients with detailed sensitivity analysis, and this template has made my job so much easier. It’s comprehensive and covers all the key areas I need. What I love most is the flexibility to tweak scenarios on the fly and see immediate results. This is definitely a must-have tool for any professional looking to deliver high-quality analysis.
Sarah L –
I struggled with sensitivity analysis before, but this template breaks it down into manageable steps. It’s clear, intuitive, and perfect for anyone looking to dive deep into financial scenarios.