


EFM Excel Financial Model Template


Original price was: $300.$150Current price is: $150.
The EFM Excel Financial Model template is an accurate, dynamic financial plan for customer feedback businesses that provides you a financial management tool to track all your relevant financial KPIs, improve cash management, and allow you to track expenses, sales, and net revenue in detail to meet and outperform the financial objectives of the business. EFM Excel Financial Model contains financial ratio analysis and contains a DCF valuation framework to monitor its actual worth. Moreover, anyone can easily edit this financial model with basic knowledge of excel and finance by adding information itself. All metrics will be updated automatically after made adjustments in the input sheet systematically.
Frequently Bought Together
- Description
- Reviews (1)
Description
EFM Excel Financial Model Template
The EFM Excel Financial Model is highly adaptable and dynamic for forming a 5-year monthly and yearly 3-statement (Income Statement, Balance Sheet, and Cashflow Statement) financial projection for a startup or existing agency. This model also consolidates a discounted cash flow valuation calculation by using the projected Free Cash Flows. The EFM Excel Financial Model Template also calculates the financial metrics required by investors to estimate business profitability.
One can easily edit our EFM financial model with basic knowledge of excel and finance by adding information itself. All metrics will be updated automatically after made adjustments in the input sheet. Here you will find all the necessary financial and valuation reports, including Cash flow, break-even, Startup Cost plan, Balance sheet, and income statement. A high-quality financial model for an event agency makes it possible to foresee a profit for the future to come and enables the user to make wise decisions.
How It Works
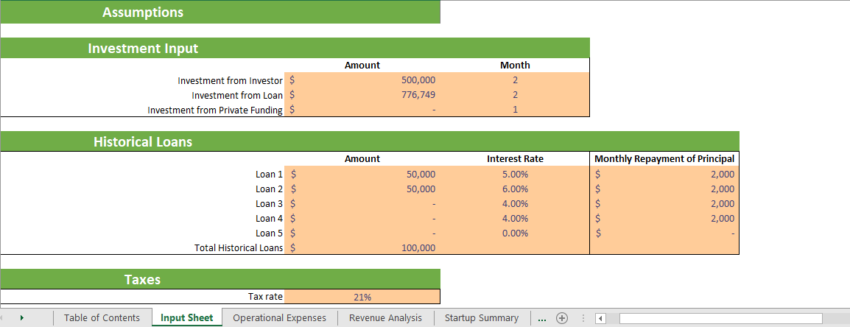
On the Input tab, you can feed the financial information for the model, such as sales price, cost, expenses, etc. Inputs are always depicted with a Peach fill and grey letters, calls up (that is, direct links from other cells) are filled in grey with black letters, while calculations are depicted with white fill and black characters.
In the sensitivity analysis tab, you can see a high-level report with the main business scenarios. The tab shows how the company’s profit will look in case of any uncertainty. For example, if the cost or expenses increased by 10%.
Another useful tab is the break-even analysis, where you can see the items needed to be sold every day and their currency value to break even.
Calculations: The revenues are calculated based on the product or services sold, promotion, pricing, promotions, and marketing campaign, deducting the business variable and fixed costs. Based on the assets financed and the gearing of the financing, the interest and depreciation will calculate. With the help of working capital assumptions, we have measured the impact on business cycles.
In the PnL Monthly tab: everything aggregates here into the relevant statements: profit and loss, balance sheet, and cash flow every month.
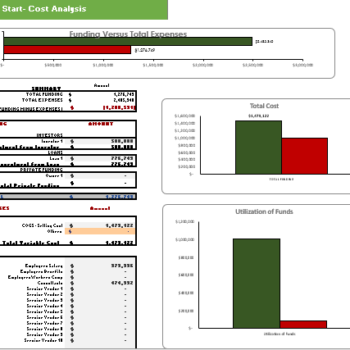
The Dashboard tab: Various graphs present the revenues, cash analysis, break-even analysis, sensitivity, assets vs. liabilities, startup summary, etc.
EFM Financial Model has these elements:
- The growth rate of Customers, at what percentage of your customers are purchasing your services.
- Percentage of Converted Repeat Customers – At what percentage of new total customers come to your website repeatedly?
- Average Payable and Receivable days your business is following.
- Cost of Good Services.
- Average Price of different categories of services.
- Percentage of each product category purchased by customers related to the total customers.
- The number of hours the average customer takes while taking brainstorming consultation.
- Tax Rate
EFM Excel Financial Model Template has important elements:
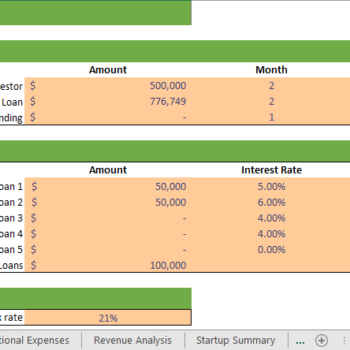
Input Sheet:
This financial model template contains inputs that, when changed, impact the calculations and, therefore, the changes are applied to all relevant. As a result, this. As a result, this financial model always has built-in flexibility to display different outcomes or final calculations based on this sheet’s changes.
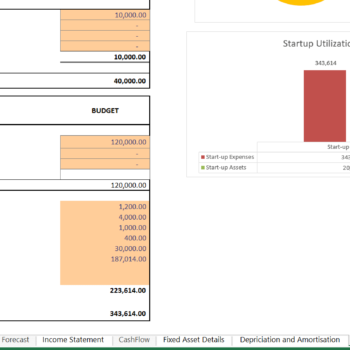
Startup Summary
This sheet provides you and your investors with an analysis of all the investment requirements of a new start-up. It helps the business present a snapshot of the company to prospective investors and raise capital.
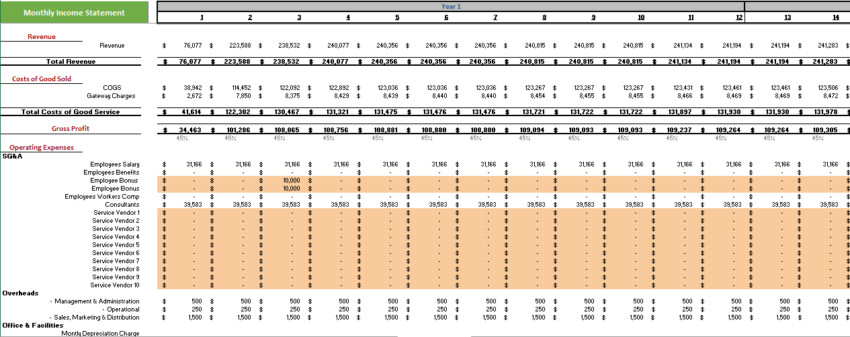
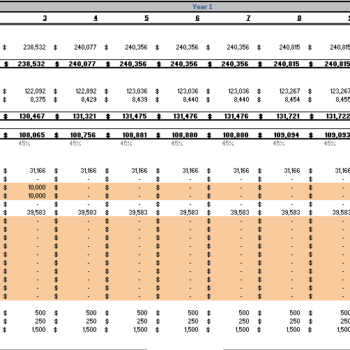
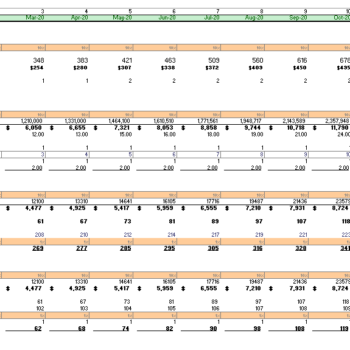
Monthly & Yearly Income Statement of EFM Excel Financial Model Template

 The monthly Income Statement sheet of the EFM Excel Financial Model is perfect for those who require regular reporting and details. Additionally, the income statement contains all revenue streamlines with gross earnings and net earnings linked with a revenue analysis sheet to ensure accurate reporting. Oak Business Consultants understands every EFM business’s goal. Therefore, we have developed a mechanism that helps business owners determine whether they are making profits or otherwise.
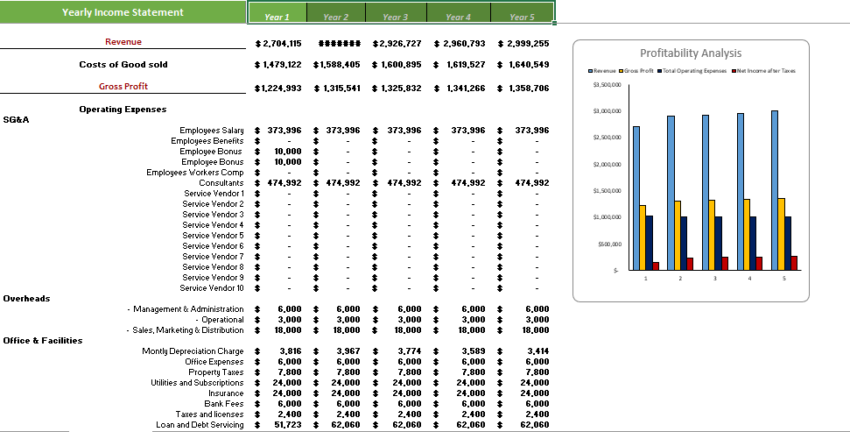
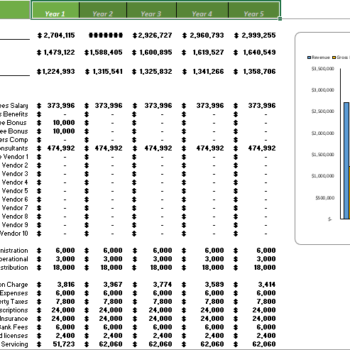
Furthermore, the Yearly Income Statement gives you complete insights into revenue and general & administrative expenses. The Yearly Income Statement also contains several graphs, assumptions, ratios, margins, net profit, earnings, cost of services, and profit after tax.
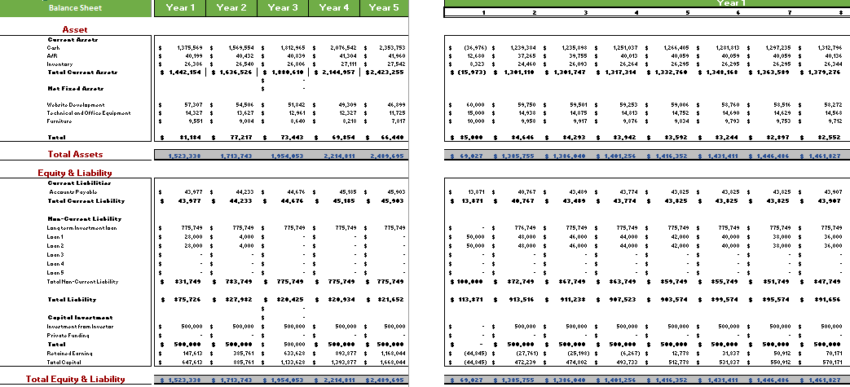
Balance Sheet
 This balance sheet enables you to analyze your position of current assets, fixed assets, liabilities, and equity. This also allows you to monitor your accounts receivable, accounts payable, accrued expenses, etc. Therefore, this specific financial model gives you the perfect space to analyze your key financial balance accounts.
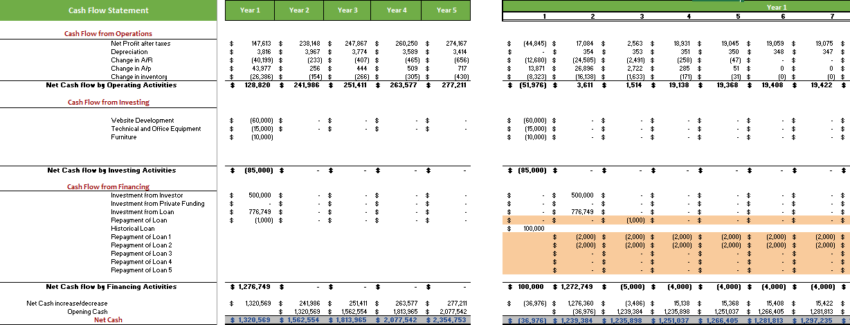
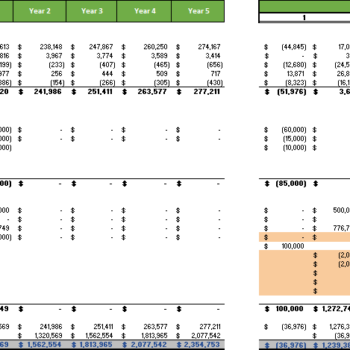
CashFlow:
 The Cash Flow statement is one of the most important financial statements because each business’s main goal is to generate cash flow. This shows how much business has consolidated money and how much is not enough to attract additional financing. This sheet also contains a dedicated sheet to monitor and analyze your company cash-ins and out. This cash flow statement is based on several keys: Payableayable and Receivable Days, yearly income, working capital, long-term debt, net cash, etc. This calculation then computes your net cash flow and beginning and end cash balances. This is a perfect template for your company’s cash flow management.
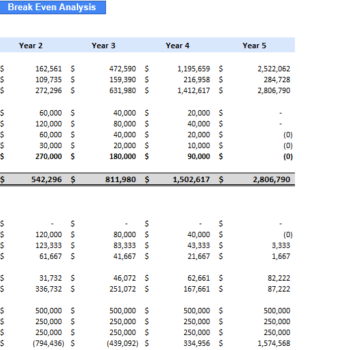
Break-Even Analysis:
The break-even analysis will help you know at a glance the profits generated at the various sales levels. The Break-Even Analysis refers to the point where your total sales contribution refers to fixed cost at zero profit and loss. This Technique is primarily based on marginal costing, which behaves differently at various levels of output activity.
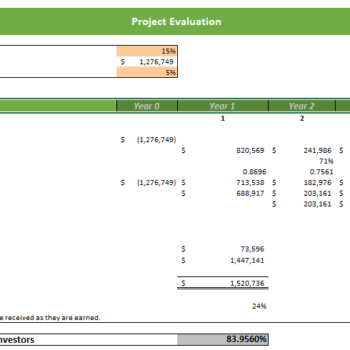
Project Evaluation:
 Since the table calculates Return on Investment, Investor’s Future Equity Share, and Cash Burn Rate Analysis, analyzing its performance makes it easy to capture potential investors.
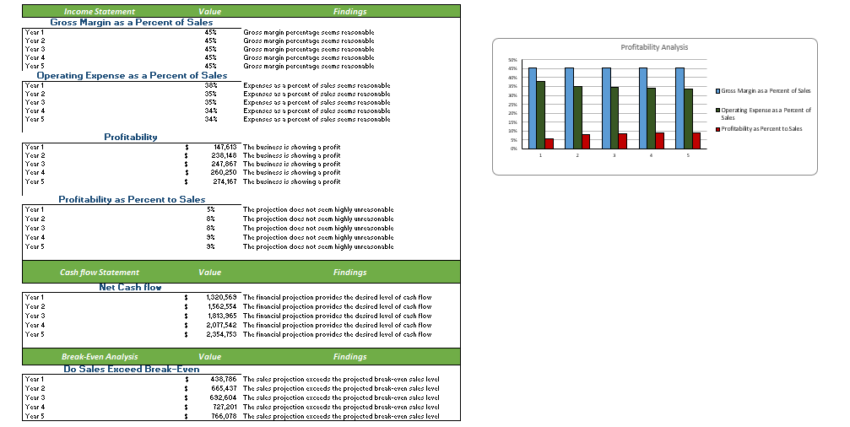
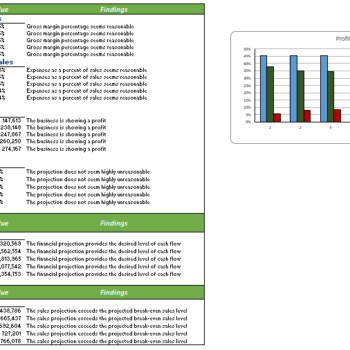
Diagnostic Sheet:
 This diagnostic sheet automatically calculates data such as the profitability ratio, net operating expense ratio to expense, etc., which will provide financial commentary about its financials.
Users and readers respond to and process visual graphs better than data. Furthermore, this dashboard provides you with a graphical management tool that enables you to track all your relevant financial KPIs, improve cash flow management, and track expenses, sales, and net revenue in detail to meet and outperform your business’s financial objectives.
Benefits of EFM Excel Financial Model Template
Encapsulate Company Performance- The EFM Financial Model analysis simplifies a company’s financial statements. It allows the user to express critical profitability and financial position information in just a few numbers. For example, the company’s net profit margin encapsulates the net effect of a company’s revenues and all. Thus, it will enable the user to conclude a company’s profitability without going through lengthy account statements.
Bottom Line – A EFM financial model can be the key to your company’s better and informed future. Succeeding to plan your Company’s finances well will mean overall success in making wise investment decisions, purchasing the right operating assets, controlling costs, and determining company valuation.
Accommodates Investors – This model provides valuation and performance analysis charts. It enables the investors and banks to clearly determine the company’s actual worth considering lending funds to your company.
Based on Financial Principles – We did in-depth research on an EFM financial model. So this financial model has been created with logically correct financial and economic principles and assumptions.
Properly Integrated – The model assumptions and calculations are structurally integrated. So the change in the main sheet will automatically lead to the change in all related sheets easily.
Visualization Tool – This Financial model also prepares a clear communication of the quantitative outcomes. As obtained by calculations via various graphs and charts. Therefore, the user does not need to pay much attention to the financial model’s inner workings.
This Product Includes: 1 Excel File
1 review for EFM Excel Financial Model Template
Add a review
You must be logged in to post a review.


Landon Merser –
I must say it has been a game changer for my business. The accuracy and dynamic nature of the financial plan has allowed me to track all my relevant financial KPIs and manage my cash flow effectively. Highly recommended!