


3D Bio Print Excel Financial Model


Original price was: $350.$195Current price is: $195.
The 3D Bio Print Excel Financial Model provides a user the ability to forecast the future performance of the business. Those who have no idea about financial modeling want to include detailed financial analysis and valuation in their financial model. We have prepared a perfect 3D Bio Print Financial Model template for you which includes all the necessary financial and valuation reports, including Cash flow, break-even, Startup Cost plan, Balance sheet, and Net income statements. This model is perfect for startups and individuals seeking loans or investments. A hassle-free document with no further editing required. Just buy, include numbers, and ready to go!
Frequently Bought Together
- Description
- Reviews (1)
Description
Introduction to 3D Bio Print Excel Financial Model Template
For 3D Printing, the financial projections are incredibly important, especially if it is a hardware producer. This 3D bio print excel financial model focuses on B2C opportunities, such as a business that purchases 3D printers and sells them to generate a profit. By using this 3D Bio Print Excel Financial Model, you can form a 5-year monthly and yearly 3 statement ( Income Statement, Balance sheet, and Cash Flow Statement) financial projection for a startup or existing agency. This model also consolidates a discounted cash flow valuation calculation by using the projected Free Cash Flows.
How To Use Model
On the Input tab, you can feed the financial information for the model, such as sales price, cost, expenses, etc. Inputs are shown in this model with a Peach fill and call-up (direct links from other cells) filled in grey with black letters, while calculations depict white fill and black characters. With the help of working capital assumptions, we have measured the impact on business cycles. In last, the level of the investment. Consider calculating the relevant debt financing.
Moving to the Project Valuation tab, a company valuation is performed by using the free cash flows with discount rates to the firm. Then a series of investment metrics are presented (IRR, NPV, ROE).
The Dashboard tab: Various graphs present the revenues, cash analysis, break-even analysis, sensitivity, assets vs. liabilities, startup summary, etc.
Key Components of 3D Bio Print Excel Financial Model
- Input Sheet
- Revenue and Cost Analysis
- Financial Statements (Includes Monthly and Yearly Income Statement, Cash Flow Statement and Balance Sheet)
- Sales Analysis
- Break-Even Analysis
- Company Valuation
- Sensitivity Analysis
- Financial Ratios
- Dashboard
- Supporting Schedule
Overview of 3D Bio Print Excel Financial Model
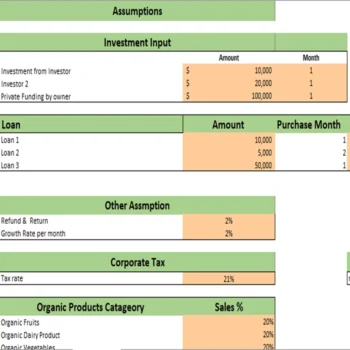
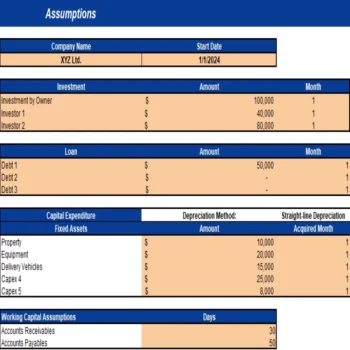
Input Sheet

This financial model template contains inputs that, when changed, impact the calculations and, therefore, the changes are applied to all relevant sheets. This financial model always has built-in flexibility to display different outcomes or final calculations based on this sheet’s changes.
Revenue and Cost Analysis
Financial Projections for 3D Bioprinting Business
This section offers a comprehensive breakdown of the revenue and cost components integral to modeling the financial performance of a 3D bioprinting business. It provides insights into diverse revenue streams, cost structures, pricing assumptions, and sales strategies.
Revenue Streams
The financial model incorporates multiple revenue channels tailored to the unique offerings of a 3D bioprinting business:
- Bio Printing Services: Custom tissue printing and pre-designed tissue models.
- Bio Printer Sales: Revenue from selling bioprinter units.
- Post-Sales Services: Extended warranty and support, consumables, and training/consultation services.
- R&D Partnerships: Income from collaborative research projects and consulting services.
- Licensing Revenue: Royalties from licensed bioprinting technologies.
Cost Structure
To ensure accurate financial projections, the model outlines key cost elements:
- Direct Material Costs: Raw materials required for printing and production.
- Direct Skilled Resource Costs: Salaries and wages of specialized personnel.
- Other Direct Costs: Miscellaneous operational expenses tied to revenue generation.
Pricing Assumptions
The model integrates precise pricing units and rates for each service offering, ensuring realistic revenue forecasts.
Sales and Customer Assumptions
Projections are based on key sales metrics, including starting units per month, periodic growth rates, customer churn rates, and average project durations. These assumptions help forecast revenue trends over time.
Payment Structure
The financial model specifies the payment schedules for projects and services, ensuring alignment with cash flow and revenue recognition practices.

This detailed revenue and cost analysis serves as the foundation for generating financial projections, including revenue, cost of goods sold, gross profit, operating expenses, and net income. It ensures that all financial assumptions are both realistic and aligned with industry benchmarks.
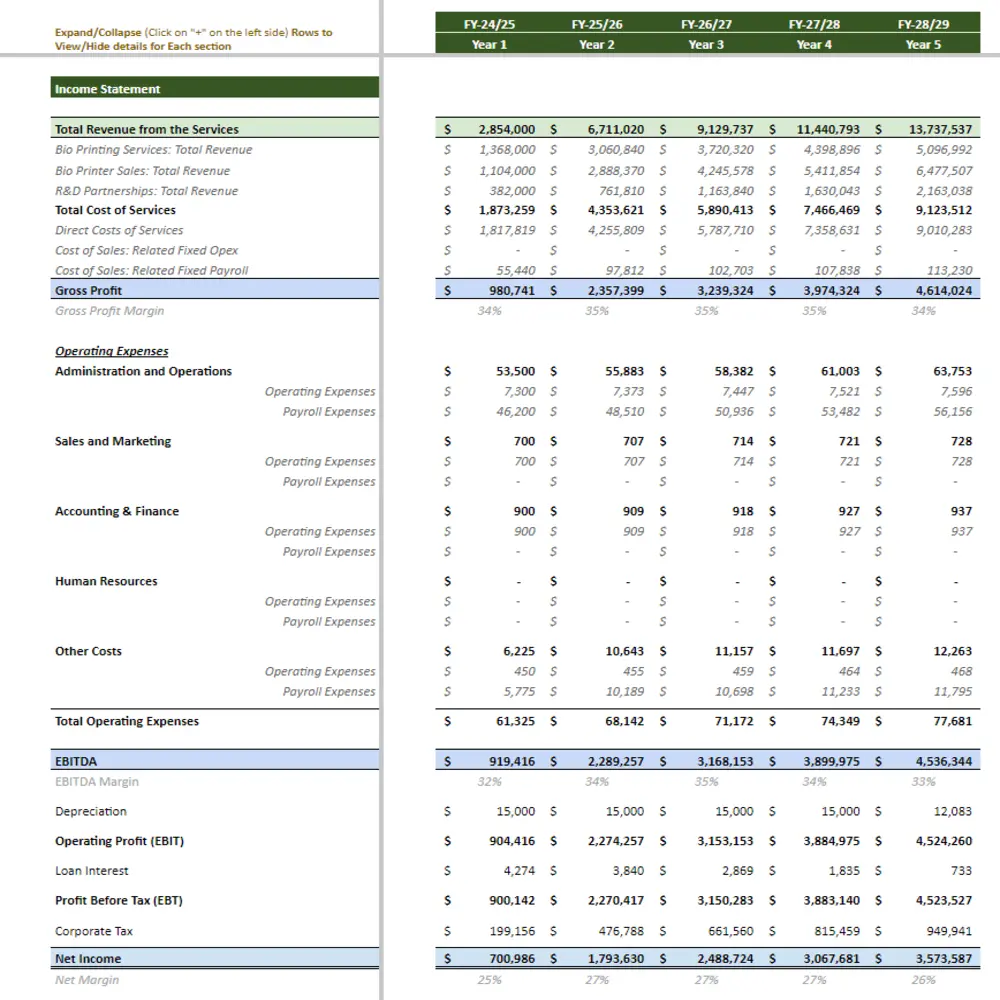
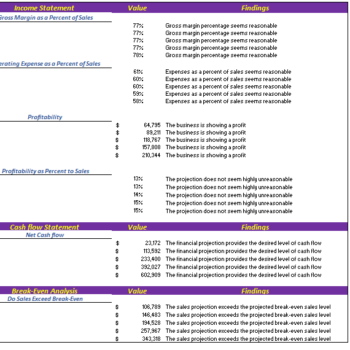
Monthly & Yearly Income Statement
The 3D Bio Print Excel Financial Model provides the monthly as well as yearly income statement structure. The framework for creating a full corporate forecasting model tailored to your particular business. An integrated financial model is powerful since it enables the Financial Model user to change any assumption in one part of the statement to see how it impacts all other parts of the statements accurately and consistently.
Monthly Income Statement
The monthly Income Statement sheet of the Financial Model is perfect for those who require regular reporting and details. Additionally, Income Statement contains all revenue streamlines with gross earnings, and net earnings linked with a revenue analysis sheet to ensure accurate reporting. Oak Business Consultants understands the 3D Bio Print business’s goal. Therefore, we have developed a mechanism that helps business owners determine whether they are making profits or otherwise.

Yearly Income Statement
Furthermore, the Yearly Income Statement gives you complete insights into revenue and general & administrative expenses. The Yearly Income Statement also contains several graphs, assumptions, ratios, net profit, cost of services, and profit after tax.
Balance Sheet
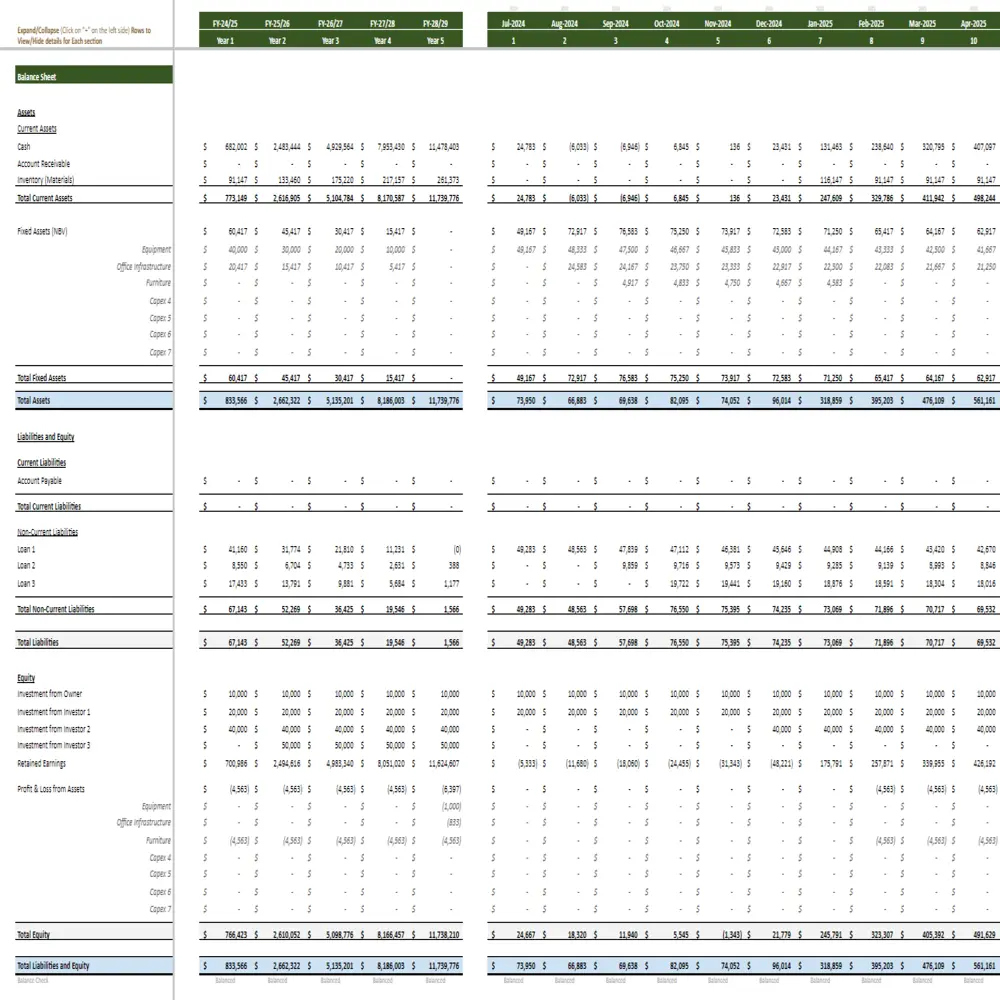
This balance sheet enables you to analyze your position of current assets, fixed assets, liabilities, and equity. This also allows you to monitor your accounts receivable, accounts payable, accrued expenses, etc. Therefore this specific financial model gives you the perfect space to analyze your key financial balance accounts.
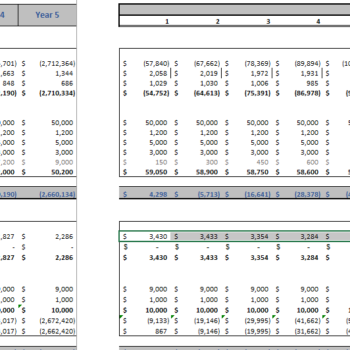
Cash Flow Statement

The Cash Flow Statement is the vital part of the three statements that report the cash spent and generated during a specific period. The Cash Flow Statements act as a bridge between the income statement and balance sheet by how money has moved in and out of business.
Three main sections of the Cashflow Statement
- Operating Activities: We have included all cash in and out related to the operations of the business
- Investing Activities: Any cash from the disposal of an asset and investments included in this section and linked to the inputs and fixed asset tab.
- Financing Activities: We have separately made a loan-related tab where you can enter all loan-related information thee. The tab is linked to the Financing Activities of Cashflow Statement.
The Cashflow Statement in our Model contains a dedicated sheet to monitor and analyze your company’s cash-ins and out. This cash flow statement is based on several key inputs: Payable and Receivable Days, yearly income, working capital, long-term debt, net cash, etc. This calculation then computes your net cash flow and beginning and end cash balances. This is a perfect template for your company’s cash flow management.
Break-Even Analysis

A break-even analysis can help you measure how different scenarios might play out financially. For example, if you increase the marketing budget or add another employee to the payroll, how many extra sales will be needed to recover that additional expense?
We have included a Break-even analysis in our Financial Model to help the user determine sales. The break-even analysis will help you know at a glance the profits generated at the various sales levels. The Break-Even Analysis refers to the total sales contribution refers to fixed costs at zero profit and loss. This Technique is primarily based on marginal costing, which behaves differently at various levels of output activity.
Sales Analysis
The Sales Analysis section of the 3D Bioprinting Excel Financial Model provides a comprehensive overview of revenue streams and financial performance. This section highlights revenue projections, offering clear insights into the expected income from various sources. It also includes detailed sales analysis and projections, ensuring an in-depth understanding of the business’s financial trajectory. With a focus on key metrics, such as revenue and gross profit

Project Evaluation

Since the table calculates Return on Investment, Investor’s Future Equity Share, and Cash Burn Rate Analysis, analyzing the company’s performance becomes easy to capture potential investors.
Sensitivity Analysis
This section explores the impact of changes in key assumptions on the financial projections of the 3D bioprinting business. Specifically, it analyzes the sensitivity of the model to variations in:
- Revenue: Different revenue growth scenarios are evaluated to assess their impact on key financial metrics.
- EBITDA Margin: The analysis examines how changes in profitability margins affect the overall financial performance.
- FCF Conversion Ratio: The sensitivity of free cash flow to changes in the conversion ratio is explored.
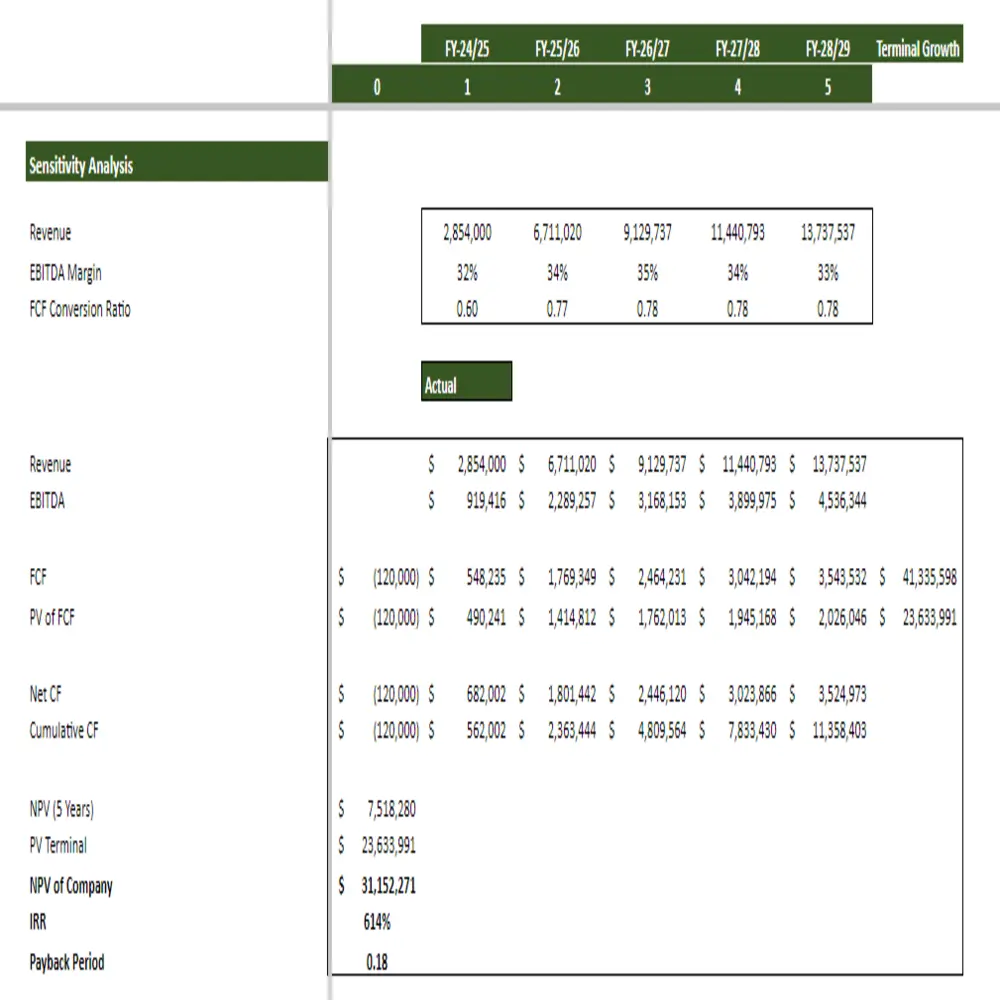
The analysis includes three scenarios:
- Actual: Based on the current assumptions and projections.
- Pessimistic: A conservative scenario with lower revenue growth, lower margins, and a lower FCF conversion ratio.
- Optimistic: An aggressive scenario with higher revenue growth, higher margins, and a higher FCF conversion ratio.
This analysis helps understand the potential risks and rewards associated with the 3D bioprinting business and provides valuable insights for decision-making.
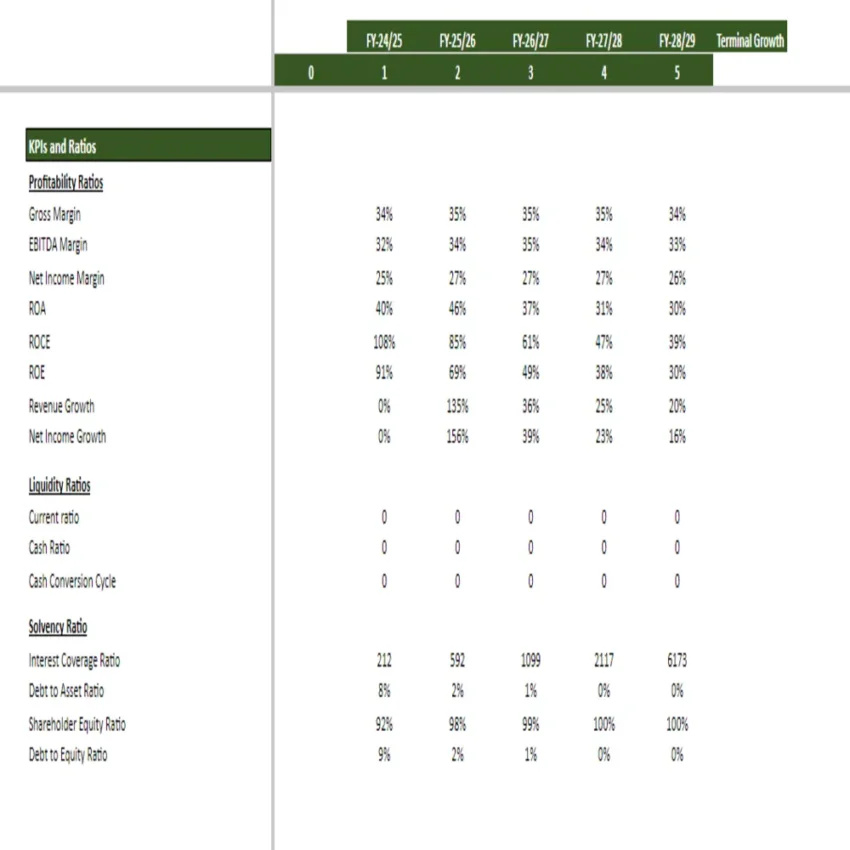
Financial Ratios
This section presents a summary of key financial ratios and performance indicators for the 3D bioprinting business. These ratios provide insights into the company’s profitability, liquidity, solvency, and growth trends.

Key Ratios Analyzed
- Profitability Ratios: Gross Margin, EBITDA Margin, Net Income Margin, ROA, ROCE, ROE
- Revenue & Net Income Growth: Year-over-year growth rates
- Liquidity Ratios: Current Ratio, Cash Ratio, Cash Conversion Cycle
- Solvency Ratios: Interest Coverage Ratio, Debt-to-Asset Ratio, Shareholder Equity Ratio, Debt-to-Equity Ratio
This analysis will help assess the financial health and performance of the 3D bioprinting business over the projected period.
Supporting Schedule

This section of the financial model provides detailed breakdowns and calculations to support the core financial projections. It includes schedules for:
- Operating Expenses: Itemized breakdown of operating costs such as employee compensation, marketing, and administrative expenses.
- Fixed Asset Schedule: Depreciation schedule for fixed assets, tracking their net book value over time.
- Profit and Loss on Sales: Detailed analysis of the company’s profit and loss margins on sales.
- Loan Schedule: Amortization schedule showing loan repayment details, including interest and principal payments.
- Working Capital: Analysis of key working capital components, including accounts receivable, accounts payable, and inventory levels.
These supporting schedules provide transparency and allow for a deeper understanding of the underlying assumptions and drivers of the financial model’s projections.
Dashboard

Users and readers respond and process visual graphs better than data. Furthermore, This dashboard provides you with a graphical management tool that enables you to track all your relevant financial KPIs, improve cash flow management, and track expenses, sales, and net revenue in detail to meet and outperform the financial objectives of your business.
Benefits of 3D Bio Print Excel Excel Financial Model
- Encapsulate Company Performance- The 3D Bio Print Excel Financial Model analysis simplifies a company’s financial statements. It allows the user to express critical profitability and financial position information in just a few numbers. For example, the company’s net profit margin encapsulates the net effect of a company’s revenues and all expenses. It will enable the user to conclude a company’s profitability without going through lengthy account statements.
- Bottom Line – A 3D Bio Print Excel financial model can be the key to your company’s better and informed future. Succeeding in planning your Company’s finances well will mean overall success in making wise investment decisions, purchasing the right operating assets, controlling costs, and determining company valuation.
- Accommodates Investors – This model provides valuation and performance analysis charts. It enables the investors and banks to clearly determine the company’s worth considering lending funds to your company.
- Based on Financial Principles – We did in-depth research on this business model with logic.
- Visualization Tool – This Financial model also prepares a clear communication of the quantitative outcomes. As obtained by calculations via various graphs and charts. Therefore, the user does not need to pay much attention to the financial model’s inner workings.
This Product Includes: 1 Excel File
Walk-Through Video of 3D Bio Print Excel Financial Model
The following video will give you an overview of the different components of the financial model and will help you understand it’s working.
1 review for 3D Bio Print Excel Financial Model
Add a review
You must be logged in to post a review.


Loveday –
Best model without any doubt!!