Financial Reporting and Analysis: The Complete Guide
What Is Financial Reporting and Analysis?
Financial reporting and analysis is the structured process of collecting, organizing, presenting, and interpreting a company’s financial data to support decision-making by stakeholders, management, regulators, and investors.
At its simplest, financial reporting produces the documents that show what a business owns, owes, earns, and spends. Financial analysis then takes those documents a step further, applying quantitative and qualitative techniques to answer the more important question: what does all of this actually mean for the health and future of the business?
Together, financial reporting and analysis serve as the language of business. Every investor evaluating an opportunity, every CFO approving a budget, every lender assessing creditworthiness, and every board member setting strategy relies on this language to make sound decisions. Without it, organizations operate on instinct rather than insight.
For businesses at every stage, from pre-revenue startups to multinational enterprises, the ability to produce accurate reports and extract meaningful analysis from them is not optional. It is a fundamental operational competency. Oak Business Consultant’s Financial Modeling Services and Virtual CFO Services are built on precisely this foundation, helping businesses transform raw numbers into actionable strategy.
Why Financial Reporting and Analysis Matters
Understanding why financial reporting and analysis matter helps organizations commit the necessary resources to doing it well. The consequences of poor reporting extend far beyond internal confusion. They include regulatory penalties, erosion of investor trust, missed growth opportunities, and, in the worst cases, business failure.
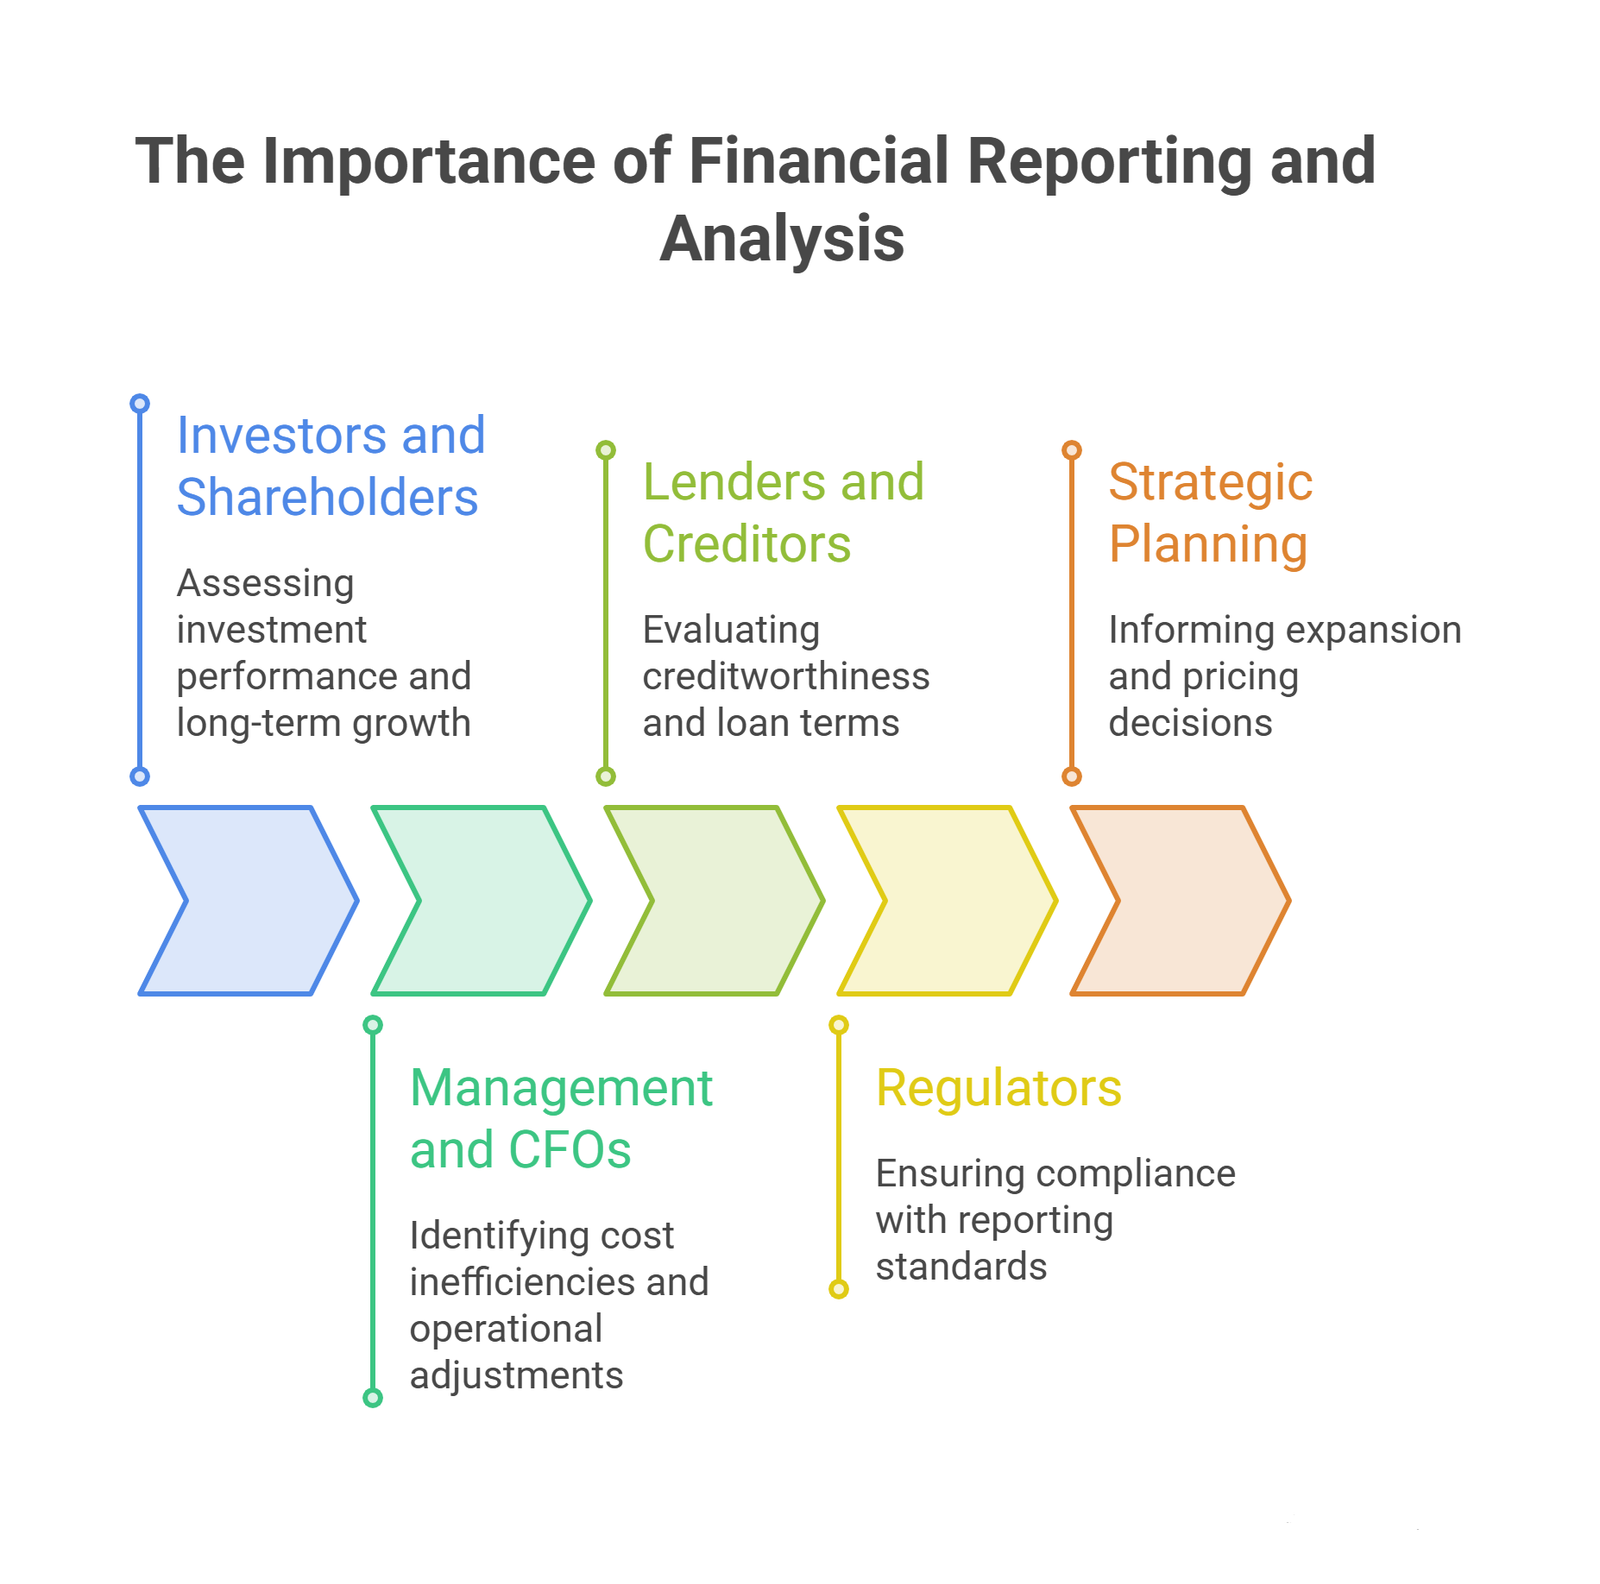
Here is why it matters across every stakeholder group:
For investors and shareholders: Financial reports are the primary tool for assessing whether an investment is performing, whether management is being responsible with capital, and whether the company is positioned for long-term growth.
For management and CFOs: Analysis reveals where costs are running high, where margins are being compressed, and where operational adjustments are needed. Our Fractional CFO Services help businesses access this level of strategic financial leadership without the cost of a full-time hire.
For lenders and creditors: Banks and financial institutions require reliable financial statements before extending credit. The quality and consistency of your reporting directly affects the terms you receive.
For regulators: Compliance with reporting standards such as GAAP or IFRS is a legal obligation. Non-compliance exposes businesses to fines, sanctions, and reputational damage.
For strategic planning: Trends identified through multi-period financial analysis inform everything from expansion decisions to pricing strategies to cost restructuring.
The Standardization Frameworks: GAAP vs. IFRS
One of the most important foundations of financial reporting is standardization. Without a common set of rules, comparing one company’s financial performance to another would be impossible. Two primary frameworks govern financial reporting worldwide.
GAAP: Generally Accepted Accounting Principles
GAAP is the standardized framework used predominantly in the United States. Established by the Financial Accounting Standards Board (FASB) and the American Institute of Certified Public Accountants (AICPA), GAAP provides a comprehensive set of rules that govern how financial statements are prepared and presented.
The core principles underlying GAAP include:
- Historical Cost Principle: Assets and liabilities are recorded at their original acquisition cost rather than current market value.
- Full Disclosure Principle: All relevant and material information must be disclosed in financial statements or accompanying notes.
- Matching Principle: Expenses are recognized in the same period as the revenues they helped generate.
- Revenue Recognition Principle: Revenue is recorded when it is earned, not necessarily when cash is received.
- Consistency Principle: The same accounting methods must be applied from one period to the next.
- Materiality Principle: Only information significant enough to influence decision-making needs to be disclosed.
The benefits of GAAP compliance include:
Investors gain confidence that the financial data they are reviewing follows a reliable, verifiable methodology. Management can benchmark performance against industry peers who follow the same standards. Regulators have a consistent basis for enforcing compliance. Lenders can more accurately assess creditworthiness because the data adheres to a recognized framework. For companies operating in U.S. markets or seeking U.S. investors, GAAP compliance is non-negotiable.
IFRS: International Financial Reporting Standards
IFRS, developed by the International Accounting Standards Board (IASB), is used in over 140 countries worldwide. It was created to provide a common financial language for businesses operating across international borders.
IFRS is principles-based rather than rules-based, meaning it provides high-level guidance and relies on professional judgment for application. This flexibility is both its strength and the source of its greatest complexity.
The benefits of IFRS include:
Companies can present financial statements that investors and counterparties in multiple countries can read without needing to understand local accounting differences. Cross-border comparisons become more meaningful. Multinational businesses can consolidate financial data from subsidiaries operating in different countries without complex reconciliation. For companies looking to attract international capital or expand globally, IFRS compliance signals professionalism and transparency.
Oak’s Business Valuation Services and financial modeling work frequently bridges GAAP and IFRS contexts, particularly for clients raising international capital or preparing for cross-border transactions.
GAAP vs. IFRS: Key Differences at a Glance
| Dimension | GAAP | IFRS |
| Geographic Use | Primarily USA | 140+ countries globally |
| Approach | Rules-based | Principles-based |
| Inventory Valuation | Allows LIFO | LIFO not permitted |
| Development Costs | Expensed immediately | Can be capitalized |
| Asset Revaluation | Generally not permitted | Permitted under certain conditions |
| Revenue Recognition | ASC 606 (specific rules) | IFRS 15 (outcome-based) |
| Financial Statement Format | Specific format prescribed | More flexibility in presentation |
Types of Financial Reports Every Business Must Know
Financial reporting encompasses a range of documents, each with a specific purpose, audience, and scope. Together they form a complete picture of an organization’s financial position and performance.
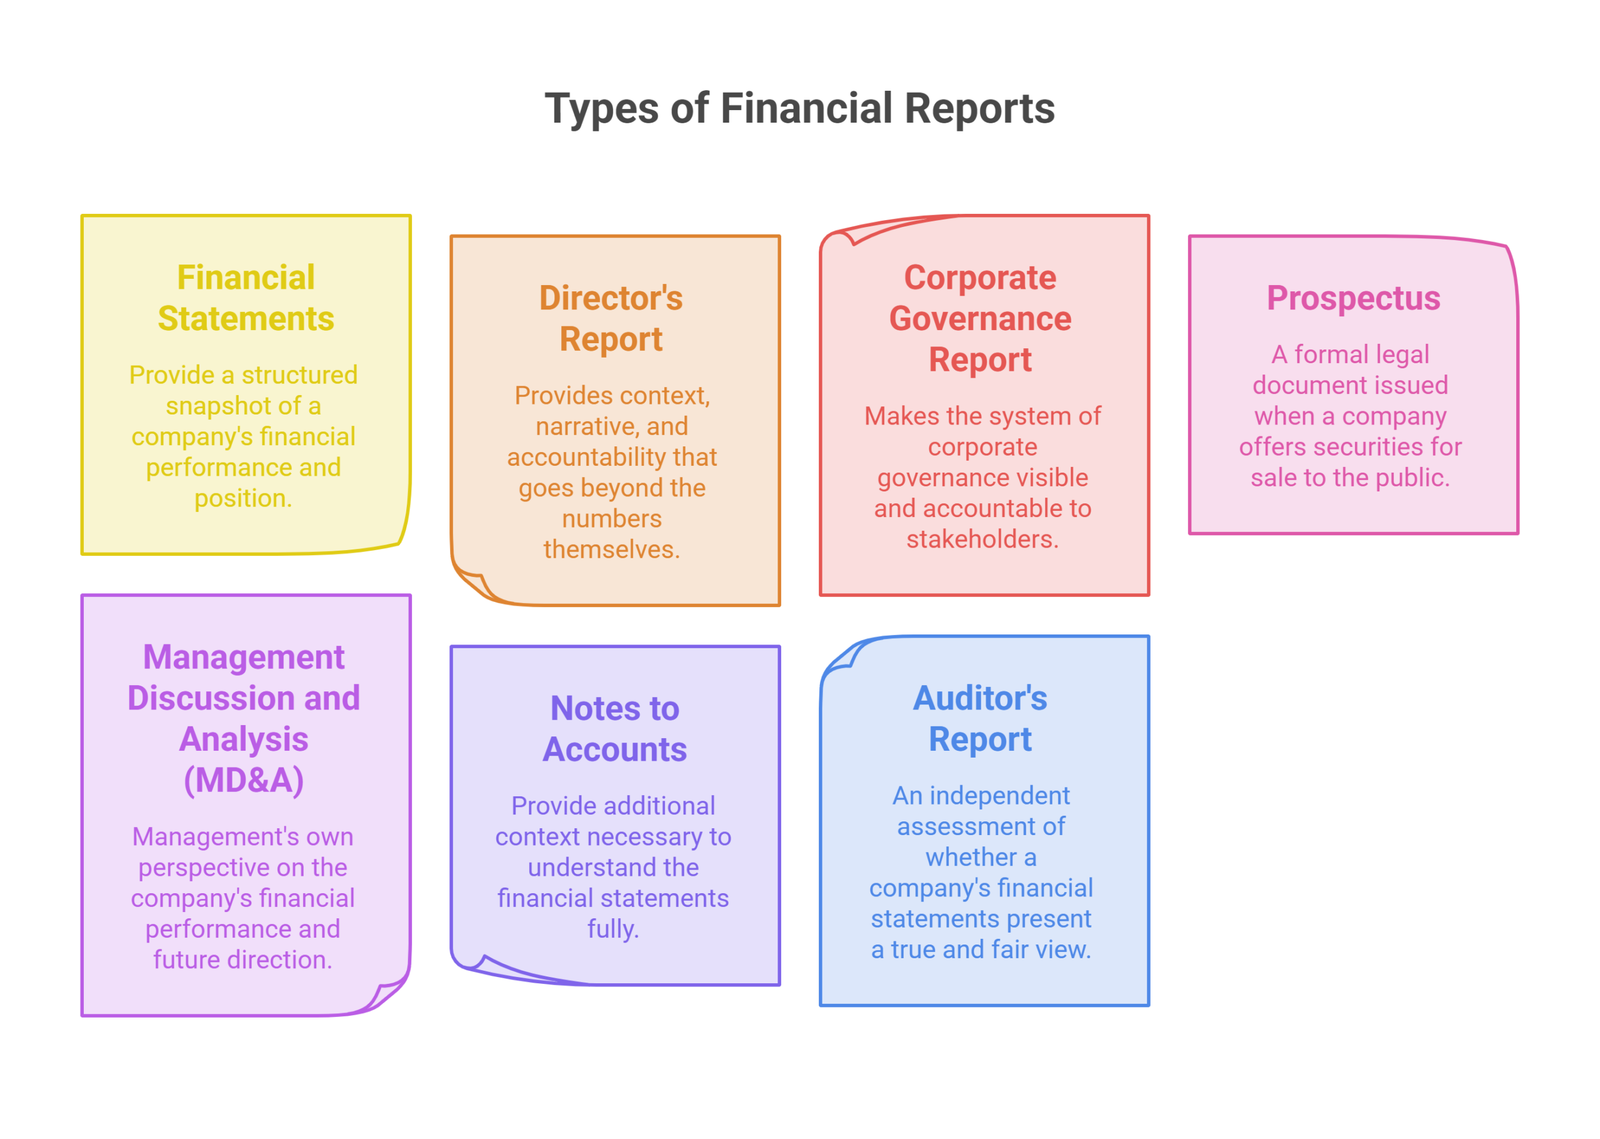
1. Financial Statements
Financial statements are the cornerstone of all financial reporting. They provide a structured snapshot of a company’s financial performance and position over a defined period. There are four primary financial statements every business must produce.
The Income Statement (Profit and Loss Statement)
The income statement measures profitability over a given period, typically a quarter or a full fiscal year. It records:
- Revenue: Total income generated from sales of goods or services.
- Cost of Goods Sold (COGS): Direct costs attributable to production.
- Gross Profit: Revenue minus COGS. This is the first measure of operational profitability.
- Operating Expenses: Selling, general, and administrative costs required to run the business.
- Operating Income (EBIT): Earnings before interest and taxes, showing core business profitability.
- Net Income: The bottom line after all deductions, including taxes and interest.
The income statement answers the most fundamental question a business leader asks: is the company making money?
The Balance Sheet
The balance sheet provides a point-in-time snapshot of what a company owns, what it owes, and what is left over for shareholders. It is built on the foundational accounting equation:
Assets = Liabilities + Shareholders’ Equity
- Assets: Cash, accounts receivable, inventory, property, equipment, and other resources the company controls.
- Liabilities: Short-term obligations (accounts payable, short-term debt) and long-term obligations (bonds, mortgages, deferred tax liabilities).
- Shareholders’ Equity: The residual interest of the owners after liabilities are subtracted from assets.
The balance sheet is essential for assessing financial strength, funding capacity, and the overall structural health of the business. Our Accounting and Bookkeeping Services ensure that every balance sheet entry is accurate, reconciled, and audit-ready.
The Cash Flow Statement
Profit and cash flow are not the same thing, and the cash flow statement makes that distinction clear. It tracks all cash inflows and outflows across three activities:
- Operating Activities: Cash generated or used in the day-to-day running of the business.
- Investing Activities: Cash used for or generated by capital expenditures, acquisitions, and asset sales.
- Financing Activities: Cash flows related to debt, equity issuance, and dividend payments.
A company can be profitable on the income statement and still face a cash crisis. The cash flow statement reveals the true liquidity position. For startups and growth companies especially, cash flow analysis is often more revealing than reported profits.
Statement of Changes in Equity (Shareholders’ Equity Statement)
This statement tracks movements in equity over a reporting period. It shows how retained earnings have changed, what dividends have been paid, what share issuances or buybacks occurred, and how other comprehensive income has affected total equity. For investors, it provides clarity on how management is returning value or reinvesting it for growth.
Financial Statements at a Glance:
| Statement | Primary Question Answered | Key Components |
| Income Statement | Is the company profitable? | Revenue, COGS, operating expenses, net income |
| Balance Sheet | What does the company own and owe? | Assets, liabilities, shareholders’ equity |
| Cash Flow Statement | Is the company generating real cash? | Operating, investing, and financing cash flows |
| Statement of Changes in Equity | How is owner value changing? | Retained earnings, dividends, share transactions |
2. The Director’s Report
The director’s report is prepared by a company’s board of directors and submitted to shareholders alongside the annual accounts. It provides context, narrative, and accountability that goes beyond the numbers themselves.
Purpose: To inform shareholders about the company’s strategy, progress, risks, and governance, and to confirm that directors are fulfilling their fiduciary duties.
Core components typically include:
- Performance Overview: A summary of the company’s financial and operational results for the period, including revenue trends, profitability movements, and key metrics compared to prior periods.
- Significant Transactions: Disclosure of any major acquisitions, disposals, mergers, or joint ventures completed during the reporting period and their financial impact.
- Legal and Regulatory Compliance: Updates on any litigation, regulatory investigations, or compliance matters that may affect the company’s financial position or reputation.
- Corporate Governance Disclosures: Commentary on how the board has discharged its governance responsibilities, including committee activity, board composition, and oversight of risk.
- Executive Compensation: Details of remuneration packages for senior executives, including salary, bonuses, long-term incentive plans, and stock option grants.
- Future Outlook: Forward-looking statements on anticipated performance, strategic priorities, and key risks the company expects to navigate in the coming period.
For businesses building investor-ready documentation, the director’s report is a critical credibility signal. Oak’s Investor-Ready Business Plan Services incorporate the narrative discipline that directors’ reports demand.
3. The Corporate Governance Report
Corporate governance is the system by which companies are directed and controlled. The corporate governance report makes that system visible and accountable to shareholders, regulators, and the public.
What it covers:
- Board Composition and Structure: Identification of board members, their independence status, their qualifications, and the committees they serve on. A well-structured board includes independent non-executive directors who provide oversight without management conflicts.
- Executive Remuneration and Compensation Policies: Detailed disclosure of how pay is structured to align management incentives with shareholder interests, including performance thresholds for variable pay.
- Risk Management Processes: Description of how the company identifies, assesses, monitors, and mitigates risks, from operational and financial risks to reputational and regulatory exposures.
- Internal Controls Framework: Overview of the controls in place to ensure the reliability of financial reporting, the safeguarding of assets, and compliance with laws and regulations.
- Corporate Culture and Ethics: Policies on anti-corruption, whistleblowing, conflicts of interest, and codes of conduct that define behavioral expectations across the organization.
For businesses preparing for external funding, IPO, or acquisition, a well-documented corporate governance report is often a due diligence requirement. Our Special Purpose CFO Services provide the governance architecture that sophisticated investors expect.
4. The Prospectus
A prospectus is a formal legal document issued when a company offers securities, whether shares or bonds, for sale to the public. It is the most comprehensive single document an organization produces in relation to a capital-raising event.
Purpose: To provide prospective investors with all material information they need to make an informed investment decision, while protecting the issuing company from liability for misrepresentation.
The four core sections of a prospectus:
1. Description of the Issuer: Background on the company’s history, business model, products or services, markets served, competitive positioning, key customers, and management team. This section establishes who the company is and why it matters.
2. Description of Securities Being Offered: Specifics of the offering, including the number of shares or bonds, face value, pricing, dividend or coupon rate, maturity date where applicable, and terms that affect investor rights.
3. Risk Factors: A comprehensive and candid disclosure of all material risks that could adversely affect the business, its financial results, or the value of the securities. Categories typically include market risk, operational risk, regulatory risk, liquidity risk, and competitive risk. Investors use this section to stress-test their investment thesis.
4. Use of Proceeds: A clear statement of how funds raised from the offering will be deployed, whether for working capital, debt repayment, capital expenditure, acquisitions, or product development. Investors assess this section to evaluate whether management’s capital allocation strategy is sound.
For startups and growth companies working with Oak’s Startup Fundraising Consultants, prospectus-quality disclosure is often a prerequisite for accessing institutional capital.
5. Management Discussion and Analysis (MD&A)
The Management Discussion and Analysis report, commonly referred to as the MD&A, is one of the most strategically important components of any financial report. It is here that management steps out from behind the numbers and explains what happened, why it happened, and what they plan to do about it.
Purpose: To provide investors, analysts, and other stakeholders with management’s own perspective on the company’s financial performance, business strategy, risks, and future direction.
Core components of the MD&A:
Financial Analysis: A detailed discussion of revenue trends, cost movements, margin changes, and cash flow dynamics. Management explains not just what the numbers show but what drove them, including market conditions, pricing actions, volume changes, and currency effects.
Business Strategy: An explanation of the company’s strategic priorities and how execution against those priorities is progressing. This includes market positioning, competitive advantages, and key strategic initiatives underway.
Management Structure: Commentary on the leadership team, organizational changes, and how the management structure supports the execution of the company’s strategy.
Growth Plans: Discussion of expansion plans, including geographic expansion, product launches, channel development, partnership formation, and M&A activity.
Market Position: Analysis of how the company is performing relative to its industry and competitors, including market share trends, customer metrics, and brand positioning.
Industry Trends: Identification of macroeconomic and sector-specific trends that are shaping the company’s operating environment, including regulatory changes, technological disruption, and supply chain dynamics.
Performance Metrics: A set of key performance indicators (KPIs) that management uses to track progress, which may include both financial ratios and operational metrics specific to the business model.
The MD&A is where financial reporting meets business strategy. Our Virtual CFO Services help management teams develop the analytical rigor and narrative discipline that a compelling MD&A requires.
6. Notes to Accounts
Notes to accounts, also referred to as footnotes or financial statement disclosures, accompany the primary financial statements and provide the additional context necessary to understand them fully.
Purpose: Notes serve two functions. First, they explain the accounting policies and methodologies used to prepare the financial statements. Second, they disclose information that is relevant to understanding the statements but does not appear within the statements themselves.
What notes to accounts typically contain:
- Significant Accounting Policies: Description of the accounting methods applied, including revenue recognition policies, depreciation methods, inventory valuation approaches, and treatment of foreign currency transactions.
- Legal Proceedings and Contingencies: Disclosure of pending litigation, regulatory investigations, or contractual disputes that may result in future financial obligations.
- Related Party Transactions: Details of transactions between the company and related entities, including subsidiaries, associates, and transactions with directors or major shareholders.
- Segment Information: Breakdown of financial performance by business unit, geography, or product line for companies operating across multiple segments.
- Income Tax Details: Reconciliation of the effective tax rate, deferred tax assets and liabilities, and tax uncertainties.
- Extraordinary Items: Any unusual or non-recurring events that affected financial results and require separate explanation.
The core structure of an effective note:
| Component | Function |
| Summary | Brief explanation of what the note covers and its significance |
| Explanation | Detailed breakdown of the accounting treatment or item in question |
| Discussion | How this item affects overall financial performance or future projections |
| Disclosure | Any required regulatory or GAAP/IFRS disclosures related to the item |
| Analysis | Sensitivity of outcomes to different assumptions where applicable |
| Conclusion | Synthesis of the note’s implications for investors and stakeholders |
Notes to accounts are often where the most material risks and accounting judgments are disclosed. Sophisticated investors and analysts read footnotes with as much attention as the primary statements.
7. The Auditor’s Report
The auditor’s report is an independent assessment of whether a company’s financial statements present a true and fair view of its financial position and performance. Issued by an external, qualified auditor, it provides stakeholders with assurance that the financial information they are relying on has been subject to rigorous independent scrutiny.
Purpose: To add credibility to financial statements by confirming that they comply with applicable accounting standards and that no material misstatements exist, whether due to error or fraud.
The four core sections of an auditor’s report:
Introduction: Identifies the company, the financial period under review, and the auditor’s appointment. It also clarifies the respective responsibilities of management (who prepares the statements) and the auditor (who provides an opinion on them).
Scope: Describes the nature, extent, and methodology of the audit work performed. This includes the sampling approach used, the internal controls assessed, and the materiality threshold applied.
Opinion: The auditor’s formal conclusion. There are four possible opinion types:
- Unqualified Opinion (Clean Opinion): The statements present a true and fair view. This is the outcome businesses aim for.
- Qualified Opinion: The statements are generally fair, but there is a specific matter on which the auditor disagrees or lacks sufficient evidence.
- Adverse Opinion: The statements do not present a true and fair view. This is a serious matter that typically triggers investor concern and regulatory scrutiny.
- Disclaimer of Opinion: The auditor was unable to obtain sufficient evidence to form any opinion.
Signature Page: Confirms the auditor’s identity, professional standing, and the date of the report. It formalizes the auditor’s accountability for the opinion expressed.
Key Audit Matters (KAMs): Modern audit reports for listed companies now include Key Audit Matters, which are those areas that required the most significant auditor judgment and attention. These sections give investors insight into where the greatest accounting complexity and risk resided in the audit.
A clean auditor’s report is a prerequisite for most institutional investors, regulated lenders, and public markets. It is the formal certification that financial reporting meets professional standards.
Core Financial Analysis Techniques
Producing financial reports is only the first step. Extracting insight from them requires systematic analysis techniques that convert raw data into strategic intelligence.
Horizontal Analysis
Horizontal analysis, also called trend analysis, compares financial data across multiple periods to identify growth rates, deteriorating metrics, and emerging patterns. It typically expresses year-on-year or period-on-period changes as both an absolute number and a percentage.
Example: If revenue was $10 million in Year 1 and $13 million in Year 2, the horizontal analysis would show a $3 million increase or 30% growth. Applying this across all income statement and balance sheet lines reveals whether the business is expanding, contracting, or stagnating in any particular area.
Horizontal analysis is particularly powerful for identifying inflection points, whether positive (a new product gaining traction) or negative (margins compressing as costs rise faster than revenue).
Vertical Analysis
Vertical analysis expresses each line item in a financial statement as a percentage of a base figure, typically total revenue on the income statement or total assets on the balance sheet. This technique removes the distortion of absolute size and allows meaningful comparison between companies of different scales.
Example: If COGS represents 55% of revenue in one period and 62% in the following period, the vertical analysis immediately surfaces a margin compression issue, regardless of whether revenue itself grew.
Vertical analysis is essential for benchmarking against industry averages and competitors.
Ratio Analysis
Ratio analysis is the most widely used analytical technique in financial reporting. It involves calculating mathematical relationships between two financial figures to assess specific aspects of performance. We cover the key ratios in detail in the following section.
Cash Flow Analysis
Cash flow analysis goes beyond the cash flow statement to assess the quality, sustainability, and adequacy of cash generation. It examines:
- The ratio of operating cash flow to net income (a high ratio indicates high-quality earnings).
- Free cash flow, calculated as operating cash flow minus capital expenditure.
- Cash conversion cycle, which measures how efficiently a business converts its investments in inventory and receivables into cash.
For startups and growth businesses, understanding cash flow dynamics is often more critical than understanding reported profits. Our Essentials of Financial Analysis article goes deeper on these concepts.
Variance Analysis
Variance analysis compares actual financial results against budgeted or forecasted figures to identify where performance deviated from plan. Favorable variances indicate outperformance against expectations; unfavorable variances flag areas requiring corrective action.
Variance analysis is a core tool in management accounting and is central to the financial planning and budgeting process.
Types of variance:
- Revenue Variance: Actual revenue versus budgeted revenue, broken down by volume, price, and mix.
- Cost Variance: Actual costs versus budgeted costs, broken down by material, labor, and overhead components.
- Profit Variance: The cumulative impact of revenue and cost variances on reported profit.
Scenario and Sensitivity Analysis
Scenario analysis models how financial outcomes change under different sets of assumptions, such as a base case, an optimistic case, and a pessimistic case. Sensitivity analysis tests how a single variable change, such as a 10% change in pricing or a 5% increase in interest rates, affects key financial metrics.
These techniques are essential for strategic planning, investment evaluation, and risk management. Our article on the importance of NPV for financial modeling provides a practical guide to applying scenario analysis in capital investment decisions.
Essential Financial Ratios and KPIs
Financial ratios are the most powerful single tool available for benchmarking, trending, and diagnosing business performance. They transform raw financial data into standardized, comparable metrics that communicate the health of a business clearly and concisely.
Profitability Ratios
Profitability ratios measure a company’s ability to generate profit relative to its revenue, assets, equity, or capital employed.
| Ratio | Formula | What It Measures |
| Gross Profit Margin | Gross Profit / Revenue x 100 | Efficiency of core production or service delivery |
| Operating Profit Margin | Operating Income / Revenue x 100 | Profitability from core operations before financing |
| Net Profit Margin | Net Income / Revenue x 100 | Overall profitability after all costs and taxes |
| Return on Assets (ROA) | Net Income / Total Assets x 100 | Efficiency of asset utilization in generating profit |
| Return on Equity (ROE) | Net Income / Shareholders’ Equity x 100 | Return generated for shareholders on their investment |
| Return on Capital Employed (ROCE) | EBIT / Capital Employed x 100 | Efficiency of total capital in generating operating profit |
| EBITDA Margin | EBITDA / Revenue x 100 | Operating profitability excluding non-cash charges |
Industry context matters: Average gross profit margins vary significantly by sector. Software companies often achieve gross margins above 70%, while manufacturing businesses may operate at 20-40%. Always benchmark ratios against sector-specific norms.
Liquidity Ratios
Liquidity ratios measure a company’s ability to meet its short-term financial obligations without raising additional capital.
| Ratio | Formula | Interpretation |
| Current Ratio | Current Assets / Current Liabilities | A ratio above 1.5x generally indicates adequate short-term liquidity |
| Quick Ratio (Acid Test) | (Current Assets – Inventory) / Current Liabilities | A stricter measure excluding less liquid inventory |
| Cash Ratio | Cash and Cash Equivalents / Current Liabilities | The most conservative liquidity measure |
| Operating Cash Flow Ratio | Operating Cash Flow / Current Liabilities | Indicates ability to cover short-term obligations from operations |
For our analysis of how liquidity connects to business survival, see our piece on Cash vs. Profit.
Efficiency Ratios
Efficiency ratios, also known as activity ratios, measure how effectively a company uses its assets and manages its operational cycles.
| Ratio | Formula | What It Measures |
| Inventory Turnover | COGS / Average Inventory | How quickly inventory is sold and replaced |
| Days Inventory Outstanding (DIO) | 365 / Inventory Turnover | Average days inventory is held before sale |
| Receivables Turnover | Revenue / Average Accounts Receivable | Speed of collecting payment from customers |
| Days Sales Outstanding (DSO) | 365 / Receivables Turnover | Average days taken to collect receivables |
| Payables Turnover | COGS / Average Accounts Payable | Speed of paying suppliers |
| Days Payable Outstanding (DPO) | 365 / Payables Turnover | Average days taken to pay suppliers |
| Asset Turnover | Revenue / Total Assets | Revenue generated per dollar of assets |
The cash conversion cycle (DIO + DSO – DPO) combines these metrics into a single measure of how efficiently the business converts its investments into cash. A lower cycle is generally better.
Solvency and Leverage Ratios
Solvency ratios assess a company’s ability to meet its long-term obligations and the extent to which it relies on debt financing.
| Ratio | Formula | What It Measures |
| Debt-to-Equity Ratio | Total Debt / Total Equity | The proportion of financing from debt versus equity |
| Debt-to-Assets Ratio | Total Debt / Total Assets | Percentage of assets financed by debt |
| Interest Coverage Ratio | EBIT / Interest Expense | Ability to cover interest payments from operating earnings |
| Financial Leverage Ratio | Total Assets / Total Equity | The extent to which equity is amplified by debt |
| Fixed Charge Coverage | (EBIT + Fixed Charges) / (Fixed Charges + Interest) | Ability to cover all fixed financial obligations |
A debt-to-equity ratio above 2.0x often signals elevated financial risk, though the appropriate threshold varies by industry. Capital-intensive sectors such as utilities or real estate routinely operate with higher leverage than technology or consulting businesses.
Valuation Ratios
Valuation ratios are primarily used by investors to assess whether a company’s market price is justified by its financial fundamentals.
| Ratio | Formula | What It Measures |
| Price-to-Earnings (P/E) | Market Price per Share / Earnings per Share | Market’s multiple on current earnings |
| Earnings per Share (EPS) | (Net Income – Preferred Dividends) / Shares Outstanding | Earnings attributable to each common share |
| Price-to-Book (P/B) | Market Price per Share / Book Value per Share | Market premium or discount to accounting value |
| Enterprise Value / EBITDA | Enterprise Value / EBITDA | Holistic valuation metric used in M&A analysis |
| Dividend Yield | Annual Dividend per Share / Market Price per Share | Income return on investment for shareholders |
For businesses preparing for investment or sale, understanding how these ratios will frame perceptions of value is essential. Our Business Valuation Services help businesses understand and strengthen their valuation positioning before approaching investors or buyers.
Financial Reporting for Different Business Sizes
Financial reporting requirements and practices are not one-size-fits-all. They vary significantly based on company size, legal structure, listing status, and industry.
Small Businesses and Startups
Small businesses typically produce simplified financial statements, often on a cash basis rather than accrual basis for internal purposes. Key priorities include:
- Maintaining accurate bookkeeping records as the foundation for reporting.
- Producing monthly profit and loss statements to track trading performance.
- Managing cash flow carefully, with weekly or bi-weekly cash flow forecasting.
- Meeting statutory filing obligations on schedule to avoid penalties.
For early-stage companies, the Essentials of Financial Analysis provide a practical entry point for building financial discipline. Oak’s Accounting and Bookkeeping Services are specifically structured to give small businesses professional-grade financial foundations without the overhead of a full in-house finance team.
Mid-Sized Businesses
Mid-sized businesses face more complex reporting requirements. They typically need:
- Full accrual-basis financial statements prepared under GAAP or IFRS.
- Consolidated financial statements if they operate through subsidiary entities.
- Management accounts delivered monthly or quarterly, with detailed variance analysis.
- Compliance with more extensive disclosure requirements, particularly if they have institutional lenders or outside investors.
- A more sophisticated budgeting and forecasting process, often supported by a Fractional CFO or Full-Time CFO Services.
Large Enterprises and Public Companies
Large enterprises and listed companies face the most demanding reporting obligations:
- Quarterly and annual financial statements prepared under GAAP or IFRS.
- Full external audit by a recognized audit firm.
- Comprehensive MD&A, corporate governance report, and detailed notes to accounts.
- Disclosure of Key Audit Matters and ESG (Environmental, Social, and Governance) reporting.
- Real-time reporting capabilities to satisfy investor and regulatory expectations.
- Integrated reporting frameworks that combine financial and non-financial performance.
Best Practices in Financial Reporting and Analysis
Producing compliant financial reports is the minimum bar. Producing financial reports that genuinely inform decision-making, build stakeholder trust, and support organizational growth requires adherence to a higher standard of practice.
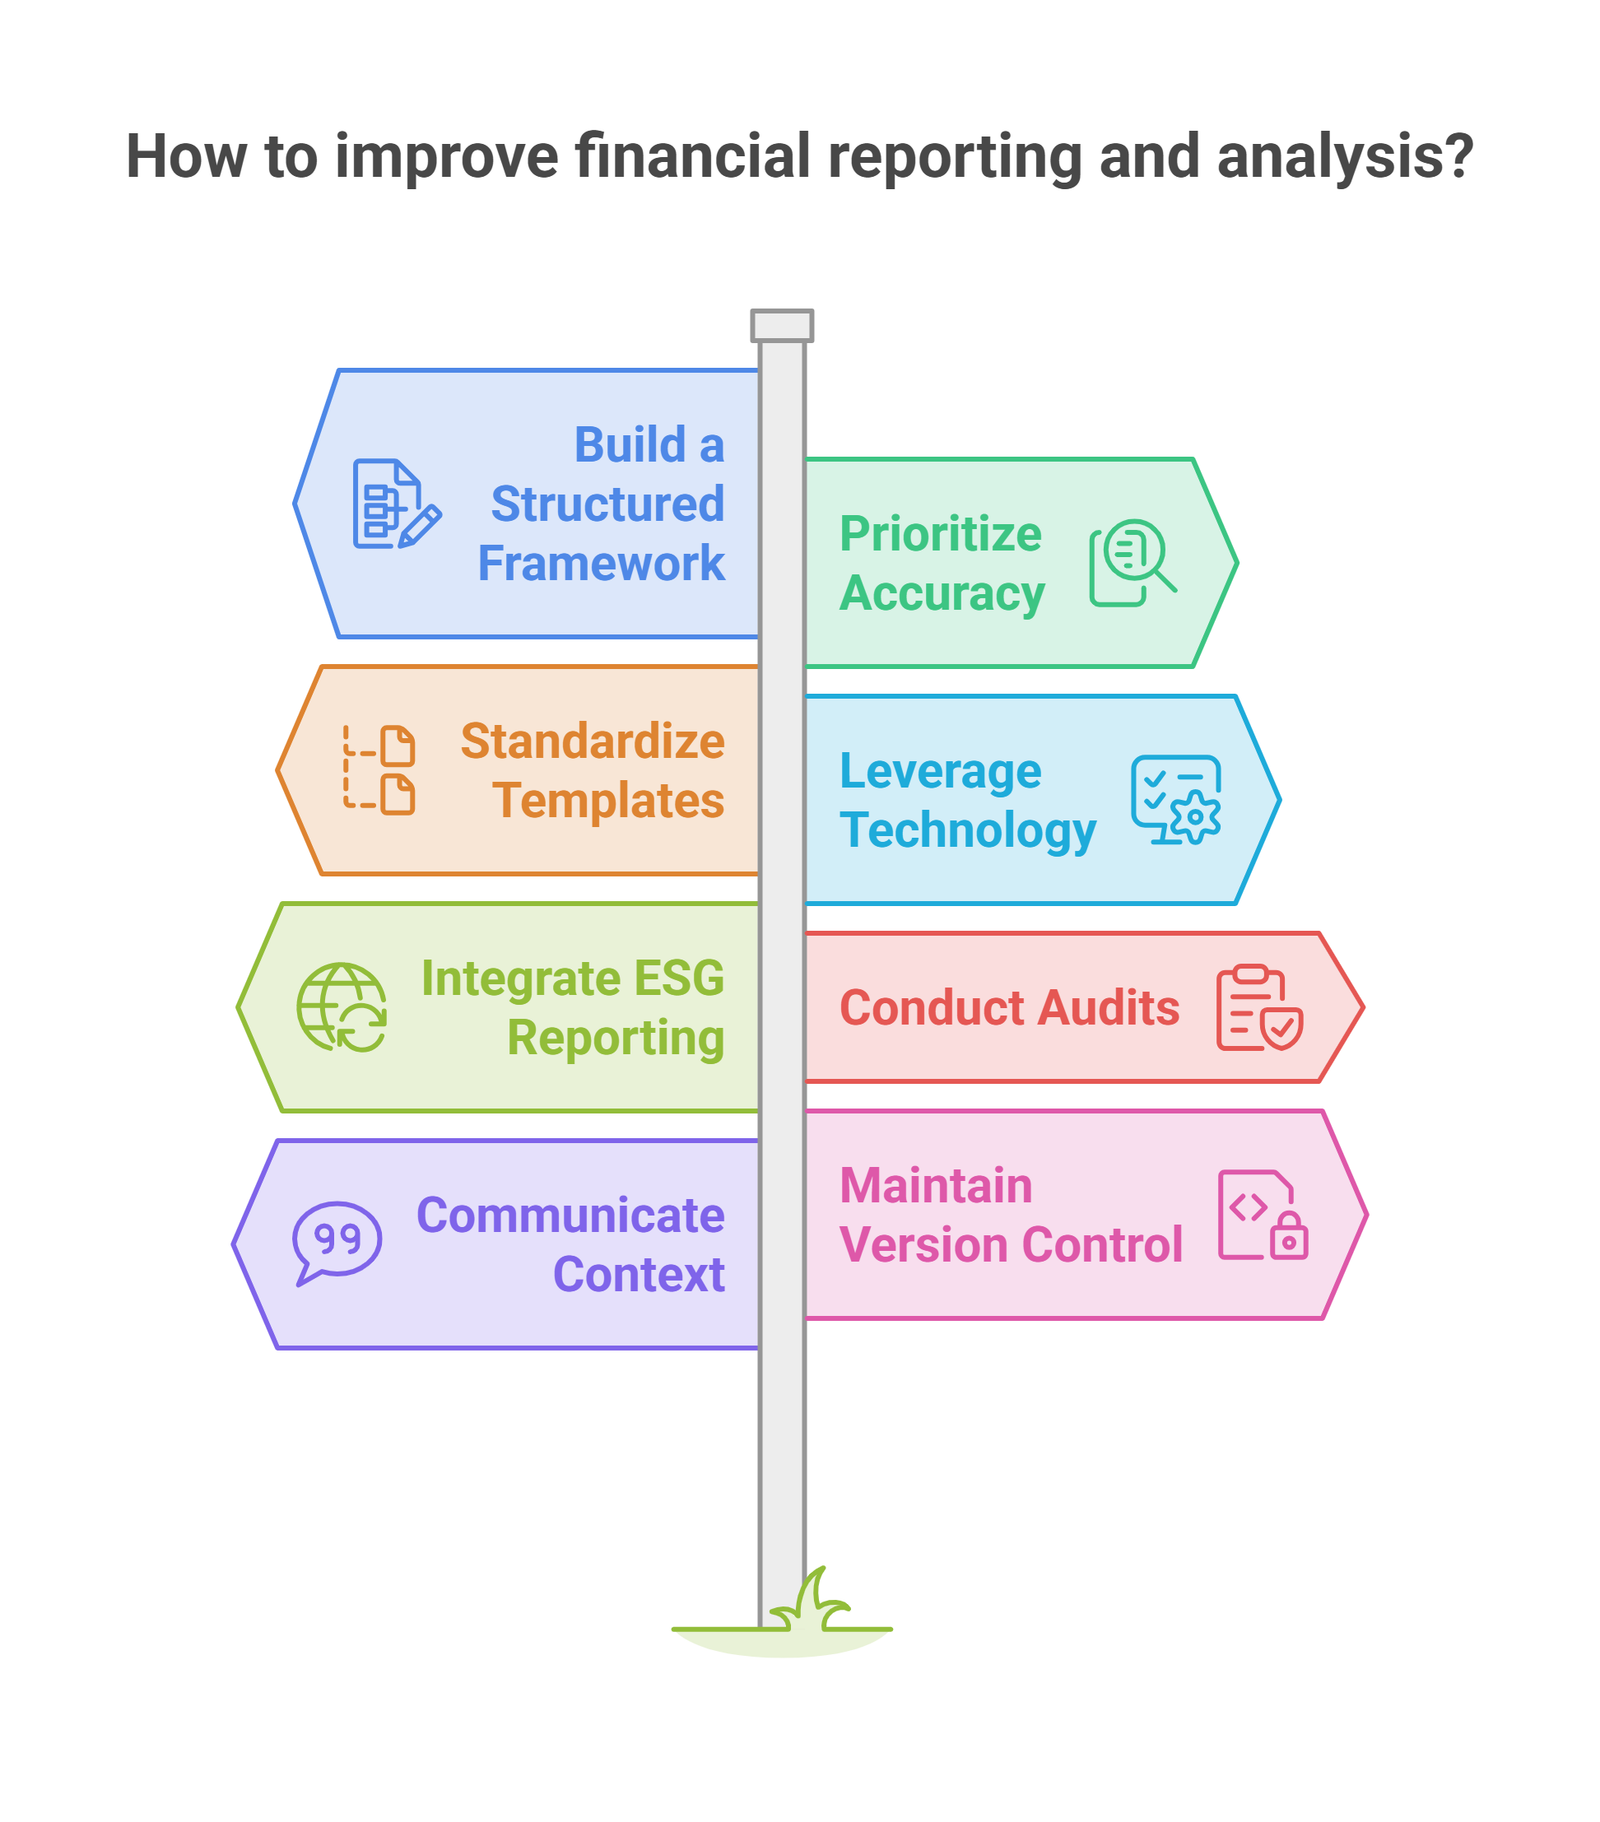
1. Build a Structured Reporting Framework
Define clear reporting objectives, assign ownership and accountability for each report, establish standardized templates, and set non-negotiable timelines. A structured framework ensures data uniformity, traceability, and consistency across every reporting cycle. It also ensures that the process of preparing reports is itself compliant with GAAP or IFRS requirements.
2. Prioritize Accuracy Above All Else
Financial data that is inaccurate creates consequences far more serious than delayed reporting. Establish rigorous reconciliation processes, implement dual-control sign-off for critical figures, and conduct regular internal audits of data inputs. Errors in financial reporting can lead to poor decisions, regulatory penalties, and destruction of stakeholder trust. Our Bookkeeping and Accounting Services are built on the principle that accuracy is non-negotiable.
3. Standardize Templates and Formats
Financial controllers should implement consistent templates for income statements, balance sheets, cash flow reports, and management accounts. Standardization reduces errors, improves clarity, and enables meaningful comparison across departments, subsidiaries, and time periods. When different business units use different formats, consolidation becomes a significant source of error.
4. Leverage Technology and Automation
Manual, spreadsheet-based financial reporting is a significant source of error and inefficiency. Modern finance teams implement automation tools to streamline data entry, automated consolidation, and report generation. AI-powered analytics platforms add predictive capability, identifying trends and anomalies before they become problems. Cloud-based accounting software provides real-time visibility into financial performance. For businesses scaling rapidly, technology investment in financial infrastructure pays significant dividends in accuracy and speed.
5. Integrate Financial and Non-Financial Reporting
The growing emphasis on Environmental, Social, and Governance (ESG) factors means that financial reporting is increasingly expected to encompass non-financial performance indicators alongside traditional metrics. Stakeholders, particularly institutional investors, now routinely assess companies on their ESG performance as part of their investment thesis. Developing an integrated reporting framework that combines financial results with ESG metrics positions businesses for the future of capital markets.
6. Conduct Regular Audits and Reviews
Financial reporting processes should themselves be subject to regular audit and review. Internal audit functions provide assurance that controls are operating effectively. Periodic independent reviews of the reporting process, even for businesses not subject to external audit requirements, identify gaps, inefficiencies, and compliance risks before they escalate.
7. Communicate Context, Not Just Numbers
Numbers without context mislead. Every financial report should be accompanied by narrative that explains what drove the results, what has changed from the prior period, and what management is doing about any challenges identified. The most effective financial reports connect quantitative performance to qualitative strategy, giving stakeholders a complete picture of where the business stands and where it is going.
8. Maintain Strict Version Control and Data Integrity
In organizations where multiple people contribute to financial reports, version control is critical. A single source of truth, typically a controlled accounting system rather than email-distributed spreadsheets, must govern all financial data. Data integrity measures prevent unauthorized changes to figures after they have been reviewed and approved.
Technology and the Future of Financial Reporting
The practice of financial reporting is being transformed by technology at a pace that was unimaginable just a decade ago. Understanding these trends is essential for any finance professional or business leader who wants to remain competitive.
Automation and Robotic Process Automation (RPA): Repetitive, rule-based financial tasks such as data entry, account reconciliation, and report generation are being automated through RPA tools. This reduces human error, frees finance teams for higher-value analytical work, and accelerates reporting cycles.
Artificial Intelligence and Machine Learning: AI is being applied to anomaly detection, predictive forecasting, and pattern recognition in financial data. AI-powered systems can identify unusual transactions, flag potential fraud, and generate predictive insights from historical data at a speed and scale that human analysts cannot match.
Real-Time Reporting: Cloud-based accounting systems now enable finance teams to generate real-time financial snapshots rather than waiting for month-end closes. Leadership teams can access current performance data at any point, enabling faster and better-informed decisions.
Blockchain and Distributed Ledger Technology: Blockchain is being explored as a mechanism for creating immutable, transparent transaction records that could fundamentally change how financial statements are verified and audited. While still in early stages for mainstream adoption, its potential to enhance the integrity of financial reporting is significant.
Integrated ESG Reporting Platforms: As ESG reporting requirements expand globally, software platforms are emerging that integrate financial and non-financial data, enabling companies to produce integrated reports efficiently and with a high degree of data quality.
Cloud-Based Collaboration: Remote finance teams and global subsidiaries can now collaborate on financial reporting in real time using cloud platforms, eliminating version control issues and enabling continuous reporting rather than periodic cycles.
For businesses considering how to modernize their financial infrastructure, our Virtual CFO Services and Financial Modeling Services incorporate the latest tools and methodologies to ensure that financial reporting is not just compliant but genuinely strategic.
Frequently Asked Questions
Which financial statement is the most important?
Each statement serves a different purpose and cannot be understood in isolation. The income statement shows profitability, the balance sheet shows financial position, and the cash flow statement shows liquidity. Most analysts consider the cash flow statement the hardest to manipulate and therefore the most reliable indicator of true financial health.
What is the difference between GAAP and IFRS?
GAAP is a rules-based framework used primarily in the United States, governed by the FASB. IFRS is a principles-based framework used in over 140 countries, governed by the IASB. Key differences include the treatment of inventory valuation, development cost capitalization, and asset revaluation. See our comparison table above for a full breakdown.
What does an auditor’s clean opinion mean?
An unqualified or clean opinion from an external auditor means the auditor found that the financial statements present a true and fair view of the company’s financial position and performance in all material respects. It does not mean the statements are error-free, but that any errors are immaterial and do not affect the overall reliability of the information.
What is the MD&A section of a financial report?
The Management Discussion and Analysis section is where management provides its own narrative on the company’s financial results, business strategy, risks, and outlook. It transforms the raw data of the financial statements into a coherent business story that helps investors understand not just what happened, but why and what comes next.
How does financial analysis support business growth?
Financial analysis identifies which products or services are most profitable, which costs are growing faster than revenue, where working capital is being tied up inefficiently, and how the company compares to industry benchmarks. These insights drive better pricing, cost management, investment allocation, and strategic planning decisions.
Conclusion
Financial reporting and analysis is the foundation on which sound business decisions are built. From the income statement that measures profitability to the auditor’s report that certifies credibility, every component of the financial reporting system serves a purpose: to provide stakeholders with reliable, meaningful information about the financial health and trajectory of a business.
Mastering this discipline requires understanding not just the mechanics of producing financial reports, but the analytical techniques that extract insight from them and the best practices that ensure their quality. The businesses that do this well, those that combine accurate reporting with sophisticated analysis, build the trust of investors, the discipline of management, and the strategic clarity needed to compete and grow.
Whether you are a startup founder building your first financial model, a CFO preparing for a capital raise, or a business owner trying to understand why profits are not translating into cash, the principles covered in this guide provide the framework you need.
Oak Business Consultant is here to help you apply them. With over 16 years of experience across financial modeling, CFO advisory, accounting, and investor documentation, our team brings the expertise to transform your financial reporting from a compliance exercise into a genuine engine of strategic advantage.Book a consultation with today and take the first step toward financial clarity.