SDG 7: Affordable and Clean Energy, and the 655 Million People Still Without Power
Ten years into SDG 7, the energy gap is still wide.
In 2024, 655 million people had no electricity. That is the UN’s own count. The global electrification rate has stalled at 92%. It has not moved since 2023.
Clean cooking access sits at 75%. That leaves 2 billion people burning polluting fuels at home. Renewables made real gains, but financing to reach the poorest countries did not keep pace. And the countries with the most energy on hand are not always the ones leading the clean transition. The US generates a quarter of its power from renewables. China builds more solar in a year than most countries will ever install. The UAE, sitting on some of the world’s best sun, still runs mostly on gas.
This guide covers what SDG 7 actually asks of the world. It shows where 2026 progress stands, country by country, ranked from best combined performer to worst. It also covers what businesses can do about it.
What is SDG 7
SDG 7 aims to ensure access to affordable, reliable, sustainable, and modern energy for all. That is the UN’s own wording. It is the seventh of 17 Sustainable Development Goals. All 193 UN member states adopted it in 2015, as part of the 2030 Agenda. The goal has five targets. Three are outcome targets. The other two cover finance and infrastructure for developing countries.
It spans electricity access, clean cooking, renewable energy, efficiency, and investment. Progress on one front does not guarantee progress on another. A country can electrify its capital and still leave rural villages dark. It can add solar capacity and still run mostly on gas. SDG 7 tracks each piece on its own, not as one combined score.
The official targets and indicators behind SDG 7
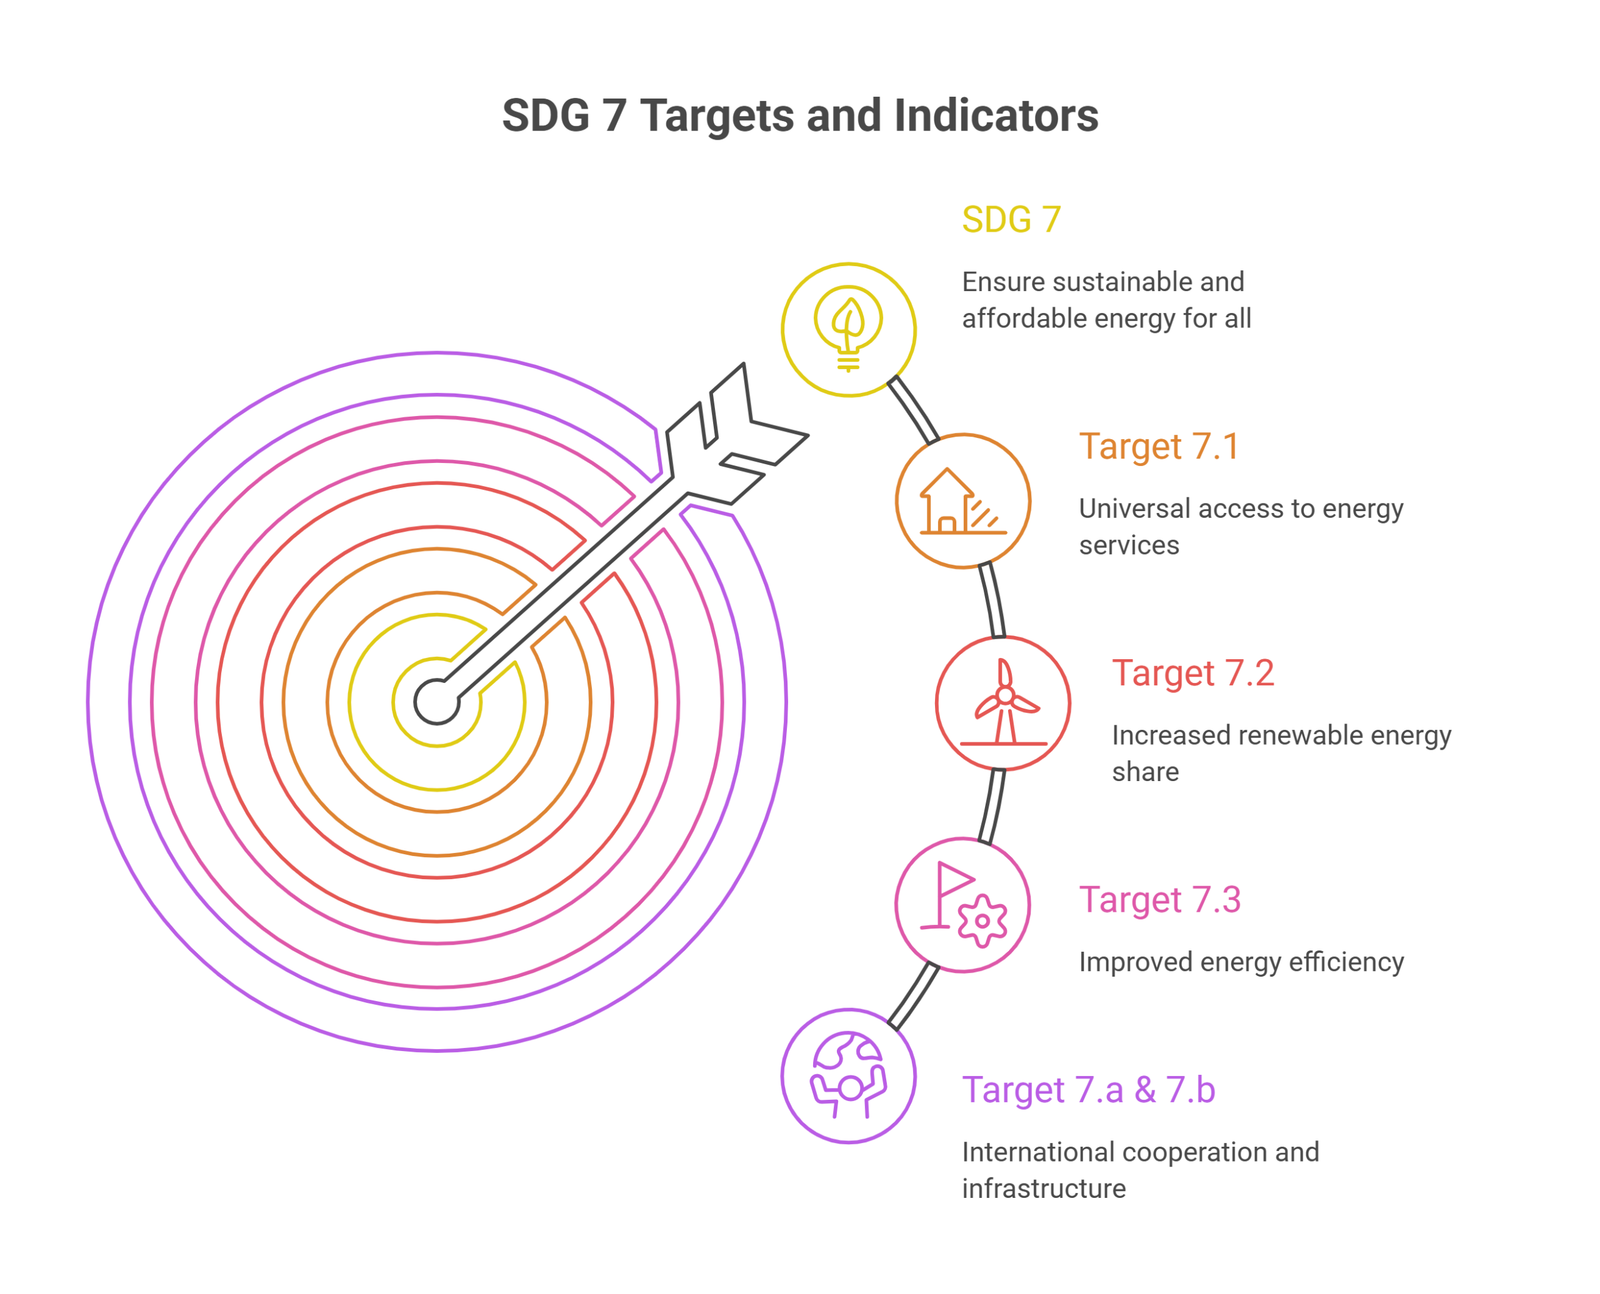
SDG 7 breaks down into five targets, tracked through six indicators, according to the UN’s SDG 7 page.
Target 7.1: By 2030, ensure universal access to affordable, reliable and modern energy services. Tracked through access to electricity, and access to clean cooking fuels and technology.
Target 7.2: By 2030, substantially increase the share of renewable energy in the global energy mix. Tracked through renewable energy’s share of total final energy consumption.
Target 7.3: By 2030, double the global rate of improvement in energy efficiency. Tracked through primary energy intensity, the ratio of energy supply to GDP.
Target 7.a: By 2030, enhance international cooperation on clean energy research, technology, and investment. Tracked through international financial flows to developing countries for clean energy.
Target 7.b: By 2030, expand infrastructure and upgrade technology for modern energy services in developing countries. Tracked through installed renewable energy capacity per person.
Where global progress actually stands
The picture comes from Tracking SDG 7: The Energy Progress Report 2026, the joint reference from five UN custodian agencies. Electricity access has nearly stalled. The rate held at 92% in both 2023 and 2024. Reaching universal access by 2030 now needs the pace to more than triple.
Progress has also slowed down, not sped up. Access grew by 0.77 percentage points a year between 2010 and 2020. Between 2020 and 2023, that pace fell to 0.39 percentage points a year. Rural areas carry most of the burden. Roughly 84% of people without electricity live in rural communities, per the same report.
Clean cooking access reached 75% in 2024. That leaves 2 billion people reliant on polluting fuels. Sub-Saharan Africa alone accounts for 970 million of them. Renewables reached 18% of final energy consumption in 2023. The rise has been gradual since 2015. Electricity is the strongest area of growth, but heat and transport both lag behind it.
Energy efficiency slowed. Primary energy intensity improved by just 1.5% in 2023, down from 2.4% the year before. Hitting the 2030 target now needs roughly 4.2% a year, according to the IEA’s SDG 7 tracking data. International financing barely moved. Clean energy flows to developing countries reached $24.6 billion in 2024, up only slightly from $24.4 billion in 2023. Flows to the poorest countries actually fell by 11%.
Installed renewable capacity hit a record 544 watts per person in 2024. High-income countries average 1,224 watts per person. Low-income countries average just 33.6 watts per person, a gap of more than 36 times.
The table below summarizes where the core SDG 7 indicators stood in the latest reporting.
| Indicator | Latest figure |
| Global electricity access rate | 92% (2024, stalled since 2023) |
| People without electricity | 655 million (2024) |
| Global clean cooking access rate | 75% (2024) |
| People without clean cooking access | 2.0 billion (2024) |
| Renewables’ share of final energy consumption | 18.0% (2023) |
| Primary energy intensity | 3.76 MJ per US dollar (2023) |
| International public finance for clean energy | $24.6 billion (2024) |
| Installed renewable capacity per person | 544 watts (2024) |
Source:IEA, IRENA, UNSD, World Bank, and WHO,Tracking SDG 7: The Energy Progress Report 2026.
Countries ranked by SDG 7 performance
Ranking countries on electricity access alone hides half the story. A country can reach 100% access and still run on gas. The table below ranks countries by both dimensions together: access first, clean energy share second, from the best combined performer down to the largest access gaps. That order shows overall SDG 7 performance, not just who has power.
Germany leads the pack. It combines full access with the cleanest grid on this list. China is close behind, adding more renewable capacity in a single year than most countries have installed in total. The UAE, US, and Saudi Arabia all have full access, but their clean energy shares split sharply apart as the ranking moves down. Kenya and the deficit countries anchor the bottom, still working toward full coverage in the first place.
| Rank | Country | Electricity access | Clean energy share | Standing |
| 1 | Germany | 100% | 62.7% renewable electricity (2024) | Best combined performer: full access, cleanest grid on this list |
| 2 | China | Near-universal | ~35% renewable electricity (2024) | Adds more solar and wind each year than most countries have installed in total |
| 3 | 46 other countries | 100% | Varies by country | Universal access reached between 2010 and 2024, mostly in North America, Europe, and Latin America |
| 4 | Bangladesh | Universal (2023) | Not separately tracked here | Reached universal access in 2023, among the fastest gains in developing Asia |
| 5 | India | 99.5% | Not separately tracked here | Reached near-universal access through the government’s Saubhagya electrification scheme |
| 6 | Cambodia | 99.15% | Not separately tracked here | Fastest average annual access gain in the world since 2010 |
| 7 | United Arab Emirates | 100% | 17% renewables and nuclear combined | Full access, but gas still supplies roughly 83% of the energy mix |
| 8 | United States | 100% | ~9% of total primary energy | Full access, but renewables lag well behind the 24% share of electricity alone |
| 9 | Saudi Arabia | 100% | 2.2% renewable electricity | Full access, weakest clean energy share on this list |
| 10 | Kenya | 77.0% | Rapid off-grid solar growth | Rapid off-grid solar expansion since 2015, still short of full access |
| 11 | Nigeria | Deficit of 87.2 million | Not separately tracked here | Largest single-country electricity gap in the world |
| 12 | Democratic Republic of the Congo | Deficit of 84.7 million | Not separately tracked here | Second-largest gap, driven by conflict and low investment |
| 13 | Ethiopia | Deficit of 57.3 million | Not separately tracked here | Third-largest gap, alongside fast recent progress |
| 14 | Malawi | 15.6% | Not separately tracked here | Among the three lowest national access rates worldwide |
| 15 | Chad | 13.4% | Not separately tracked here | Among the three lowest national access rates worldwide |
| 16 | South Sudan | 5.4% | Not separately tracked here | Lowest electrification rate in the world |
Sources:Tracking SDG 7: The Energy Progress Report 2026; World Bank,Access to electricity indicator (South Sudan); Energy Transition Africa,Africa Is Home to 86% of the World’s Electricity Access Gap.
Germany
Germany crossed a symbolic line in 2024. Renewable sources supplied 62.7% of net public electricity generation, a new record, according to Fraunhofer ISE. It was also the first full year without any nuclear power since 1962, after the last plants closed in 2023.
Wind remained the largest single source, supplying 33% of net public generation. Solar output jumped 18% year over year. It reached a record 72.2 terawatt-hours. Electricity-sector emissions fell to their lowest level since records began in 1990. Germany still targets an 80% renewables share of gross power consumption by 2030.
China
China is the clearest case of scale changing the picture. The country added a record 277 gigawatts of new solar capacity in 2024, according to Enerdata. It added another 80 gigawatts of wind. That single year of installations pushed China’s total renewable capacity past 1.83 terawatts.
Renewables made up about 35% of China’s total electricity generation in 2024, per Chinese government data reported by China Daily. China alone accounted for close to 64% of all new renewable capacity added worldwide that year, according to IRENA data. Coal still runs much of the grid, but its share is shrinking. New coal power permits dropped 83% in the first half of 2024 compared with the year before.
Bangladesh and India
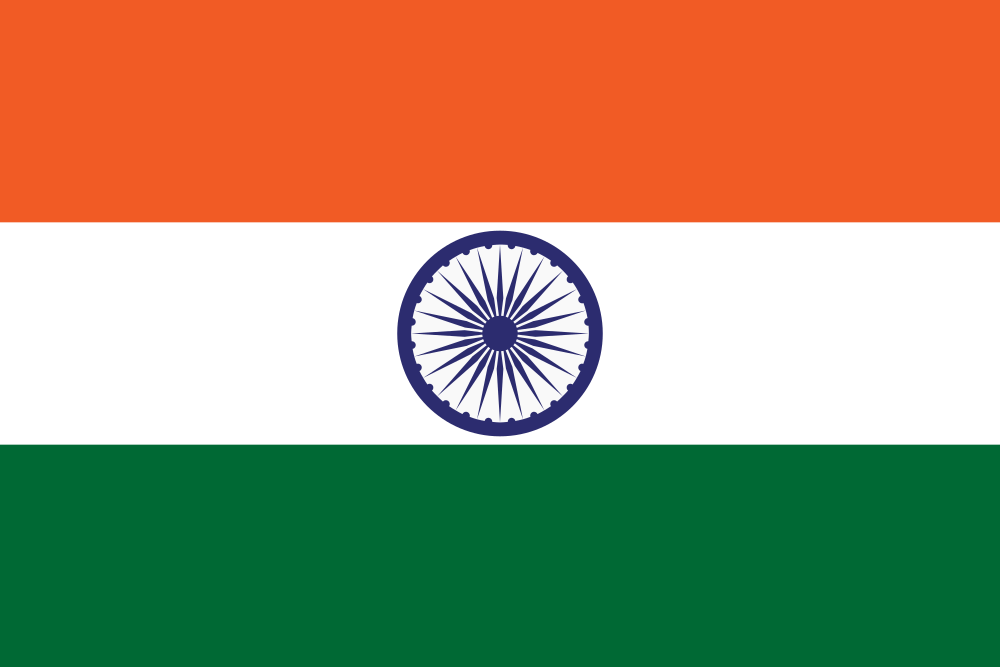
Bangladesh moved fastest in relative terms among the two. It reached universal electricity access in 2023, according to the IEA’s SDG 7 access analysis. India, Indonesia, and Bangladesh together drove most of developing Asia’s regional gain, pushing the region’s access rate to 97% in 2023, up from just 79% in 2010.
India reached near-universal electricity access in 2023, at 99.5% of the population, according to World Bank data. Coverage was only 60% as recently as 2000. The Saubhagya scheme, launched in 2017, pushed grid connections into millions of last-mile rural households.
Cambodia

Cambodia shows how fast a country can move from a low base. Its electrification rate reached 99.15% by 2024, according to World Bank data. That is among the highest average annual gains of any country tracked since 2010.
The country combined grid extension with targeted rural connection subsidies. It also kept a consistent, well-funded national electrification plan running for over a decade. Cambodia’s case backs a simple point: sustained government commitment moves the needle faster than most technology choices.
United Arab Emirates
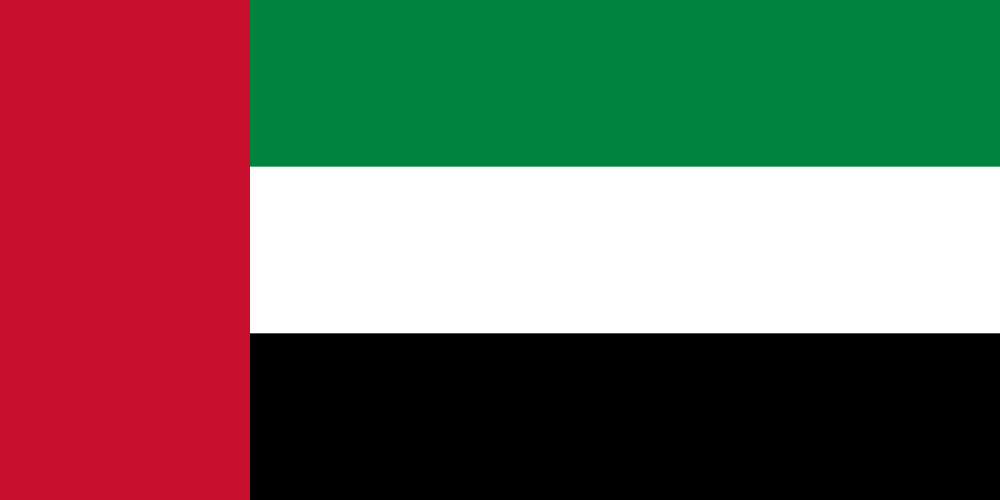
Energy abundance and clean energy are not the same thing. Nowhere shows that better than the Gulf.
The UAE has had universal electricity access for years, per World Bank figures. Its power supply still barely resembles a clean grid. Gas covers roughly 83% of the UAE’s energy mix. Renewables and nuclear together supply the remaining 17%, per a Rice University Baker Institute working paper. The country’s official Energy Strategy 2050 targets 44% renewables by mid-century. Dubai has set its own target of 75% clean sources, including nuclear, by 2050. Both remain targets, not current standing.
United States
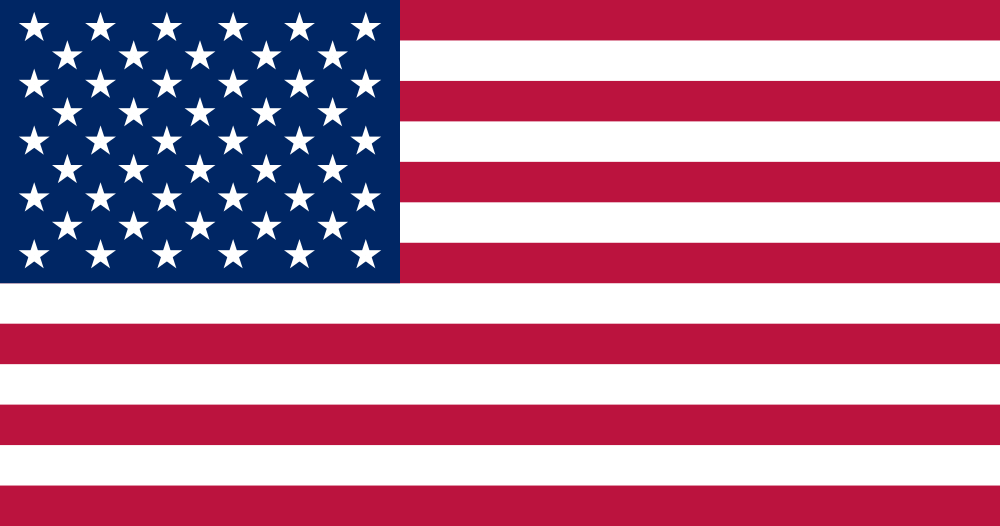
The US reached universal electricity access decades ago, so it barely registers in the access conversation. Its renewable story is more complicated. Renewables generated about 24% of US electricity in 2024, according to EIA data reported by Electrek. Wind supplied roughly 10% of that total, and solar is closing the gap fast.
Electricity is only part of total energy use, though. Once transport, industry, and heating are counted in, the picture changes. Renewables made up only around 9% of US primary energy consumption in 2024, per the EIA’s own accounting. Natural gas hit a record 34.2 quadrillion Btu that same year. The US shows how a country can lead on clean electricity generation and still lag on economy-wide decarbonization. The grid is simply easier to green than transport and industry.
Saudi Arabia
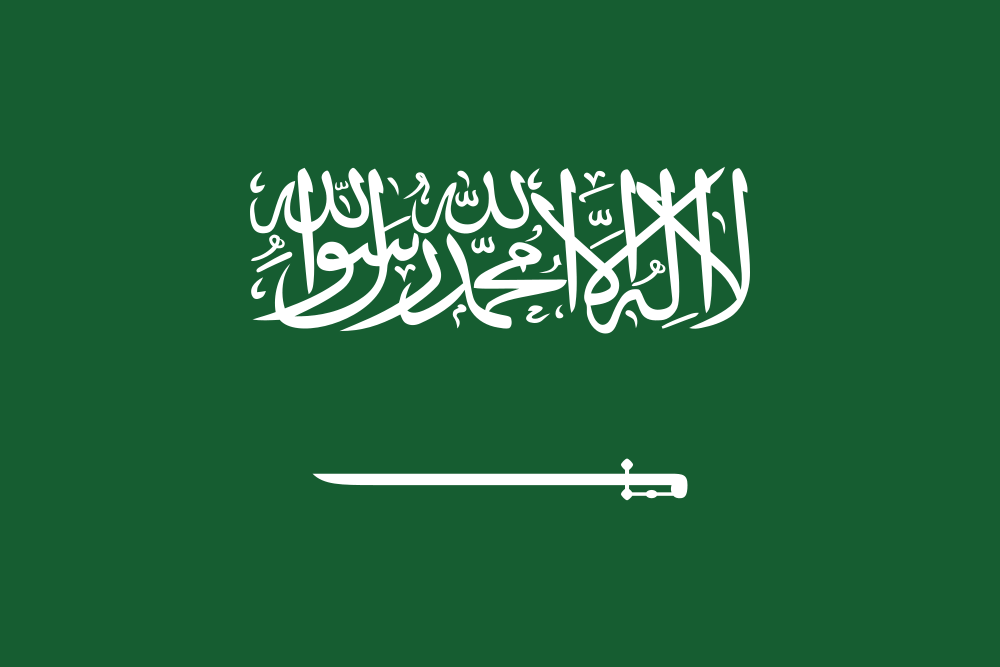
Saudi Arabia ranks below its Gulf neighbor. Its renewable share of its own electricity mix was just 2.2% in 2024, according to Ember Energy, despite a target of 50% renewables by 2030. Both Gulf states have some of the best solar resources on the planet. Neither has converted that resource into a large share of its own power mix yet.
Kenya
Kenya took a different route. It leaned on decentralized, off-grid solar instead of waiting for the grid to arrive. Between 2015 and 2023, Kenya connected roughly 20% of its population through off-grid solar alone, per World Bank access-to-electricity data cited in the 2026 Tracking SDG 7 report.
Pay-as-you-go solar companies made small daily payments possible for low-income households. That model, paired with mobile money, became central to Kenya’s progress. Kenya’s electrification rate reached 77% by 2024. Rwanda and Uganda used similar off-grid strategies with strong results of their own. Businesses financing similar decentralized projects can pressure-test the economics first with a battery storage and off-grid financial model.
The deficit and lowest-access countries
Nigeria, the Democratic Republic of Congo, and Ethiopia sit at the bottom of the ranking by absolute numbers. Together they hold about a third of the global electricity gap: Nigeria alone accounts for 87.2 million people without power, the DRC for 84.7 million, and Ethiopia for 57.3 million, according to Energy Transition Africa’s coverage of the 2026 Tracking SDG 7 report.
South Sudan, Chad, and Malawi have the world’s lowest national access rates instead, at 5.4%, 13.4%, and 15.6% respectively, per World Bank electrification data and The Global Economy’s African electricity access rankings.
Contrast the whole list with Brazil and Canada, both outside the table above. Brazil drew 47% of its energy from modern renewables in 2023. Canada drew 24%. Both lean heavily on hydropower. The lesson cuts both ways. Natural resources do not decide outcomes on their own. Policy, grid investment, and market structure do.
What organizations and institutions are doing
Five UN custodian agencies track and coordinate progress on SDG 7. There is no single global fund.
International Energy Agency: The International Energy Agency leads on renewables and energy efficiency data. It co-authors the annual Tracking SDG 7 report with four partner agencies.
International Renewable Energy Agency: IRENA tracks installed renewable capacity and international financial flows. Its data underpins most of the financing figures used in official SDG 7 reporting.
World Bank and Mission 300: The World Bank leads on electricity access data. It co-runs Mission 300 with the African Development Bank, a plan to connect 300 million Africans by 2030.
The World Bank has pledged $35 billion toward that goal. The African Development Bank has pledged a further $18 billion. Thirty countries have launched national energy compacts so far. The initiative aims to raise more than $90 billion in total funding.
World Health Organization: WHO leads on clean cooking data and health impacts. Household air pollution from polluting fuels remains one of the largest preventable health risks worldwide.
How businesses can contribute to SDG 7
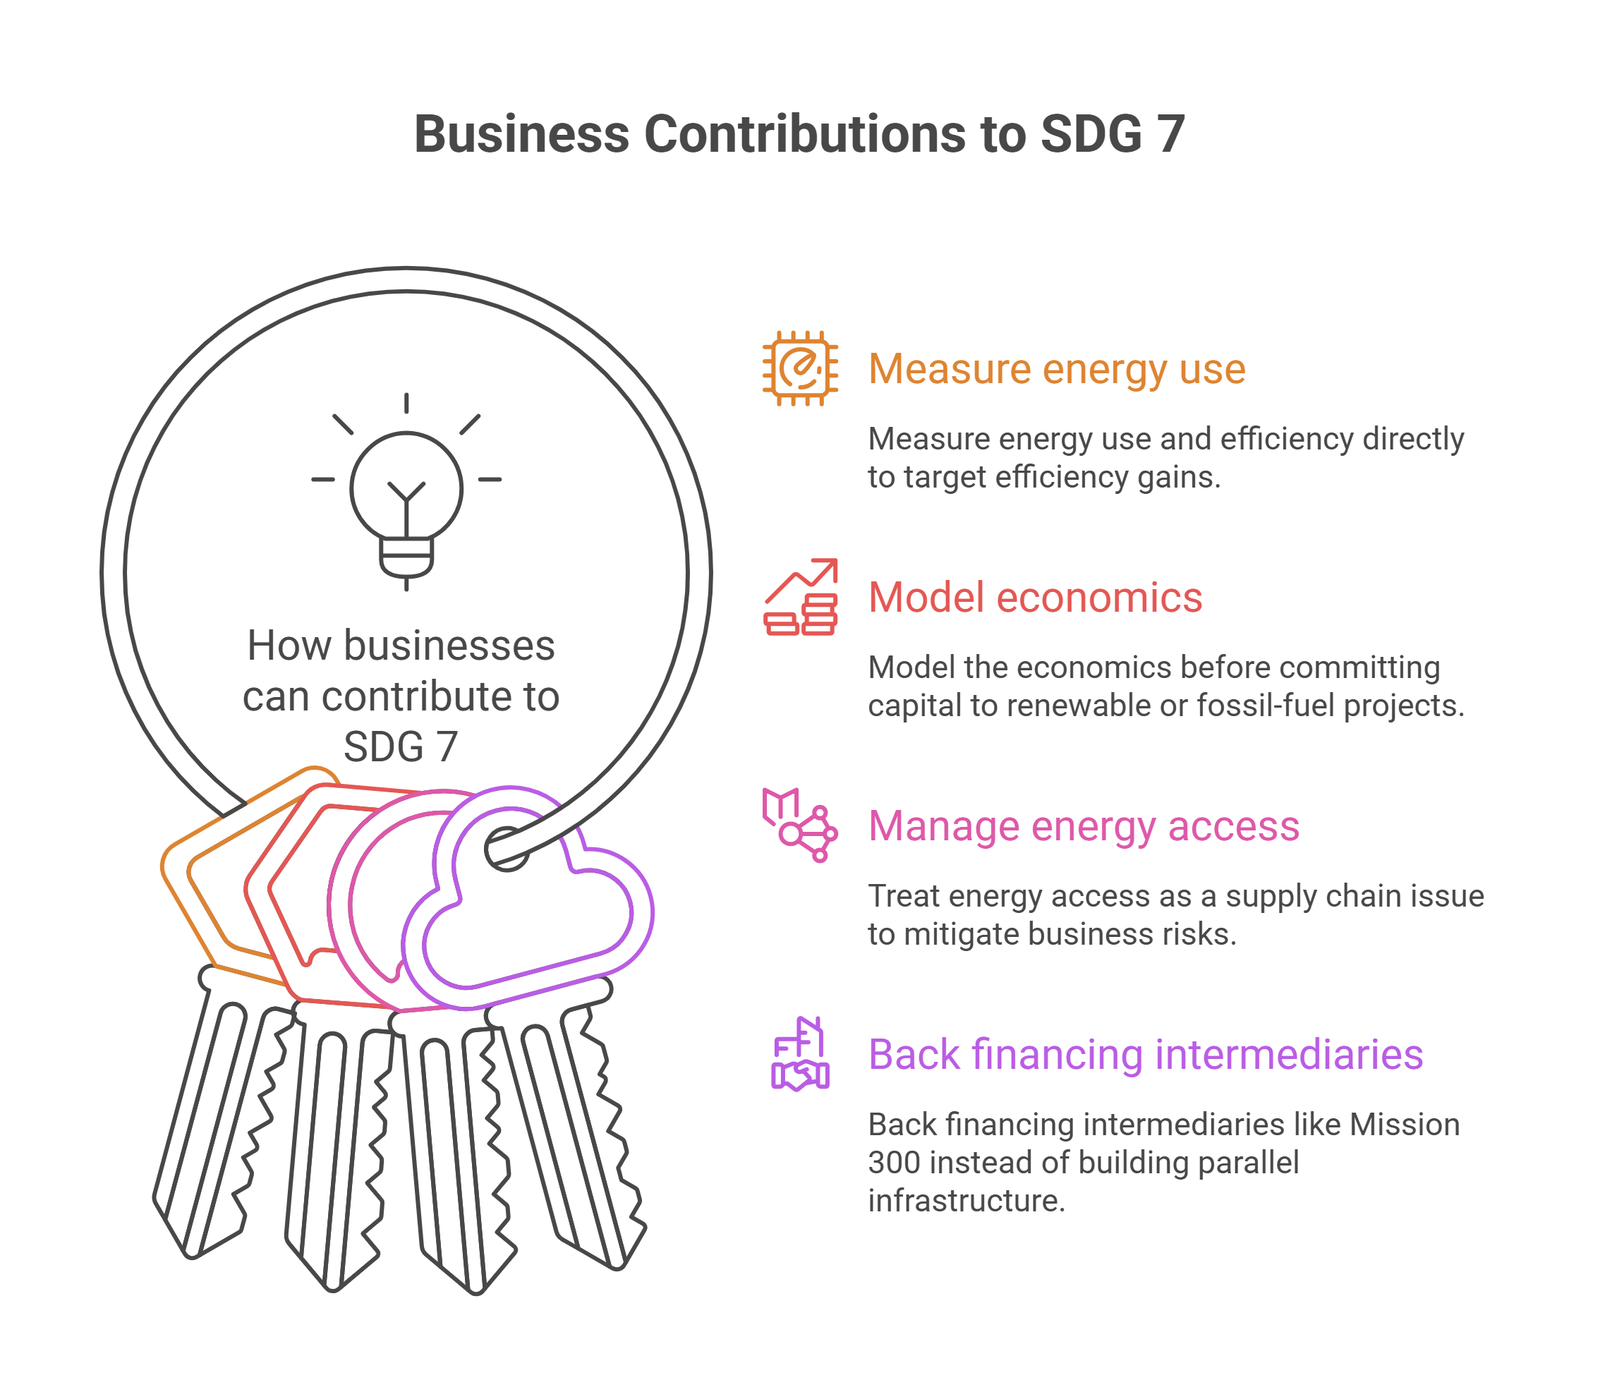
The same approach applies here as with any SDG a company has no formal mandate on. Start with where operations touch energy. Then look outward from there.
Measure energy use and efficiency directly. Target 7.3 covers efficiency gains businesses can act on today. Manufacturing, hospitality, and logistics are the most energy-intensive sectors. They stand to gain the most from efficiency audits.
Model the economics before committing capital. Renewable and fossil-fuel projects both carry real financial risk. A renewable energy financial model helps test financing structures and returns before capital moves. That applies whether the project is a solar buildout, a battery storage system, or a hydropower asset. The same logic applies to a shift away from fossil-fuel assets. An oil and gas financial model can clarify what that transition actually costs. ESG performance is also increasingly part of how investors judge it.
Treat energy access as a supply chain issue. Companies sourcing from Sub-Saharan Africa or South Asia should expect energy gaps among suppliers. Unreliable power raises costs and slows delivery. It is a business risk, not just a development issue.
Back financing intermediaries instead of building parallel infrastructure. Mission 300 and the custodian agencies already run coordinated financing channels. Adding capital to an established program usually reaches people faster. A standalone initiative rarely does.
Frequently Asked Questions
How many SDG 7 targets and indicators are there?
Five targets, tracked through six indicators. Three targets are outcome-focused. Two cover finance and infrastructure.
Is the world on track to meet SDG 7 by 2030?
No. The 2026 tracking report states plainly that electricity access, clean cooking, and efficiency are all off track.
Which countries have the best electricity access?
Forty-six countries reached universal access between 2010 and 2024, including the United States, Germany, and the UAE. Cambodia posted the fastest average annual gain of any country in that period.
Which countries have the worst electricity access?
South Sudan, Chad, and Malawi have the lowest national rates. Nigeria, the Democratic Republic of the Congo, and Ethiopia have the largest total populations without power.
Why do oil-rich Gulf states have low renewable energy shares?
Cheap, abundant fossil fuel supply reduces the financial pressure to switch. Saudi Arabia and the UAE both have ambitious renewable targets. Neither has hit them yet.
Does the US have a clean electricity grid?
Not yet, though it is getting cleaner. Renewables supplied about 24% of US electricity generation in 2024. That figure drops to around 9% once transport, heating, and industry are counted.
Why does China lead on renewable capacity but still burn so much coal?
China builds more solar and wind than the rest of the world combined. Its economy and grid are also far larger. Coal still supplies a large share of total generation even as that share shrinks.
Can a business without an energy mandate still contribute to SDG 7?
Yes. The clearest levers are measuring energy use, modeling project economics honestly, and backing supplier energy access.
Conclusion
The number worth sitting with is not the 92% of the world with electricity. That gain is real. The more telling number is that the pace of new connections has slowed since 2020, not sped up.
Cambodia shows what sustained, well-funded planning can do. Kenya shows what decentralized solar can do when paired with the right financing model. Germany and China show that fast decarbonization is possible at very different economic scales. The US, Saudi Arabia, and the UAE show something else. Full access and abundant resources do not guarantee a clean energy mix.
None of that gets solved by good intentions. It gets solved by capital that is modeled carefully before it moves.
Building a financial model for a renewable energy project, or rethinking the economics of an existing energy asset? Oak’s financial modeling services can help. Oak builds the numbers behind the transition.