


Oil and Gas Financial Model Excel Template


Original price was: $190.$95Current price is: $95.
The Oil and Gas Financial Model Excel Template is easy for those who have just entered the market. The Oil and GasFinancial Model Excel template includes all revenue inputs like changes in oil and gas rates, fluctuation in the market, and adjusted Production Table, and contract-based revenue is included for the easiness. An excellent tool for forecasting and financial planning. Moreover, the oil and gas financial modeling template will enable you to check whether the company is profitable and under what circumstances the business might face losses.
Frequently Bought Together
- Description
- Reviews (6)
- Testimonial
- Case Study
Description
Oil and Gas Financial Model Excel Template
Introduction
Hey there! Whether you’re a financial analyst in the gas industry or an entrepreneur entering this sector, understanding the Oil and Gas Excel Financial Model Projection Template can be a game-changer. It’s a financial planning tool designed specifically for energy companies, and it helps simplify financial statement analysis. Let’s delve into the details.
Understanding the Oil and Gas Excel Financial Model Projection Template
This template is a financial planning model tailored for fossil fuel companies. It offers insights into financial projections based on current data, and it’s an indispensable tool for gas companies. The beauty of this template lies in its versatility, as it not only offers financial analysis but also a deep dive into forecasting future cash flow, ensuring a company’s financial feasibility in the forecast period.
The Oil and Gas Financial Model Excel template presents the business case of a business with an upfront investment in different sections of the company. The model contains the three financial statements, including the cash flows, and calculates the relevant metrics (Sensitivity Analysis, Break-even Analysis, Diagnostic Tools, Project evaluation, and Charts). The financing options for the project include a standard long-term loan, an investment made by the investors, and, of course, a marketing sheet (including automated inbound and outbound marketing costs sheet), which also contains how many customers will achieve as a result.
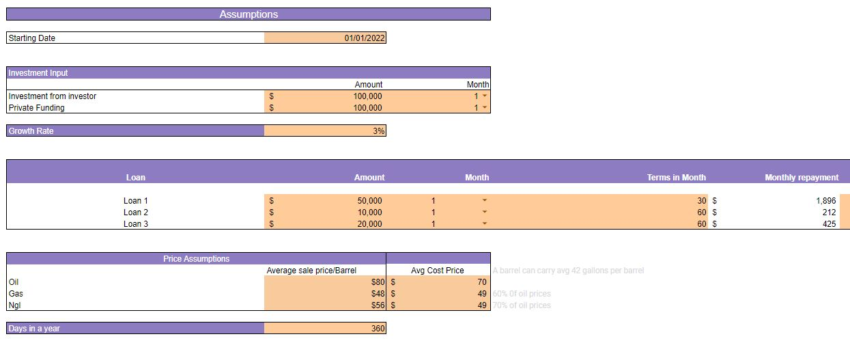
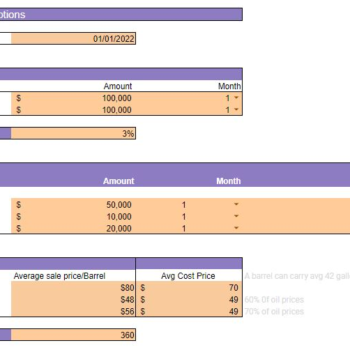
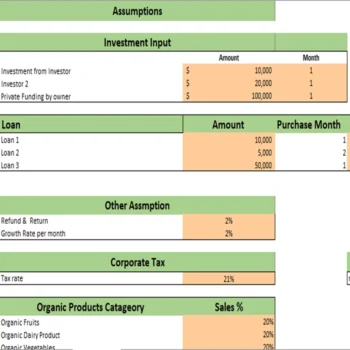
On the Input tab of the Oil and Gas Financial Model Excel template, you can feed the financial information for the model. Such as sales price, cost, expenses, etc. The peach fill column shows the inputs in the model and call-up (direct links from other cells) filled in grey with black letters, while calculations depict white fill and black characters.
Key Inputs of Oil and Gas Financial Model Excel Template
- The growth rate, Price, and Expense.
- Various Bouquets with prices and segmentation of revenue.
- Marketing Budget Sheet (which measures how many customers we get from marketing).
- Revenue Assumptions
- Average Payable and Receivable days your business is following.
- Cost of Goods.
- Fixed Asset and Capital Expenditure.
- Tax Rate
- Investment table
- Loan table
Key Components
Input Sheet

This financial model template of the Oil & Gas Financial Excel Model contains inputs that, when changed, impact the calculations. The changes are applied to all relevant sheets. As a result, this financial model always has built-in flexibility to display different outcomes or final estimates based on this sheet’s changes.
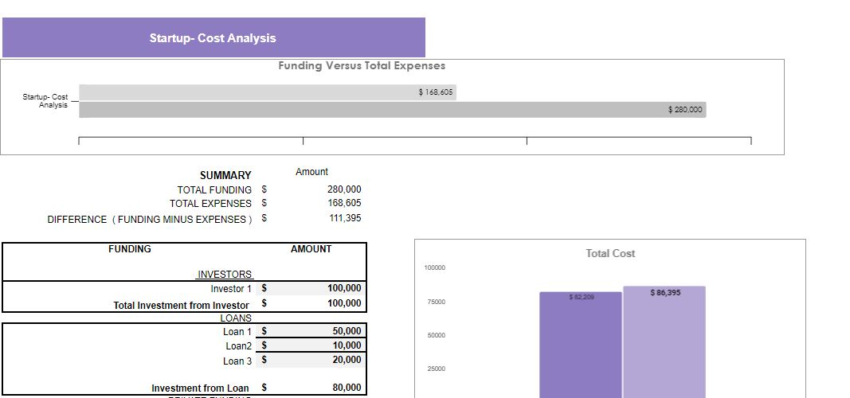
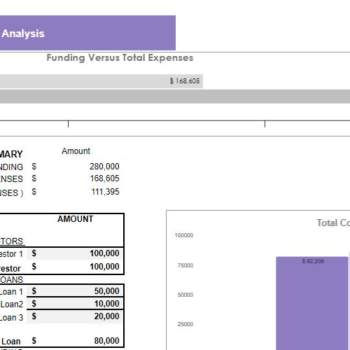
Start-up Summary

A start-up summary tab includes the total cost incurred at the start of business and capital expenditure, how much cash has been injected by the company so far, and based on the number of months, the amount of investment required is calculated.
A Start-up Summary helps you take a realistic view of your idea and double-check whether the business has enough funds to support operations.
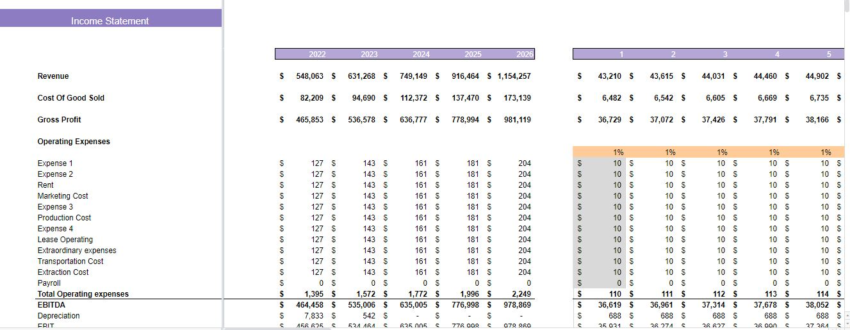
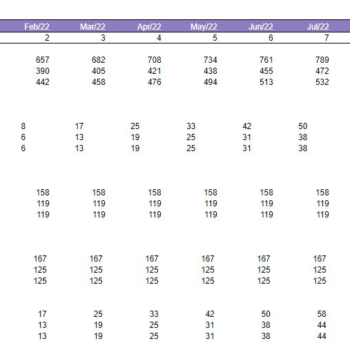
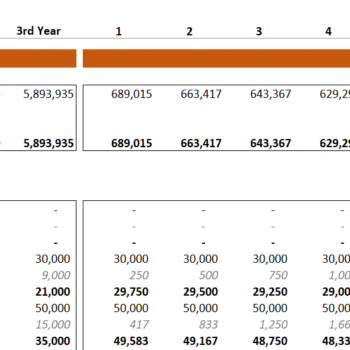
Monthly & Yearly Income Statement

The Oil and Gas Financial Model Excel Template provides the monthly and yearly income statement structure and a framework for creating a full corporate forecasting model tailored to your business.
A vital feature of the Oil and Gas Financial Model Excel Template is its “integration,” which means that the Income Statement is modeled accurately to capture the connection and interlinkages of the various line business items. An integrated financial model is powerful since it enables the user to change any assumption to see how it impacts all other parts of the statements accurately and consistently.
The monthly Income Statement sheet is perfect for those who require regular reporting and details. Additionally, Income Statement contains all revenue streamlines with gross and net earnings linked with a revenue analysis sheet to ensure accurate reporting. Oak Business Consultants understands every Oil and Gas business’s goal. Therefore, we have developed a mechanism that helps business owners determine whether they are making profits.
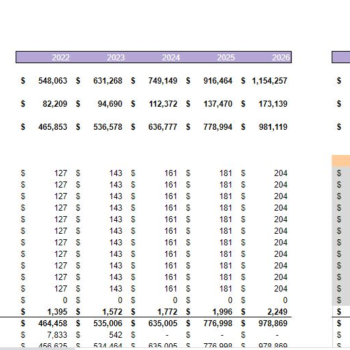
Furthermore, the Yearly Income Statement gives you complete insights into revenue and general & administrative expenses. The Yearly Income Statement also contains several graphs, assumptions, ratios, cost of services, and profit after tax.
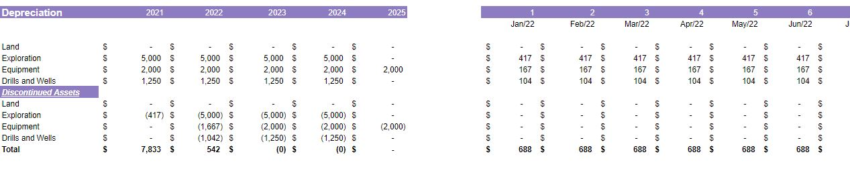
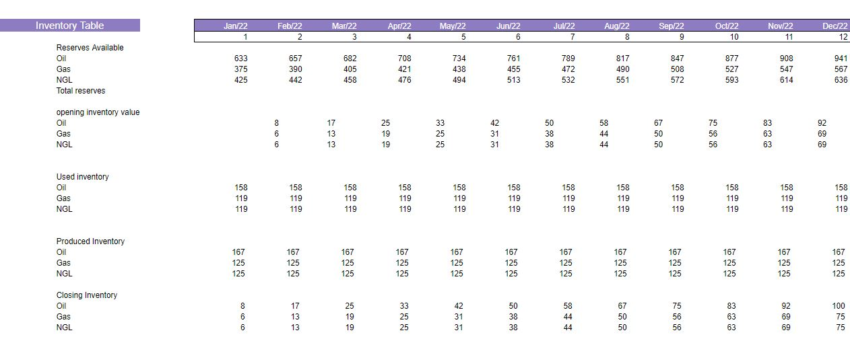
Inventory Module

The inventory module helps companies identify which and how much stock to order at what time. It tracks inventory from purchase to the sale of goods. The practice identifies and responds to trends to ensure enough supply to fulfill customer orders.
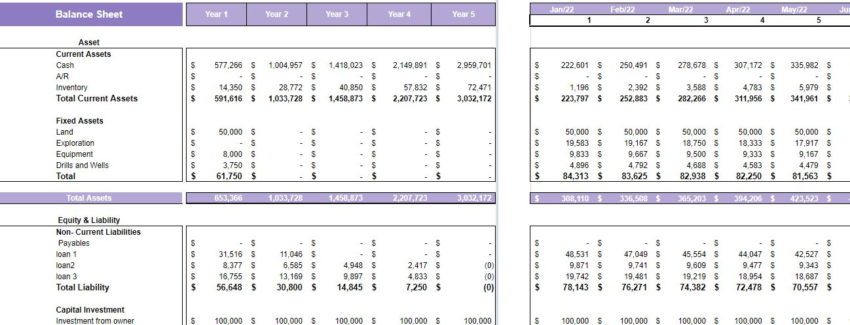
Balance Sheet of Oil and Gas Financial Model Template
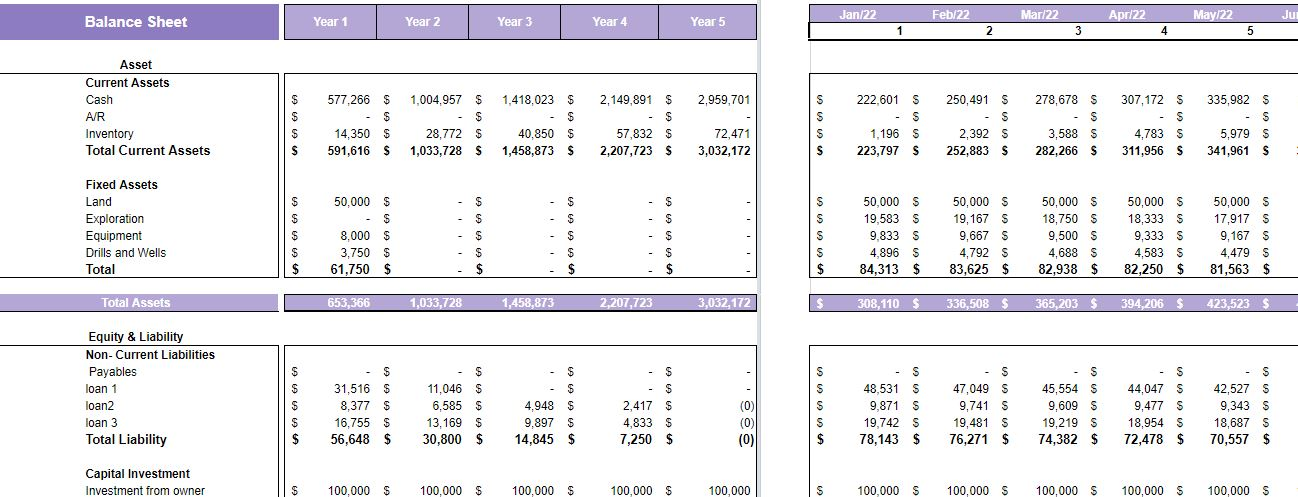
This Oil and Gas Financial Model Excel Template balance sheet enables you to analyze your position of current assets, fixed assets, liabilities, and equity. This also allows you to monitor your accounts receivable, accounts payable, accrued expenses, etc. Therefore, this specific financial model gives you the perfect space to analyze your critical financial balance accounts.
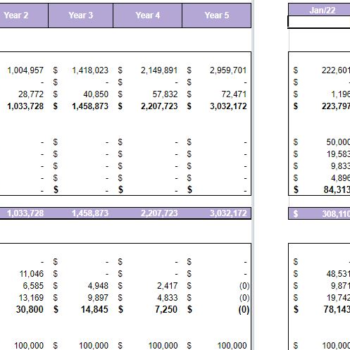
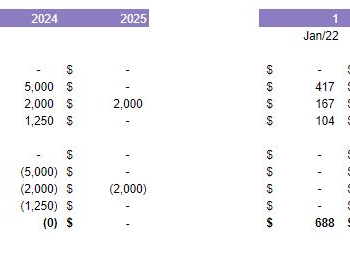
Cash flow
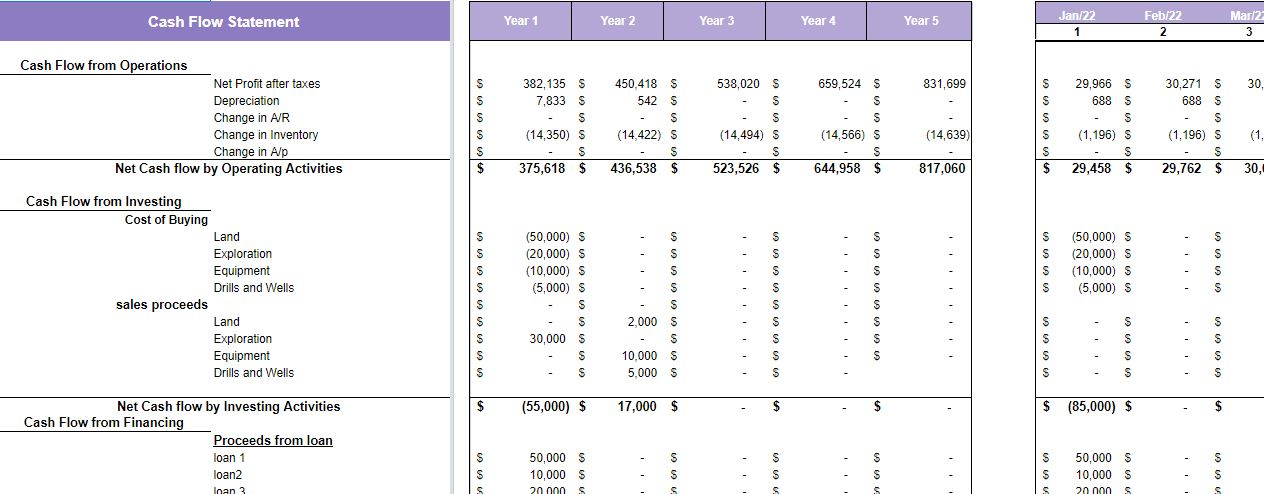
The Cash Flow Statement is the vital part of the three statements that report the cash spent and generated during a specific period. The Cash Flow Statements act as a bridge between the income statement and the balance sheet by how money has moved in and out.
Three main sections of the Cash flow Statement:
- Operating Activities: We have included all cash in and out related to the operations of the business
- Investing Activities: Any cash from the disposal and acquisition of an asset has included in this section. This calculation is linked from the fixed asset and input tab.
- Financing Activities: We have separately made a loan-related tab where you can enter all loan-related information. The account is linked to the Financing Activities of Cashflow Statement.
The Cashflow Statement in our Model contains a dedicated sheet to monitor and analyze your company cash-ins and out. This cash flow statement is based on several key inputs. Such as Payable and Receivable Days, yearly income, working capital, long-term debt, net cash, etc. Moreover, this calculation computes your net cash flow and beginning and end cash balances. This is a perfect template for your company’s cash flow management.
Break-Even Analysis of Oil and Gas Financial Model Template
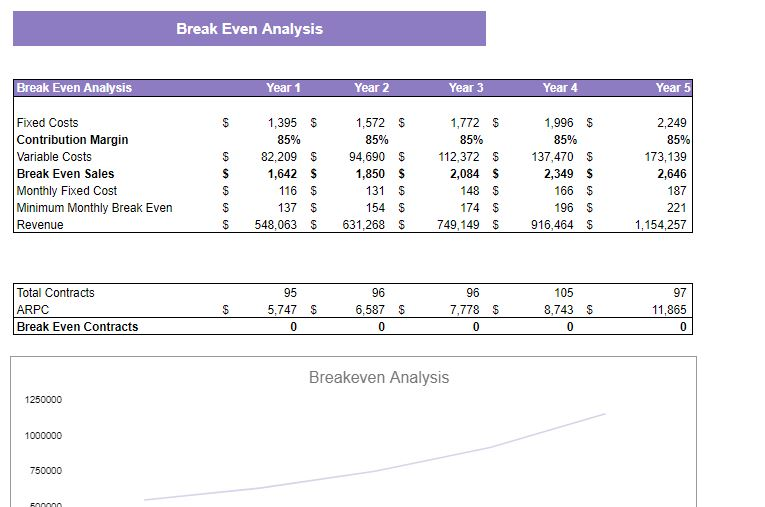
A break-even analysis of the Oil and Gas Financial Model Excel template can help you measure how different scenarios might play out financially. For example, if you increase the marketing budget or add another employee to the payroll, how many extra sales will be needed to recover that additional expense?
We have included a Break-even analysis in our Oil and Gas Financial Model Excel Template, which will help the user to determine sales. The break-even analysis will help you know, at a glance, the profits generated at the various sales levels. In addition, the Break-Even Analysis is where your total sales contribution refers to fixed cost at zero profit and loss. This Technique is primarily based on marginal costing, which behaves differently at various levels of output activity.
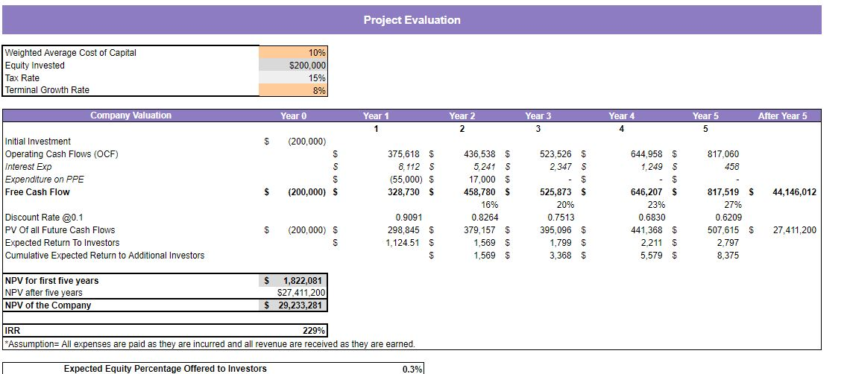
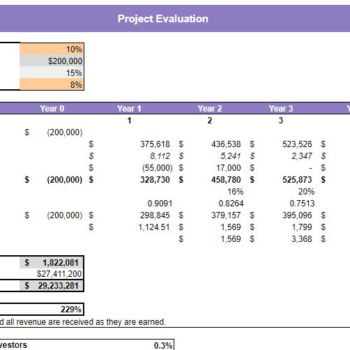
Project Evaluation of Oil and Gas Financial Model Excel Template

Since the table calculates Return on Investment, Investor’s Future Equity Share, and Cash Burn Rate Analysis, analyzing the company’s performance becomes easy to capture potential investors.
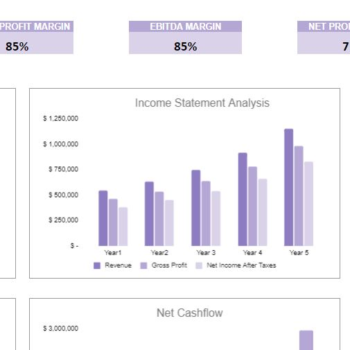
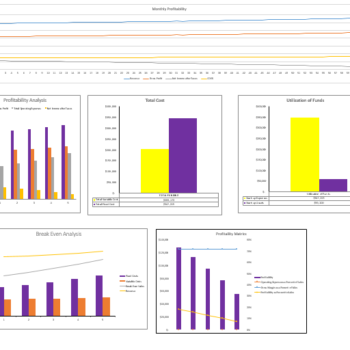
Dashboard
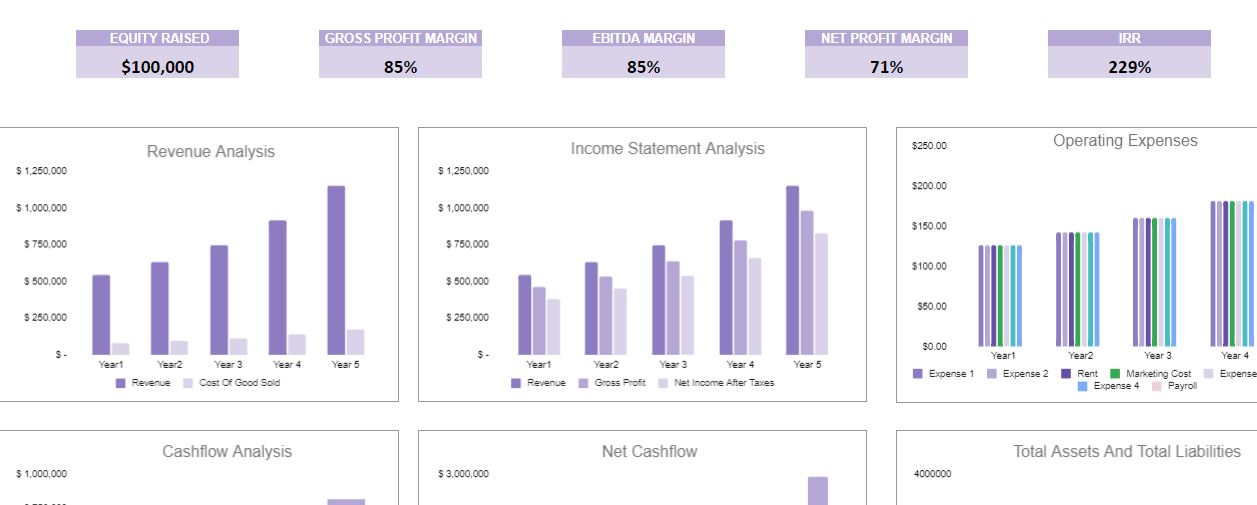
Although, Users and readers respond and process visual graphs better than data. Because this dashboard provides you with a graphical management tool that enables you to track all your relevant financial KPIs, improve cash flow management, and track expenses, sales, and net revenue in detail to meet and outperform the financial objectives of your business.
Frequently Asked Questions
1. What is the primary purpose of the Oil and Gas Excel Financial Model Projection Template?
The primary purpose of the Oil and Gas Excel Financial Model Projection Template is to aid gas companies in financial planning, offering a detailed overview of their financial statements. This financial model template streamlines financial projections for the forecast period, assessing the future cash flow while considering average prices, variable costs, and capital expenditures inherent in the gas industry.
2. How often should I update or adjust the data in this financial model?
For optimal financial statement analysis and accurate Financial Analysis, it’s recommended that gas companies update or adjust data in this financial model at least quarterly. However, in rapidly fluctuating market conditions or significant changes in average prices, more frequent updates can help ensure precise cash flows projections.
3. Are the templates adaptable to different regions and their specific market conditions?
Yes, the templates are designed with flexibility for the gas industry worldwide. They accommodate different regions’ market conditions, allowing energy companies to adjust for regional average prices, regulatory environments, and other regional specifics in their financial planning models.
4. Can I incorporate historical financial data into the model, and how does this enhance the projections?
Absolutely. Incorporating historical financial data enhances financial projections by providing a foundation for trend analysis. This allows for more accurate forecasting of cash flows and provides a deeper layer of financial statement analysis, ensuring a clearer picture of financial feasibility for energy companies.
5. How do the templates account for unpredictable events or drastic market changes in the gas industry?
The templates incorporate sensitivity analysis, a pivotal feature in Financial Modeling, which analyzes how various factors can impact financial projections. For the gas industry, this could involve drastic changes in oil prices or unforeseen market events, ensuring gas companies are prepared for various scenarios.
6. What measures are in place within the template to ensure accuracy in financial projections?
The template uses a robust combination of financial planning tools, such as Break-even analysis, sensitivity analysis, and meticulous financial statement analysis. By focusing on accurate data inputs, particularly for balance sheet items and cash flows, the model ensures precision in future cash flow projections.
7. How does the model handle fluctuating oil and gas prices in its revenue analysis?
Fluctuating oil and gas prices are addressed using sensitivity analysis within the model. By examining different average prices scenarios and their implications on revenue, the model provides energy companies with a range of financial outcomes, aiding in informed decision-making.
8. Is the startup summary suitable for both new enterprises and existing gas companies looking to venture into new projects?
Certainly! The startup summary is designed to capture initial capital expenditures and other financial planning aspects, making it ideal for new enterprises. However, it’s also tailored to assist existing gas companies venturing into new projects, ensuring clarity in their financial planning.
9. How does the Break Even Analysis factor in the variable costs unique to the oil and gas sector?
The Break-even analysis in the model meticulously factors in variable costs associated with the gas industry. This includes costs related to drilling, transportation, and other sector-specific expenses, providing a clear picture of the financial feasibility of operations at different production and price levels.
10. Can the template be integrated with other financial planning tools or software commonly used in the gas industry?
Yes, the financial model template is designed with adaptability in mind. It can seamlessly integrate with various financial planning tools and software frequently used by fossil fuel companies, enhancing its functionality and applicability.
11. How does sensitivity analysis in the model cater to regulatory changes that might affect the gas industry?
The model’s sensitivity analysis delves into various scenarios, including potential regulatory changes. This feature aids gas companies in understanding how such changes might influence their cash flows, balance sheet, and overall financial projections.
12. Are there specific balance sheet items that this model emphasizes due to the nature of the gas industry?
Indeed, the model lays special emphasis on balance sheet items vital to the gas industry, like assets associated with drilling operations, capital expenditures for infrastructure, and liabilities connected to environmental responsibilities, ensuring a comprehensive financial statement analysis.
13. How does the Oil and Gas Excel Financial Model accommodate for long-term capital expenditures?
The model intricately maps out long-term capital expenditures, accounting for investments in exploration, drilling, infrastructure, and more. By considering the payback period and potential returns, it aids gas companies in long-term financial planning.
14. Is there a section within the model to factor in environmental considerations and potential costs for energy companies?
Yes, the model has provisions for environmental considerations, reflecting potential costs and liabilities that energy companies might face. This ensures a holistic financial planning approach, accounting for both fiscal and environmental responsibilities.
15. How user-friendly is the dashboard for individuals who may not have extensive experience in financial modeling?
The dashboard is intuitively designed, ensuring ease of use even for those new to financial modeling. With clear sections, visual representations, and guided workflows, it aims to simplify the financial analysis process for all users in the gas industry.
More About Financial Modelling
Confused?
Contact our expert if you are confused about buying our template. The experts can provide you with a 15 min DEMO of the financial model, including the following.
- How to use the model
- What are the Key Inputs
- Will this work with your business model
Need Changes
You can pay a few extra dollars to include your desired changes in the financial model template. Book a meeting with our consultant today.
Consultation
If you are unsure about the numbers, you can hire us as your consultants. Furthermore, we have a pool of Financial Experts who could advise numbers like growth rate, first-year operational expenses, employee headcount, etc.
This Product Includes: 1 Excel File
We also provide a Gas Station Business Plan that will provide you with a complete business overview.
Walk-through Video Oil and Gas Financial Model Excel Template
The following video will give you an overview of the financial model’s different components and help you understand how it works.
6 reviews for Oil and Gas Financial Model Excel Template
Add a review
You must be logged in to post a review.
Our objective is to offer services that meet the demands of our customers, and it is crucial to create a favorable image and gain loyal customers by meeting their expectations. For this reason, it is advisable to collect feedback from customers to assess the product’s effectiveness and make necessary improvements. Please find an example of a customer testimonial below.

This case study focuses on the financial trend and highlights the impact of the global crisis and how oil and gas companies managed to deal with it. Furthermore, it also focuses on the product portfolio and the efficiency of oil and gas companies operations by evaluating Asset management and other relevant financial ratios. For more information, click Oil and Gas Financial Analysis Report – A Case Study here.
You may also like…
- Browse by Categories, Browse by Industry, Business Plan, Deals, Retail Business Plan, Retail Industry Solutions, Services/ Consulting, Services/ Consulting Business Plan
Gas Station Business Plan
Original price was: $300.$99Current price is: $99.


Bin Omar –
The Oil and Gas Financial Model Excel Template is an excellent tool for project evaluation and planning. Its built-in sensitivity analysis feature has been particularly helpful for assessing different scenarios. I’m extremely satisfied with this purchase.
Emily Watkins –
I was amazed by how professional and comprehensive this model is. From revenue forecasting to expense tracking, it covers every detail necessary for oil and gas project planning. Highly recommend it to industry professionals.
Brian Parker –
As someone new to financial modeling in the oil and gas sector, this template was a lifesaver. It’s intuitive and provides clear breakdowns of costs, revenues, and profitability. It’s worth every penny
Kate Brown –
I recently used the Oil and Gas Financial Model Excel template for my business and I must say, I am thoroughly impressed with its capabilities. The model is very comprehensive and contains all the necessary financial statements and metrics needed for an oil and gas business case.
Emily Dugray –
Using this model, we were able to get our finances in order, forecast each quarter, and make feasible business decisions. Highly satisfied.
Ethan Ben –
The Oil and Gas Financial Model Excel template is a fantastic tool for financial modeling. Its Input and Projection Valuation tabs are easy to use and the Sensitivity Analysis and Dashboard tabs provide valuable insights into various business scenarios. I highly recommend this template to anyone in the oil and gas industry looking for a comprehensive financial modeling tool.