How to Find Cost of Goods Available for Sale?
Cost of Goods Available for Sale: How to Compute It Correctly
Every business that sells a physical product needs to know one number before anything else: how much did the goods you could have sold actually cost? That number is the cost of goods available for sale. It sits at the heart of your income statement, shapes your gross profit, and tells you whether your inventory management is working.
This guide walks through the formula, the components, real examples, and the methods businesses use to track it.
What Is Cost of Goods Available for Sale?
The cost of goods available for sale is the total cost of all inventory a business had ready to sell during an accounting period. It combines what you already had at the start of the period with everything you added during it.
This figure feeds directly into your cost of goods sold calculation and shows up on your financial statements. Without it, you cannot close your books accurately.
The Core Formula
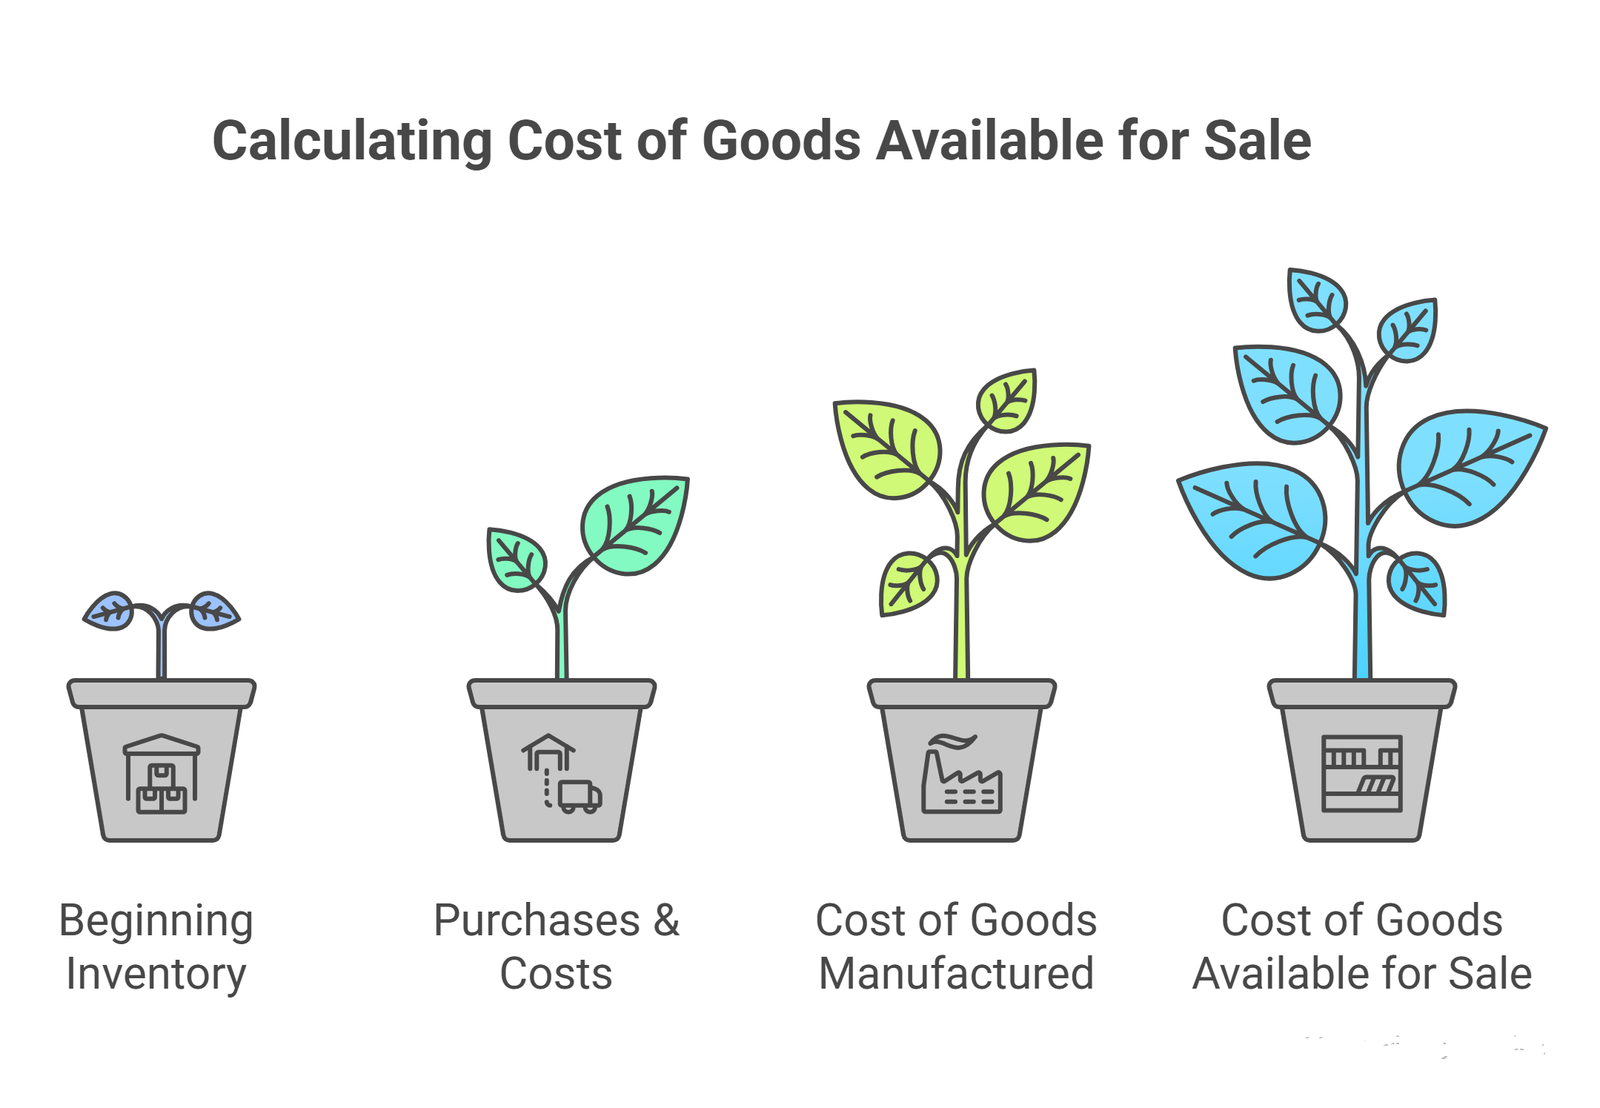
The cost of goods available for sale formula is simple:
Beginning Inventory + Net Purchases (or Cost of Goods Manufactured) = Cost of Goods Available for Sale
Once you have this number, you subtract ending inventory to arrive at cost of goods sold:
Cost of Goods Available for Sale minus Ending Inventory = Cost of Goods Sold
Cost of goods sold then flows into your income statement, where it reduces revenue to give you gross profit.
Breaking Down Each Component
Beginning Inventory
Beginning inventory is the value of stock you carried over from the prior period. It equals the ending inventory balance from the previous month or year. If your books closed with $40,000 in merchandise inventory, that is where the new period starts.
A consistent approach to inventory valuation keeps this number reliable. If you switch methods mid-year, your beginning inventory balance will be off and everything downstream will be wrong.
Purchases and Additional Costs
For retailers and wholesalers who buy finished goods for resale, purchases are the main addition to inventory. But the purchase price is not the only cost that matters.
You also need to add:
Freight in and freight inward costs. These are the shipping costs you pay to get goods from your supplier to your location. Freight-in costs are a direct cost of acquiring inventory. They belong in the cost of goods available for sale, not in operating expenses.
Supplier invoices sometimes include other charges. Import duties, insurance on shipments, and handling fees are all part of getting inventory to a sellable state.
Purchase records should capture all of these costs, not just the base price. If your accounting department books freight separately, make sure it is being included when you calculate inventory value.
Cost of Goods Manufactured
For manufacturing companies, there are no outside purchases of finished goods. Instead, you build products from scratch. The cost you add to inventory each period is the cost of goods manufactured.
That figure has its own components:
Direct materials are the raw materials that go into the product. For a furniture maker, that is lumber, hardware, and fabric. For food and beverages companies, it is ingredients. Direct materials are tracked from raw materials through Work-in-Process Inventory to finished goods.
Additionally, a company pays direct labor wages to workers who physically make the product. These costs tie directly to production and do not count as overhead.
Manufacturing overhead covers everything else that supports production but is not tied to a single unit. Factory overhead includes utilities for the factory floor, depreciation expense on manufacturing equipment, and manufacturing costs like maintenance and supplies. Manufacturing overhead gets allocated across units produced, often using a predetermined rate.
The sum of direct materials, direct labor, and manufacturing overhead gives you total manufacturing costs for the period. Add the beginning Work-in-Process Inventory and subtract ending Work-in-Process to get cost of goods manufactured.
Then move finished goods into Finished Goods Inventory, and they become part of the cost of goods available for sale.
The Full Calculation for a Manufacturer
Here is a straightforward example. A manufacturing company starts the quarter with:
Beginning raw materials: $15,000 Beginning Work-in-Process Inventory: $8,000 Beginning Finished Goods inventory: $22,000
During the quarter: Raw materials purchased: $50,000 Direct labor: $30,000 Factory overhead: $20,000
Ending Work-in-Process: $10,000 Ending raw materials: $12,000
- Step one. Calculate raw materials used. $15,000 plus $50,000 minus $12,000 equals $53,000 in direct materials used.
- Step two. Calculate total manufacturing costs. $53,000 direct materials plus $30,000 direct labor plus $20,000 manufacturing overhead equals $103,000.
- Step three. Calculate cost of goods manufactured. $8,000 beginning Work-in-Process plus $103,000 minus $10,000 ending Work-in-Process equals $101,000.
- Step four. Calculate the cost of goods available for sale. $22,000 beginning Finished Goods inventory plus $101,000 cost of goods manufactured equals $123,000.
If ending Finished Goods inventory is $18,000, then cost of goods sold is $105,000.
The Full Calculation for a Retailer
A boutique jewelry shop starts the month with $30,000 in merchandise inventory.
During the month it buys $25,000 in new stock and pays $1,500 in freight in charges. It also gets a $500 purchase return credit.
Net purchases equal $25,000 plus $1,500 minus $500, which is $26,000.
Cost of goods available for sale equals $30,000 plus $26,000, which is $56,000.
If ending inventory is $20,000, cost of goods sold is $36,000.
That cost of goods sold number goes on the income statement. Gross profit is revenue minus cost of goods sold. If the shop had $60,000 in sales, gross profit is $24,000 and the gross margin percentage is 40 percent.
Inventory Valuation Methods
The number you get depends on how you value your inventory. There are several inventory valuation methods, each producing different results.
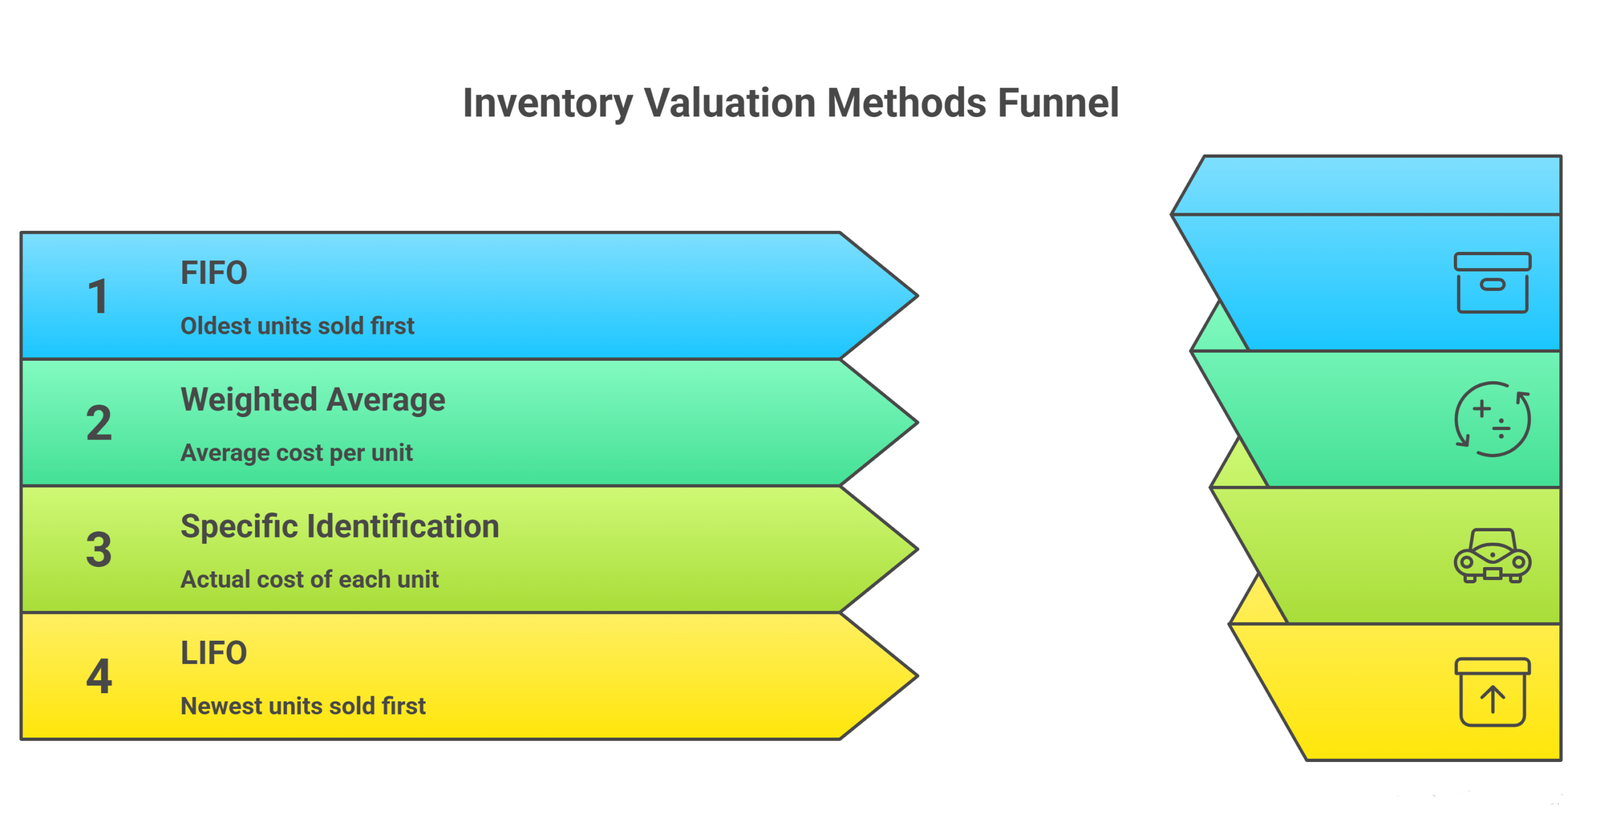
FIFO
The FIFO assumption (first in, first out) treats the oldest units as the ones sold first. When prices rise, FIFO produces lower cost of goods sold and higher gross profit because the cheaper older units leave inventory first. Ending inventory reflects more recent, higher costs.
Weighted Average
The average cost method or weighted average method divides total inventory cost by total units to get a single cost per unit. Every unit sold uses that blended rate. This smooths out price swings and is popular with businesses that handle large volumes of similar items.
Specific Identification
The specific identification method tracks the actual cost of each individual unit. Car manufacturers and dealers use this because each vehicle has a unique cost and identifier. It is precise but requires detailed purchase records for every item.
LIFO
LIFO (last in, first out) assumes the newest units are sold first. It is not permitted under IFRS but is used by some companies in the United States. It produces higher cost of goods sold in a rising-price environment, which lowers taxable income.
The method you choose must stay consistent. Switching methods changes inventory account balances, affects gross profit, and requires disclosure in your financial statements.
Why Ending Inventory Accuracy Matters So Much
Your ending inventory figure determines both cost of goods sold and the asset value on your balance sheet. An error in ending inventory flows through to every profitability metric.
A physical inventory count at period end is the most direct way to verify ending inventory. But many businesses also run a cycle counting program throughout the year, counting sections of inventory on a rotating basis. This catches discrepancies before they compound.
When inventory count reveals damaged goods or obsolete inventory, those items need to be written down. Inventory write-downs reduce the carrying value of inventory and hit the income statement as additional cost. A reserve for obsolete inventory can smooth this over time, but the underlying issue is usually a purchasing or inventory management problem that needs to be fixed operationally.
The Gross Profit Method
If a business needs to estimate ending inventory for interim periods without a physical count, the gross profit method is a common shortcut.
The logic works in reverse. Start with cost of goods available for sale. Apply the historical gross margin percentage to estimated sales to get an estimated cost of goods sold. Subtract that from cost of goods available for sale to estimate ending inventory.
This is useful for insurance claims or quick projections, but it is not a substitute for actual inventory valuation for formal financial statements.
Distribution and Other Costs That Do Not Belong Here
It is worth being clear about what is not included in the cost of goods available for sale.
Distribution expenses, selling and general and administrative expenses, and operating expenses are period costs. They go on the income statement below gross profit, not into inventory.
Shipping costs you pay to deliver goods to customers are not freight in. They are outbound freight, a selling expense. Only inbound freight in is included in inventory cost.
The cost of promotion, advertising, and sales commissions are not product costs. They do not enter the cost of goods available for sale calculation.
Getting this boundary right matters for accurate gross profit figures and for correctly reporting net income.
Using Technology to Track It
Modern inventory management software automates most of this work. Tools integrate point-of-sale data with inventory tracking, so ending inventory updates in real time after every sale.
Digital tools also help prevent the manual errors that distort inventory account balances. When freight in is recorded as an operating expense by mistake, or when a supplier invoice is entered twice, the cost of goods available for sale number becomes unreliable. Good accounting practices and automated reconciliation catch these problems early.
For businesses using a periodic inventory system, the calculation happens at the end of each period using recorded purchases and physical counts. For those using perpetual systems, inventory account balances update with every transaction.
Either way, the underlying formula stays the same. Beginning inventory plus additions equals cost of goods available for sale.
Operational Efficiency and Cost Control
Tracking the cost of goods available for sale over time reveals a lot about operational efficiency. If it is rising faster than sales, margins are shrinking. If production costs are climbing, either raw materials prices have gone up or manufacturing overhead is poorly controlled.
A fixed overhead volume variance, for example, shows whether the factory is producing at the expected rate. Underproduction means fixed costs are spread over fewer units, raising per-unit cost. This shows up in higher cost of goods sold relative to revenue.
Reviewing the components of the inventory cost regularly helps businesses decide where to cut, renegotiate, or invest. It turns a single number into a diagnostic tool for the whole operation.
Frequently Asked Questions
What is the difference between cost of goods available for sale and cost of goods sold?
Cost of goods available for sale is the total cost of all inventory that could have been sold. Cost of goods sold is the portion that was actually sold. The difference is ending inventory, which stays on the balance sheet as an asset.
How does beginning inventory affect the cost of goods sold calculation?
Beginning inventory is the starting point. A higher beginning inventory means more goods were available, and if purchases stay the same, cost of goods sold will likely be higher. Errors in beginning inventory carry forward and distort the current period’s financials.
Do freight in costs always go into the cost of goods available for sale?
Yes. Freight in and freight inward are direct costs of acquiring inventory. They are part of the cost to get goods to a sellable condition and location. Outbound shipping to customers is a selling expense and does not belong in inventory cost.
Which inventory valuation method gives the most accurate gross profit?
There is no single answer. FIFO tends to better reflect current costs in ending inventory. The weighted average smooths fluctuations. Specific identification is most precise but only practical for high-value, distinct items. The right method depends on the nature of your inventory and your accounting goals.
What happens to obsolete inventory in the cost of goods available for sale?
Obsolete inventory must be written down to its net realizable value. Inventory write-downs reduce the ending inventory figure, which increases cost of goods sold and reduces gross profit. A reserve for obsolete inventory spreads this impact more predictably across periods.
Conclusion
Getting the cost of goods available for sale right is not just an accounting exercise. It is foundational to understanding profitability, managing inventory, and making sound business decisions. Whether you run a manufacturing company, a retail shop, or a food and beverages operation, this calculation ties your operational activity to your financial results.
If your team is spending too much time chasing inventory discrepancies, struggling with production costs, or unsure whether your gross margin percentage is where it should be, that is a signal to get expert help.
The team at Oak Business Consultant offers CFO services designed for growing businesses. From cleaning up financial statements to building systems that track cost of goods sold in real time, we help business owners get clarity on their numbers and make smarter decisions. Reach out to explore how our CFO services can bring structure and insight to your financials.