17 Goals, One Report Card: The United States and the SDGs
The US and the SDGs: A Goal-by-Goal Scorecard
The United States ranks 45th out of 169 countries on the UN’s Sustainable Development Report. Its overall score is 75.3, behind Costa Rica, Slovenia, and Estonia. It also ranks dead last among UN member states on a separate index measuring commitment to UN-based multilateralism. And the US is one of only three countries, alongside Haiti and Myanmar, that has never submitted a Voluntary National Review of its own SDG progress.
None of that means the US is failing across the board. Life expectancy, corruption control, and digital infrastructure all outperform the global median. But 2025 marked a genuine turning point for one goal in particular. The dismantling of USAID cut US foreign assistance by nearly 60% in a single year, the sharpest drop of any major donor in modern history. This article walks through where the US stands on all 17 goals. It then covers the domestic regulatory shift, led by states rather than Washington, that’s now asking large US companies to report their own climate impact.
How the US approaches the SDGs
Unlike most UN member states, the US government has never produced a formal national SDG strategy. It has never submitted a Voluntary National Review to the UN either. SDG-related policy in the US is fragmented by design. Individual federal agencies pursue goals that overlap with the SDGs, covering health, education, and environmental protection, without coordinating around the SDG framework itself. States and cities have increasingly filled that gap with their own sustainability and climate commitments.
That decentralization shapes everything else on this scorecard. A country like the UAE can point to a single federal committee and a single national CSR mandate. US progress on the SDGs is really 50 different stories layered under one federal number. California’s climate disclosure laws, covered in detail below, are the clearest example of a state stepping into a policy space the federal government has stepped back from.
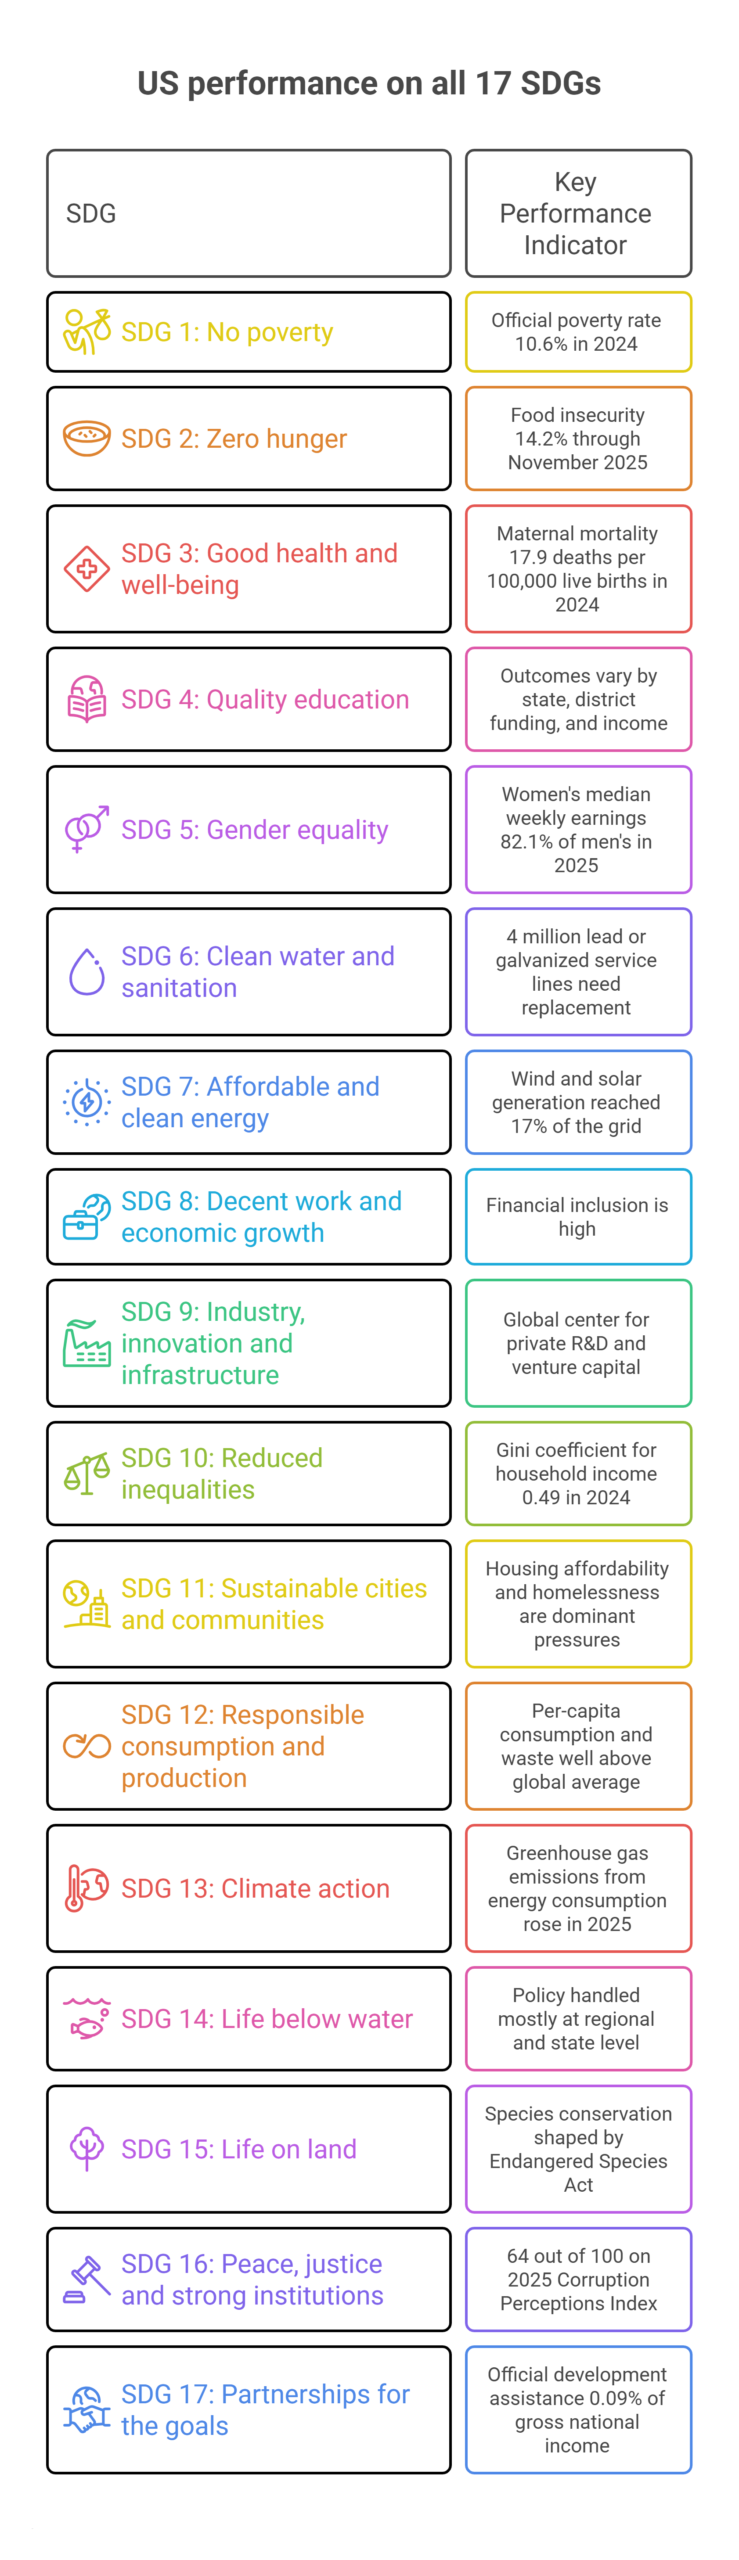
US performance on all 17 SDGs
SDG 1: No poverty
The official US poverty rate fell to 10.6% in 2024, or about 35.9 million people, according to the Census Bureau’s Poverty in the United States: 2024 report. The Supplemental Poverty Measure, which accounts for taxes, benefits, and regional housing costs, sat higher at 12.9%. The two measures rarely match in a given year, since they factor in different government programs. Where the US has historically outperformed on this goal is as a donor rather than through domestic policy. It has been the world’s largest absolute source of foreign development aid for decades. That distinction is now in question. Oak’s SDG 1 breakdown covers the global poverty data behind this goal in more depth.
SDG 2: Zero hunger
Household food insecurity sat at 13.7% in 2024, or roughly 47.9 million people, per the USDA’s Household Food Security in the United States report. That agency called this its final report on the topic, after announcing the annual survey would be discontinued. Food insecurity has climbed further since then, reaching 14.2% through November 2025 according to independent tracking out of Purdue University. Cuts to the Supplemental Nutrition Assistance Program and renewed food price inflation are the main drivers. Single-mother households experienced food insecurity at more than double the national rate.
SDG 3: Good health and well-being
This is one of the stronger goals for the US on paper. Life expectancy sits around 76 to 78 years. Health coverage reaches over 91% of the population, though the remaining share, about 28 million people (8.3%), still represents one of the highest uninsured rates among wealthy nations, per the CDC’s 2025 health insurance coverage release. Maternal mortality has come down from its pandemic-era peak, falling to 17.9 deaths per 100,000 live births in 2024, according to the CDC’s National Center for Health Statistics. Even so, the US still trails other high-income countries on this measure by a wide margin. The gap by race remains stark: Black women die from maternal causes at more than three times the rate of white and Hispanic women.
SDG 4: Quality education
Education outcomes in the US are strong relative to global benchmarks but middling among peer economies. Lower secondary completion and literacy rates are both high, and the country remains a global center for higher education. What drags this goal down in international comparisons isn’t access. It’s equity. Outcomes vary sharply by state, district funding formula, and household income, in a way that flatters national averages tend to obscure.
SDG 5: Gender equality
Women now hold 28.2% of seats in Congress, including 26 of 100 Senate seats, according to Rutgers’ Center for American Women and Politics. At the current pace of change, it would still take decades to reach parity. The gender pay gap remains wide: women’s median weekly earnings were 82.1% of men’s in 2025, per the Bureau of Labor Statistics. That ratio varies sharply by race; Black women earned 85% of what White women earned in the same period, and both trail men by a wide margin overall. The US ranks in the low-to-mid 40s out of 148 economies on the World Economic Forum’s 2025 Global Gender Gap Report, trailing Canada.
SDG 6: Clean water and sanitation
Basic drinking water access is close to universal in the US. The aging infrastructure behind that access is the real constraint. An estimated 4 million lead or galvanized service lines still need to be replaced nationwide, according to the EPA. A 2024 federal rule now requires utilities to replace all lead service lines within 10 years. That effort is backed by $15 billion in infrastructure funding, which runs through its final year in 2026. Independent estimates still put full replacement costs well above what’s currently funded. Oak’s SDG 6 breakdown covers the global scale of the water crisis behind this pressure.
SDG 7: Affordable and clean energy
Electricity access is universal. Wind and solar generation together have grown from under 1% to a record 17% of the grid over the past two decades, according to the Energy Information Administration, and now edge out coal and nuclear as electricity sources. That progress is now running against policy headwinds. Legislation signed in mid-2025 rolled back several federal tax incentives that had been driving clean energy deployment. Independent climate trackers now rate US federal climate policy as “highly insufficient” against the Paris Agreement’s targets, a downgrade from the prior administration’s trajectory.
SDG 8: Decent work and economic growth
Financial inclusion is high. The large majority of US adults hold a bank account, and GDP growth has remained resilient by developed-economy standards. This goal is harder to score cleanly on labor market quality. Gender and racial pay gaps, discussed under SDG 5 and SDG 10, sit inside this goal too. The US also publishes less consistent data on labor informality and equal-pay enforcement than several of its OECD peers.
SDG 9: Industry, innovation and infrastructure
Internet and mobile broadband access are both near-universal. The US remains a global center for private R&D investment, venture capital, and advanced manufacturing. This is consistently one of the country’s stronger goals in the SDG Index. It reflects decades of private-sector infrastructure investment rather than a specific federal SDG-aligned program.
SDG 10: Reduced inequalities
The Gini coefficient for US household income sat at roughly 0.49 in 2024, up from 0.43 in 1990, per Census Bureau data. That’s among the highest of any wealthy nation. The inequality is uneven geographically too. New York and the District of Columbia post Gini scores near 0.52, while Utah sits closer to 0.42. Layered on top of income inequality are the racial pay and wealth gaps already visible in the SDG 5 data. The SDG Index treats those as a core input to this goal rather than a separate issue.
SDG 11: Sustainable cities and communities
Public transit investment varies enormously by metro area, and this goal reflects that unevenness more than most. Housing affordability and homelessness have become the dominant policy pressure in this space over the past two years. Several major metro areas are reporting record rents alongside rising unsheltered homelessness counts. That combination shapes lived experience in most large US cities, even though most global SDG scorecards don’t capture it well.
SDG 12: Responsible consumption and production
Per-capita consumption and waste generation in the US remain well above the global average. That’s a pattern common to almost every high-income economy, and one the SDG Index penalizes accordingly. Corporate sustainability reporting, once voluntary and inconsistent, is starting to become mandatory for the largest US companies, a shift covered in detail below.
SDG 13: Climate action
US greenhouse gas emissions from energy consumption actually rose in 2025, reversing several years of decline, according to the Energy Information Administration. Higher electricity demand and a larger share of coal in the power mix both drove the increase. The bigger structural shift happened at the federal level: the Trump administration began withdrawing the US from the Paris Agreement in January 2025, and the exit formally took effect in January 2026, annulling the prior administration’s 2030 and 2050 emissions targets. The Climate Action Tracker now projects 2030 emissions will land well short of what earlier US commitments implied. Oak’s SDG 13 breakdown covers the global warming trend behind this pressure.
SDG 14: Life below water
Ocean and coastal policy in the US is handled mostly at the regional and state level. There’s no single federal SDG-aligned program, which makes this one of the harder goals to score with one national figure. Marine protected area coverage and fisheries management vary by region. Some of the strongest fisheries data comes from federally managed Pacific and Alaskan waters.
SDG 15: Life on land
Species conservation in the US is shaped heavily by the Endangered Species Act, and by ongoing debate over how aggressively to enforce it. Land-use pressure from urban sprawl, agriculture, and wildfire risk all weigh on this goal. Wildfire severity in western states has become an increasingly visible indicator of the broader climate pressure covered under SDG 13.
SDG 16: Peace, justice and strong institutions
The US scored 64 out of 100 on Transparency International’s 2025 Corruption Perceptions Index. That’s its lowest score on record, a 12-point decline over the past decade, and good for 29th out of 182 countries. Less than a decade ago the score sat in the mid-70s. The US now ranks behind Uruguay, Bhutan, and the UAE. Institutional stability remains a relative strength, but independent monitors point to a weakening of judicial independence and press freedom protections as the main drivers of the recent decline.
SDG 17: Partnerships for the goals
This is where the US picture changed most dramatically in 2025. USAID, once the largest development agency in the world, was effectively dismantled, with roughly 83-85% of its programs terminated. Combined with cuts from other major donors, this drove a 23% drop in total OECD foreign aid, the steepest annual decline the OECD has ever recorded. The US alone accounted for a nearly 57% year-over-year fall in its own aid spending, per the OECD’s own country profile. US official development assistance now sits at an estimated 0.09% of gross national income, far below the long-standing 0.7% international target. The country’s absence from the Voluntary National Review process points to the same pattern. So does its last-place ranking on the UN’s multilateralism index. Both reflect reduced US engagement with the international coordination that SDG 17 was built around.
The private sector mandate: state climate disclosure laws
With no federal climate disclosure rule in force, the compliance pressure on large US companies is now coming from California. Senate Bill 253 covers any company with more than $1 billion in annual revenue that does business in California, per the California Air Resources Board, which administers the law. Those companies must publicly disclose Scope 1 and Scope 2 greenhouse gas emissions starting in 2026, regardless of where they’re headquartered. Scope 3 supply-chain emissions follow in 2027. A companion law, SB 261, requires climate-related financial risk disclosures from companies with revenue above $500 million. Enforcement of that second law is currently paused pending a federal court ruling.
The SEC’s own federal climate disclosure rule, finalized in 2024, never took effect. The agency stopped defending it in court in early 2025 and has since proposed rescinding it entirely. Since then, states including New York, New Jersey, Colorado, and Illinois have introduced their own versions of mandatory emissions reporting. Each is following California’s lead rather than waiting for federal action.
Non-compliance under SB 253 carries real financial exposure. Administrative penalties can reach $500,000 per reporting year for large companies that fail to file or that materially misstate their emissions. The law applies to any company doing business in California above the revenue threshold, so its practical reach extends well beyond companies headquartered there.
How US businesses can position for this
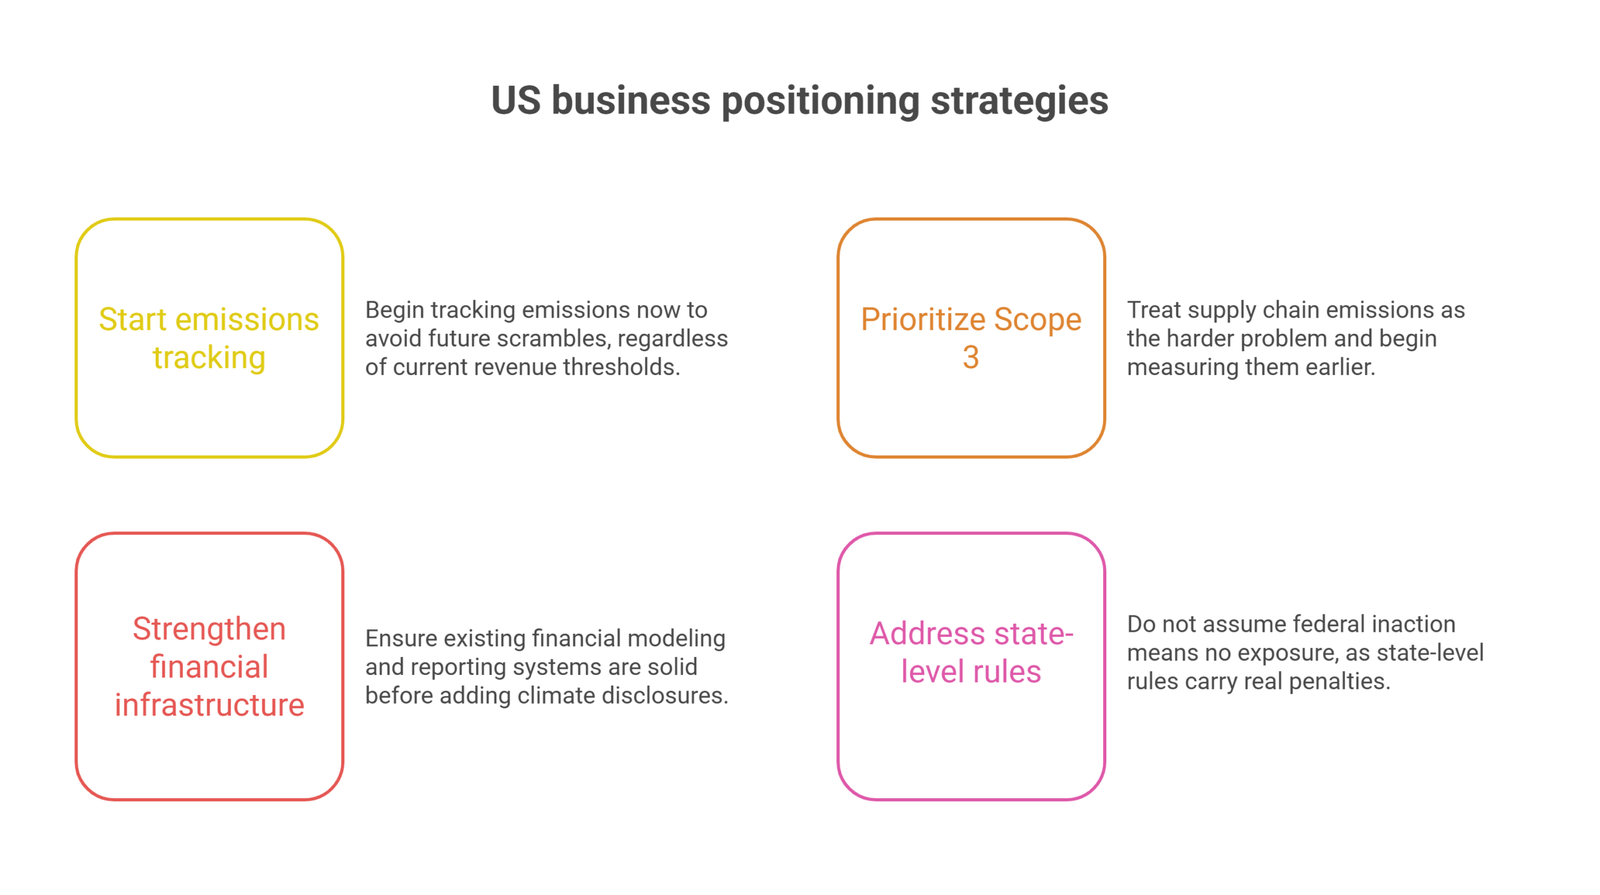
Start emissions tracking now, even if you’re under the threshold. SB 253 applies at $1 billion in California-linked revenue today. Reporting thresholds under similar frameworks elsewhere, including the EU’s CSRD, have moved over time. Companies that build emissions tracking into their financial reporting cadence now avoid a scramble later.
Treat Scope 3 as the harder problem, and start earlier. Scope 1 and 2 emissions, largely from a company’s own operations and purchased energy, are relatively straightforward to measure. Scope 3, covering the full supply chain, is where most companies underestimate the lift. Reporting deadlines give a one-year buffer between the two for exactly this reason.
Get the underlying financial infrastructure right first. Emissions and climate-risk reporting sit on top of a company’s existing financial model and reporting systems. If that foundation isn’t already solid, from financial modeling to tax advisory, layering climate disclosure on top of it gets much harder than it needs to be.
Don’t assume federal inaction means no exposure. With the SEC rule shelved, it’s tempting to treat climate disclosure as optional. State-level rules, led by California and now spreading to other states, are filling that gap with real penalties attached. Multinational companies already reporting under CSRD or other frameworks abroad will find most of the same data is reusable here.
US SDG snapshot: 17 goals at a glance
| SDG | Where the US stands |
| 1. No poverty | 10.6% official poverty rate (35.9 million people); world’s largest historical aid donor, now in sharp decline |
| 2. Zero hunger | 13.7% food insecurity in 2024, climbing toward 14.2% through late 2025 |
| 3. Good health | Life expectancy ~76-78 years; 8.3% uninsured; maternal mortality 17.9 per 100,000, highest among wealthy nations |
| 4. Quality education | Strong access and literacy; outcomes vary sharply by state and district funding |
| 5. Gender equality | Women hold 28% of Congress; gender pay gap held at 82.1% of men’s earnings in 2025 |
| 6. Clean water | Near-universal access; roughly 4 million lead service lines still need replacement |
| 7. Clean energy | Wind and solar at 17% of the grid; federal clean-energy tax incentives rolled back in 2025 |
| 8. Decent work | High financial inclusion; resilient GDP growth; uneven labor data on pay equity |
| 9. Industry & innovation | Near-universal internet and broadband; strong private R&D and venture investment |
| 10. Reduced inequalities | Gini coefficient ~0.49, among the highest of any wealthy nation |
| 11. Sustainable cities | Transit access varies by metro; housing affordability now a dominant pressure |
| 12. Responsible consumption | Per-capita consumption well above global average; corporate reporting shifting from voluntary to mandatory |
| 13. Climate action | Emissions rose in 2025; US withdrawal from the Paris Agreement took effect in January 2026 |
| 14. Life below water | Managed mainly at state and regional level; no single national program |
| 15. Life on land | Wildfire risk and land-use pressure rising in western states |
| 16. Strong institutions | CPI score of 64/100, lowest on record, ranked 29th of 182 |
| 17. Partnerships | USAID dismantled; US foreign aid fell nearly 57% in 2025; last on the UN’s multilateralism index |
Frequently Asked Questions
Which SDGs does the US perform best on?
Digital infrastructure and innovation (SDG 9) are consistent US strengths, alongside near-universal access to electricity and broadband. Corruption control (SDG 16) has historically been a relative strength too. Even so, the 2025 score marked the lowest in the index’s history for the US.
Which SDGs has the US fallen back on most?
SDG 17, partnerships for the goals, saw the sharpest reversal. The dismantling of USAID and a nearly 57% one-year drop in foreign aid spending drove that decline. SDG 13, climate action, also moved backward: energy-sector emissions rose in 2025, and the US Paris Agreement withdrawal, initiated in January 2025, took formal effect in January 2026.
What is SB 253, and does it apply outside California?
SB 253 is a California law requiring companies with more than $1 billion in annual revenue that do business in California to disclose Scope 1 and 2 greenhouse gas emissions starting in 2026, and Scope 3 emissions in 2027. That applies regardless of headquarters location. The revenue threshold is tied to doing business in California rather than being based there, so it reaches most large US companies with any California customer base.
Is there a federal equivalent to SB 253?
No. The SEC finalized a federal climate disclosure rule in 2024, stopped defending it in court in 2025, and has since proposed rescinding it entirely. It never took effect. Several other states have since introduced similar bills. State-level rules are the primary compliance driver for large US companies for now.
Conclusion
The US doesn’t fit a single headline any better than most large economies do. It leads on digital infrastructure and still ranks among the world’s most innovative economies. At the same time, it carries one of the highest income inequality scores and uninsured rates in the developed world. What changed in 2025 was the direction of travel on two goals in particular. SDG 17 saw the sharpest single-year reversal in US aid history, and SDG 13 lost its anchor policy as the country’s Paris Agreement exit, begun in January 2025, moved toward taking effect in early 2026. The compliance pressure on business didn’t disappear, though. It just moved from Washington to Sacramento. For companies that need their financial reporting and tax structure solid before building climate or ESG disclosure on top of it, Oak’s USA tax advisory and CFO advisory services can help get that foundation in place.