SDG 13: Climate Action, and the Decade Every Warming Record Broke
Ten years in, the climate is warming faster than policy can respond
2025 was the third-warmest year ever recorded. So was 2024, ranked first. So was 2023, ranked second.
That three-year run marks the first time global temperatures have averaged above 1.5°C. The Paris Agreement’s central limit did not survive the decade intact.
Global greenhouse gas emissions hit a record 57.7 billion tonnes in 2024. That is a 2.6% jump from the year before, not a decline.
Disaster mortality fell sharply since 2015. The number of people affected by disasters more than doubled over the same period.
This guide covers what SDG 13 actually asks of the world. It shows where 2026 progress stands, country by country. It also covers what businesses can do about it.
What is SDG 13
SDG 13 calls for urgent action to “combat climate change and its impacts.” It is the thirteenth of 17 Sustainable Development Goals.
All 193 UN member states adopted it in 2015, alongside the Paris Agreement.
The goal has five targets. Three cover resilience, policy integration, and education. Two cover financing for developing countries.
It spans disaster risk reduction, national climate policy, emissions tracking, education, and finance. Progress on one front does not guarantee progress on another.
A country can cut disaster deaths and still let emissions climb. It can sign the Paris Agreement and still miss its own targets. SDG 13 tracks each piece on its own.
The official targets and indicators behind SDG 13
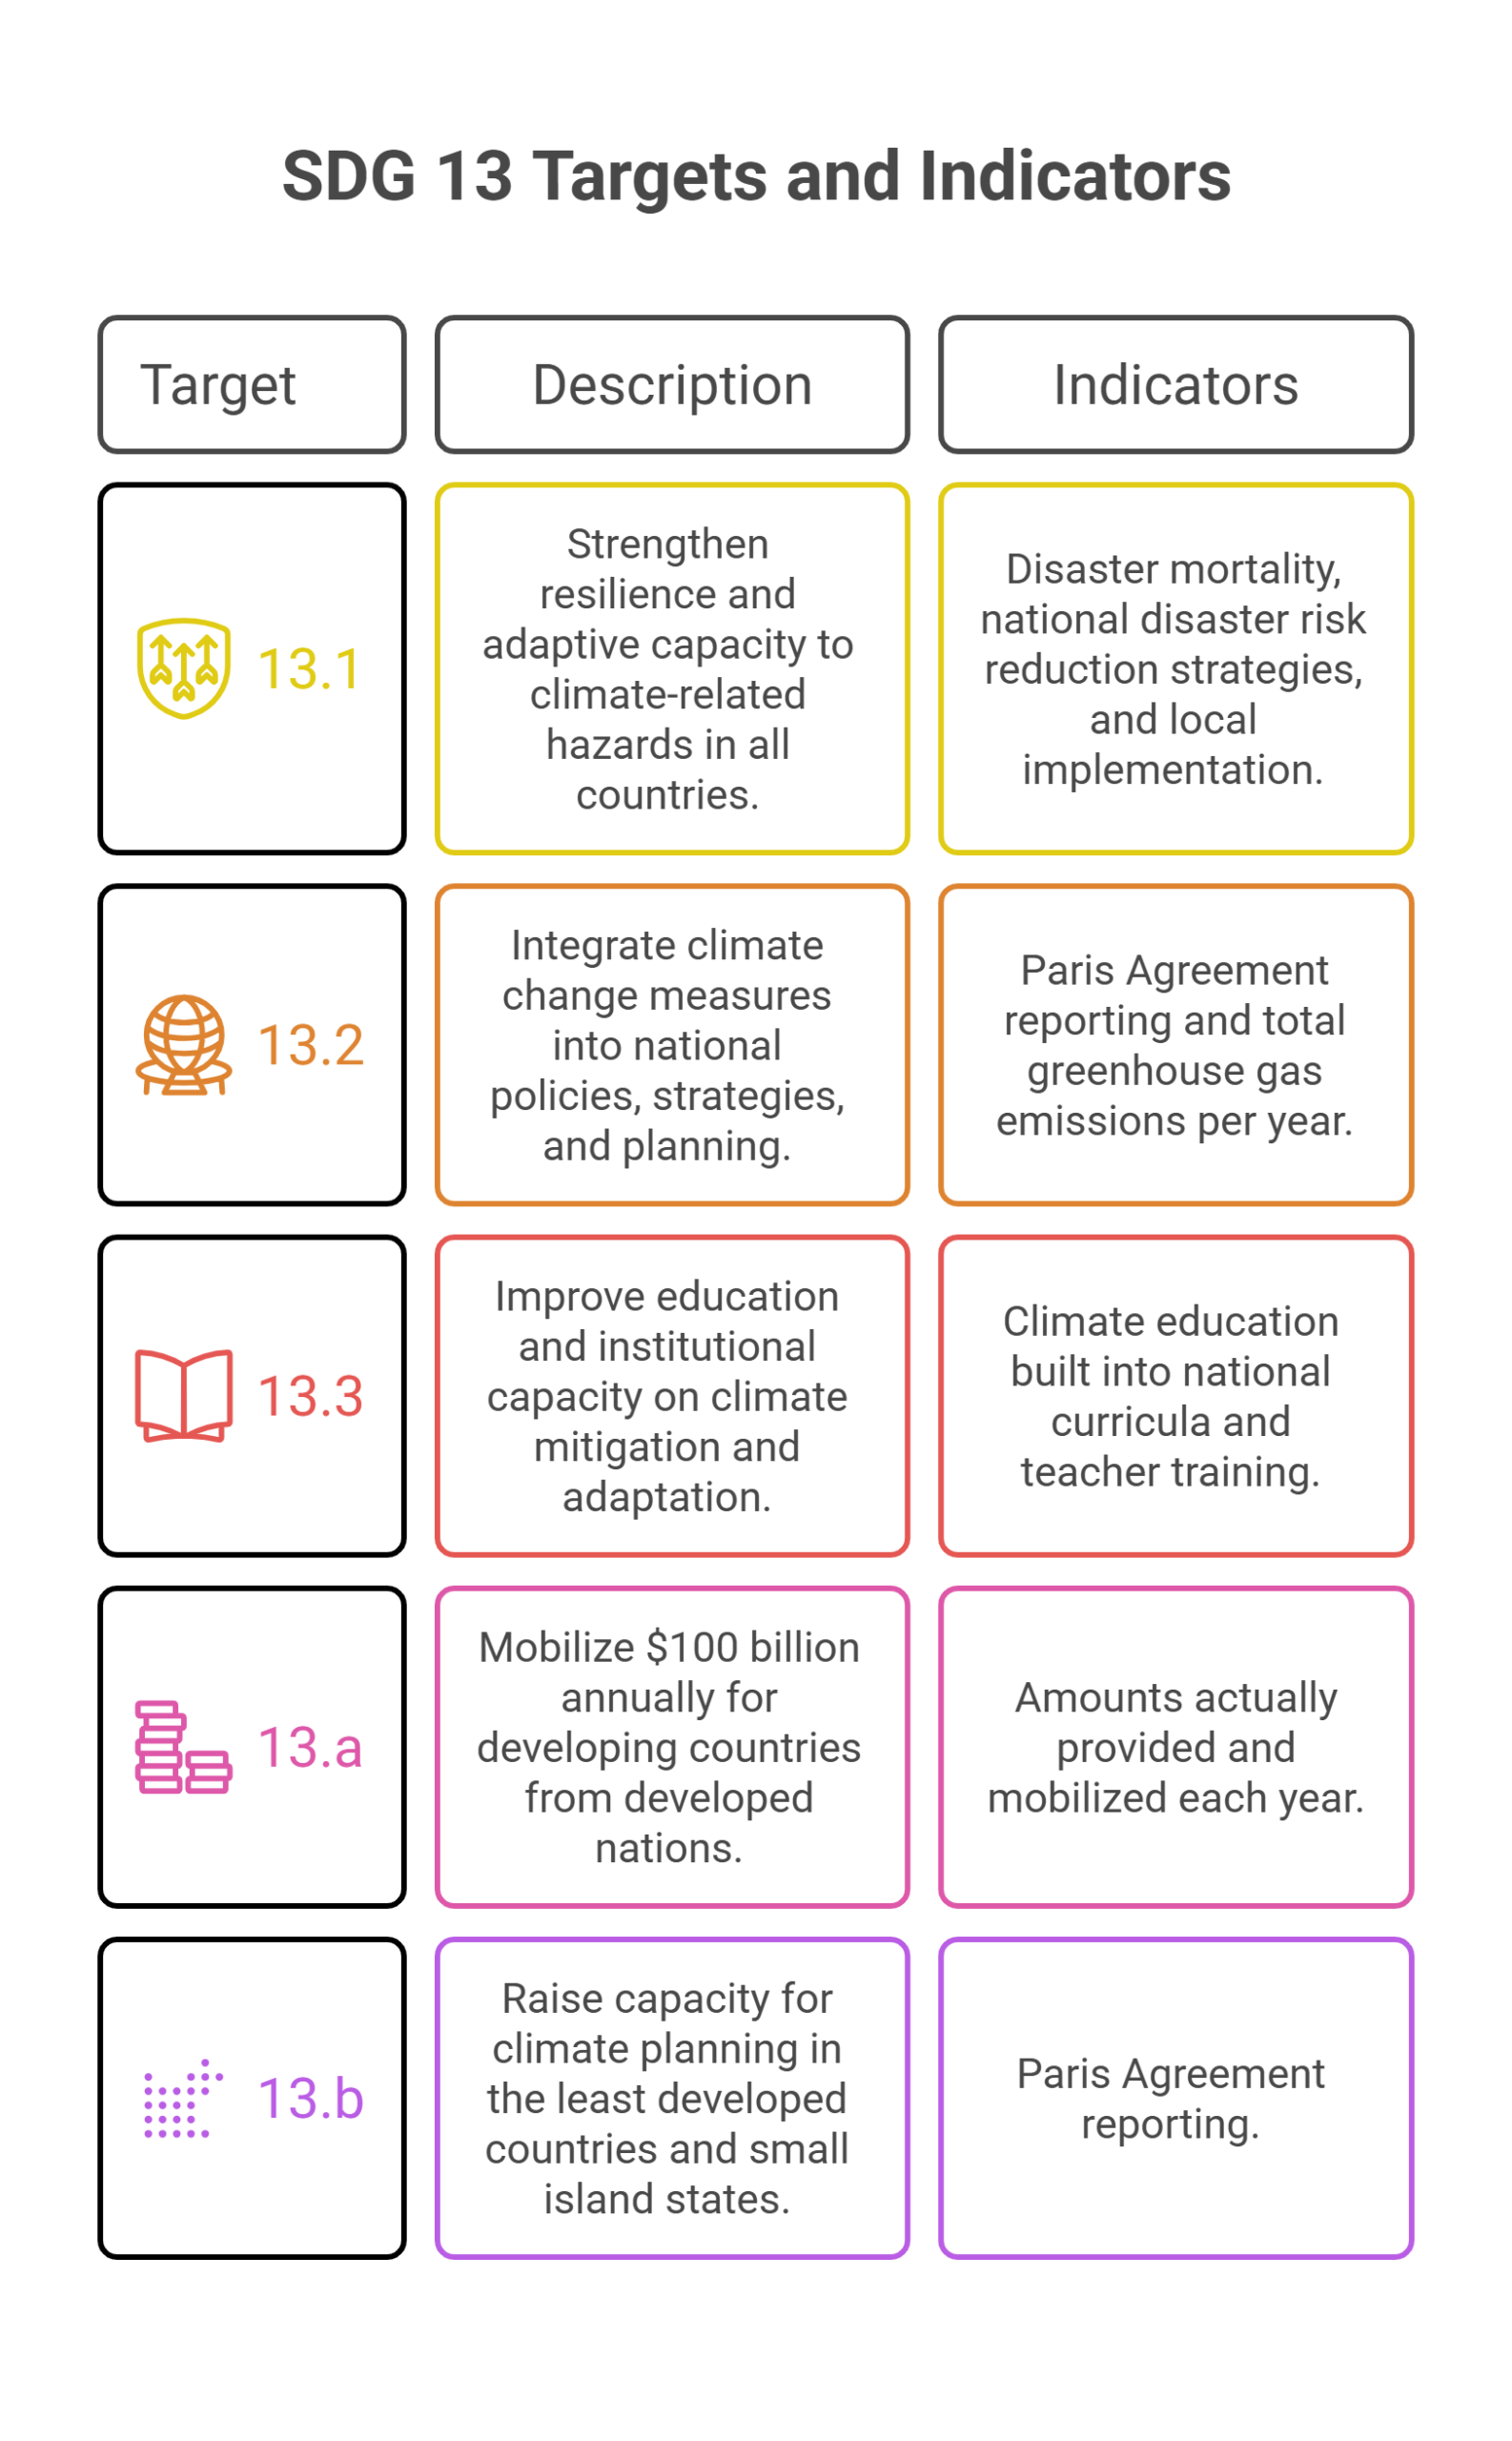
SDG 13 breaks down into five targets. Those targets share indicators with SDG 1, 4, 11, and 12, per the UN’s SDG 13 page.
Target 13.1: Strengthen resilience and adaptive capacity to climate-related hazards in all countries. Tracked through disaster mortality, national disaster risk reduction strategies, and local implementation of those strategies.
Target 13.2: Integrate climate change measures into national policies, strategies, and planning. Tracked through Paris Agreement reporting and total greenhouse gas emissions per year.
Target 13.3: Improve education and institutional capacity on climate mitigation and adaptation. Tracked through how far climate education is built into national curricula and teacher training.
Target 13.a: Mobilize $100 billion annually for developing countries from developed nations. Tracked through the amounts actually provided and mobilized each year.
Target 13.b: Raise capacity for climate planning in the least developed countries and small island states. Tracked through the same Paris Agreement reporting used under Target 13.2.
Where global progress actually stands
The data comes from the 2026 Extended Report on SDG 13 and the UNEP Emissions Gap Report 2025.
Global temperatures keep climbing. The World Meteorological Organization confirmed 2025 sat 1.44°C above pre-industrial levels. The last 11 years are the 11 warmest on record.
Emissions are not falling. They reached 57.7 billion tonnes of CO2-equivalent in 2024, a record high. Fossil fuel and land-use emissions both rose that year.
Disaster mortality has improved. The global rate fell 65% between 2005-2014 and 2015-2024. That is roughly 41,000 deaths a year now, down from 88,000.
Disaster exposure has not improved. The share of people affected by disasters more than doubled over the same window. That is 123 million people a year on average.
National disaster planning expanded fast. 141 countries now have national disaster risk reduction strategies. Only 56 countries had them in 2015, under the Sendai Framework.
Climate finance grew, but stayed short. Global flows averaged $1.3 trillion a year in 2021-2022, driven mainly by clean energy and transport investment. Developing countries alone need an estimated $2.4 trillion a year by 2030.
Paris Agreement reporting lagged. Only 60 parties, covering 63% of global emissions, had submitted updated national climate plans as of late 2025.
The table below summarizes where the core SDG 13 indicators stood in the latest reporting.
| Indicator | Latest figure |
| Global average temperature above pre-industrial levels | 1.44°C (2025) |
| Global greenhouse gas emissions | 57.7 billion tonnes CO2e (2024, record high) |
| Average annual disaster mortality rate | 0.75 per 100,000 (2015-2024), down 65% |
| Average annual people affected by disasters | 123 million (2015-2024), more than double the prior decade |
| Countries with national disaster risk reduction strategies | 141 of 196 countries (2025) |
| Global climate finance flows | $1.3 trillion a year (2021-2022 average) |
| Parties with updated Paris Agreement climate plans | 60, covering 63% of emissions (2025) |
Source: WMO, UNEP, UNDRR, and UNFCCC, via the 2026 Extended Report on SDG 13.
Countries ranked: from most resilient to most vulnerable
Climate vulnerability does not track wealth in a straight line, but it comes close. The clearest cross-country measure is the ND-GAIN Country Index, run by the University of Notre Dame.
It scores 185 countries on climate vulnerability and readiness to adapt. Wealthy, high-latitude nations consistently sit near the top. Low-income, conflict-affected nations sit at the bottom.
Within Africa specifically, Mauritius, Tunisia, and Morocco post the continent’s lowest vulnerability scores. That gap shows resilience is achievable even without high income.
At the bottom of the index, five countries stand out. Chad, the Central African Republic, Eritrea, and the Democratic Republic of the Congo lead that list. Guinea-Bissau rounds out the five most vulnerable nations worldwide.
A separate measure worth noting: the ten most climate-vulnerable countries together produce just 0.28% of global CO2 emissions. They hold 5.16% of the world’s population, according to a cross-source vulnerability analysis.
| Country | ND-GAIN standing | Notes |
| United States | 19th of 185 | Low vulnerability, high readiness to adapt |
| UAE | 31st of 185 | 143rd most vulnerable, but 29th most ready to adapt |
| Mauritius, Tunisia, Morocco | Best-performing in Africa | No single global rank published for the group |
| Chad, Central African Republic, Eritrea, DRC, Guinea-Bissau | Bottom five of 185 | Chad ranks last overall |
United States

The United States ranks 19th on the ND-GAIN Country Index. That places it firmly among the world’s low-vulnerability, high-readiness nations.
Strong infrastructure and deep capital markets explain most of that score. The country can absorb and recover from climate shocks faster than most.
That does not mean the cost is small. In 2024, the US logged 27 separate billion-dollar weather and climate disasters. Total damage reached $182.7 billion, the fourth-costliest year on record.
Since 1980, the country has sustained 403 such disasters. Their combined cost now exceeds $2.9 trillion, according to NOAA.
Gaps still exist within the national average. Coastal and low-income communities face disproportionate flood and heat risk that the ND-GAIN score does not fully capture.
UAE
The UAE ranks 31st on the same index, according to its own national climate fact sheet. It is the 143rd most vulnerable country and the 29th most ready to adapt.
That combination puts the UAE in a strong position overall. Real adaptation challenges remain, mainly around water.
Projections show rising drought pressure through 2050 and beyond. That could strain irrigation and water-dependent sectors over time.
The UAE has also positioned itself as a climate finance hub. It hosted COP28 in Dubai in 2023 and launched Alterra, a $30 billion climate investment fund.
Alterra aims to mobilize $250 billion for global climate projects by 2030. Much of that funding targets the Global South, where adaptation needs are highest.
Costa Rica

Costa Rica shows what sustained climate policy can achieve without abandoning growth.
The country closed 2025 with 98.6% of its electricity from renewable sources, according to its national electricity institute. Hydropower, geothermal, wind, biomass, and solar all contributed.
Costa Rica is also the only tropical country to fully reverse deforestation. Forest cover fell to roughly a quarter of the country by the 1980s. It now covers close to 60%.
A 1996 forestry law banned clearing of established forest. It paired that ban with direct payments to landowners for conservation.
Costa Rica’s case backs a clear point. Renewable investment and forest policy can move together when both are funded consistently.
Chad

Chad sits at the opposite end of the ND-GAIN index, ranked as the world’s most climate-vulnerable country.
Lake Chad has shrunk by roughly 90% since the 1960s. About 30 million people across four countries depend on it for farming, herding, and fishing.
Weak infrastructure and low readiness scores compound the country’s physical exposure. Chad has little fiscal space to fund large-scale adaptation on its own.
Chad’s case shows what the emissions-vulnerability gap looks like on the ground. Countries with the smallest carbon footprints often carry the heaviest climate burden.
The responsibility paradox: who emits, and who pays for it
Climate change is not distributed evenly, in cause or in consequence. The ten most vulnerable countries produce a tiny fraction of global emissions.
Wealthy, high-emitting nations can better absorb climate shocks. They have stronger infrastructure, deeper capital markets, and faster disaster response systems.
Low-emitting nations often lack all three. They face the worst impacts with the fewest resources to adapt.
This is why Target 13.a exists. It is meant to shift some of that financial burden toward the countries least responsible for creating it.
The $100 billion goal has technically been met in recent years. Actual adaptation needs in developing countries are estimated at multiple trillions of dollars annually.
What organizations and institutions are doing
Several UN bodies coordinate SDG 13 monitoring and climate policy. There is no single global fund.
UN Framework Convention on Climate Change
The UNFCCC is the treaty body behind the Paris Agreement. It tracks national climate plans and coordinates the annual COP negotiations.
UN Office for Disaster Risk Reduction
UNDRR tracks disaster mortality and national resilience strategies. It also runs the Making Cities Resilient 2030 initiative for local governments.
UN Environment Programme
UNEP publishes the annual Emissions Gap Report. It tracks the gap between national pledges and what the Paris Agreement actually requires.
World Meteorological Organization
The WMO tracks global temperature data across eight independent datasets. Its annual State of the Global Climate report anchors most climate negotiations.
How businesses can contribute to SDG 13
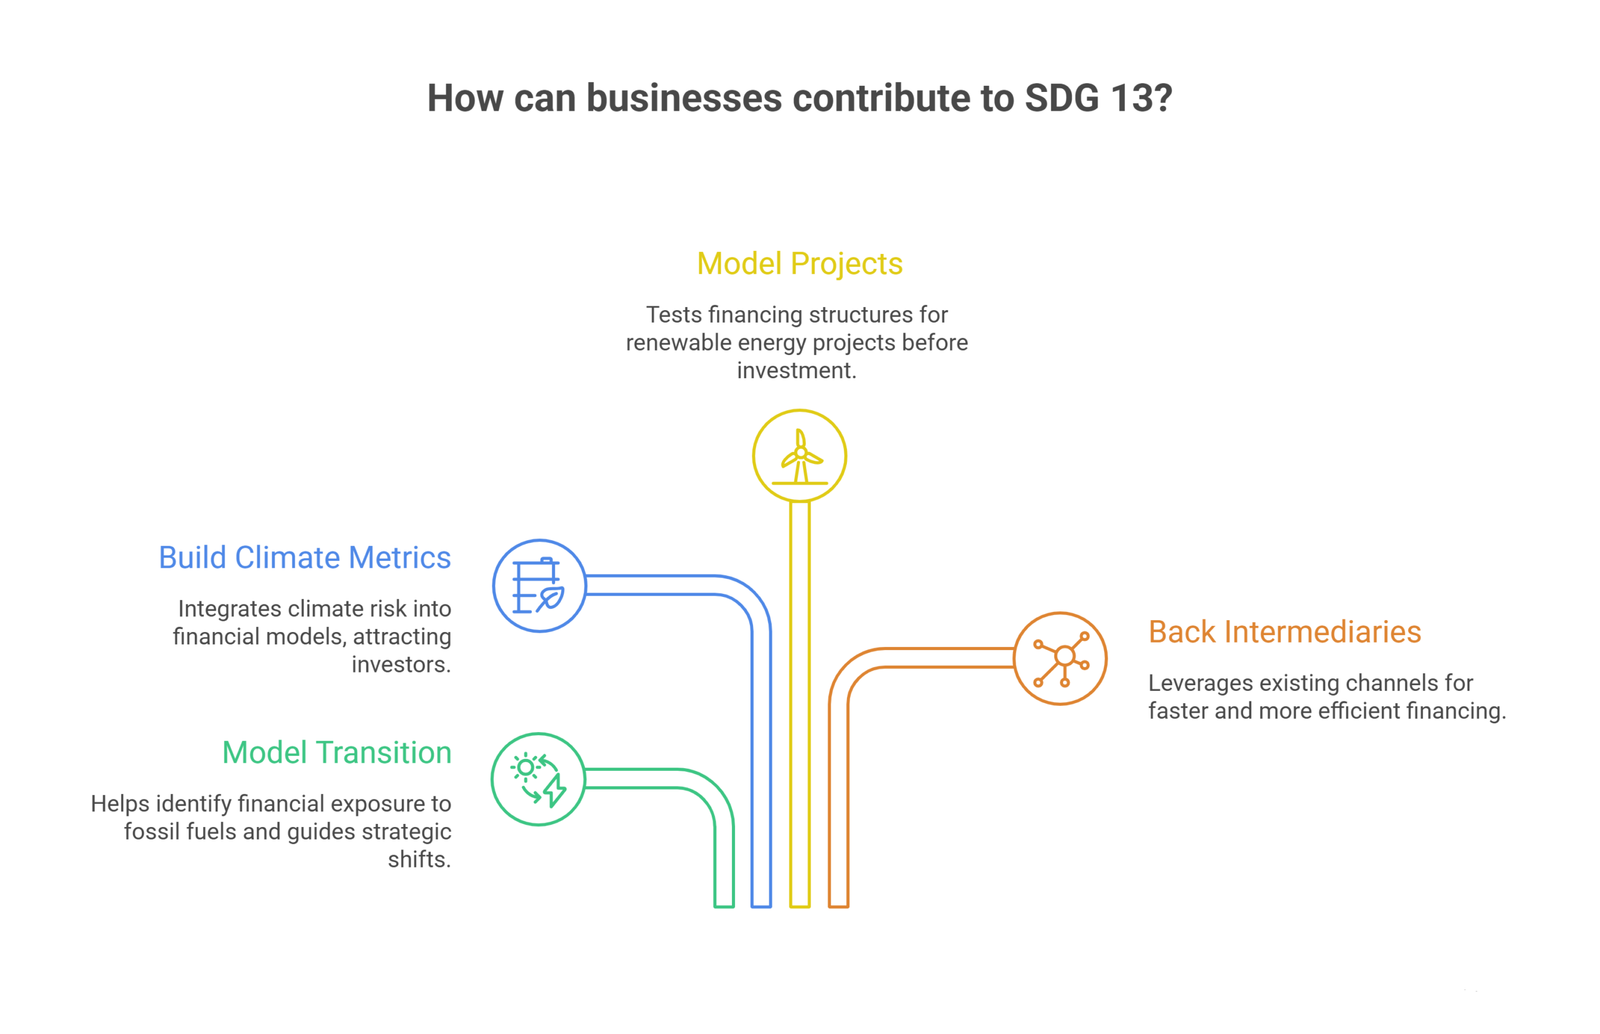
The same approach applies here as with any SDG a company has no formal mandate on. Start with where operations touch emissions. Then look outward from there.
Model the transition, not just the current state
Fossil-fuel-dependent businesses face real financial exposure as policy and markets shift. An oil and gas industry financial analysis that incorporates ESG and emissions metrics helps clarify that exposure early.
Build climate metrics into new venture financials
Investors increasingly expect climate risk built into financial models from day one. Oak’s own ESG startup financial modeling case study shows how that discipline works in practice.
Model renewable and resilience projects with real numbers
Climate mitigation projects carry real capital risk. A renewable energy financial model helps test financing structures honestly before capital moves.
Back financing intermediaries instead of building parallel infrastructure
UNFCCC and UNDRR already coordinate financing and resilience channels for developing countries. Adding capital to an established program usually reaches people faster.
Frequently Asked Questions
How many SDG 13 targets and indicators are there?
Five targets. Three are outcome-focused. Two cover finance and capacity-building for developing countries.
Is the world on track to meet SDG 13 by 2030?
No. Emissions hit a record high in 2024, and only a small share of countries have submitted updated Paris Agreement plans.
Which countries are best prepared for climate change?
Wealthy, high-latitude nations top the ND-GAIN Country Index. Costa Rica stands out for pairing renewable energy with reversed deforestation.
Which countries are most vulnerable to climate change?
Chad, the Central African Republic, Eritrea, the Democratic Republic of the Congo, and Guinea-Bissau rank lowest on the ND-GAIN index.
Why do the most vulnerable countries emit the least?
Wealthier nations built their economies on decades of fossil fuel use. Poorer nations face the resulting climate risk with far fewer resources to adapt.
Can a business without a climate mandate still contribute to SDG 13?
Yes. The clearest levers are modeling transition risk honestly, building climate metrics into new ventures, and backing established adaptation financing.
Conclusion
The number worth sitting with is not the 65% drop in disaster mortality. That gain, after all, is real. The more telling number is that emissions kept rising in the very year that record was set.
Costa Rica shows what sustained renewable and forest policy can do together. Chad shows what happens when vulnerability and low readiness compound at once. The three warmest years on record all happened in the last three years.
None of that gets solved by good intentions. It gets solved by capital that accounts for climate risk before it moves, not after.
Building a financial model for a renewable project, or rethinking transition risk in an existing business? Oak’s financial modeling services can help. Oak builds the numbers behind the transition.