Top Restaurant Financial Metrics
Restaurant Financial Metrics
The US restaurant and foodservice industry is projected to do $1.55 trillion in sales in 2026. That’s according to the National Restaurant Association’s State of the Industry report. It’s an impressive headline number.
But here’s the harder one: only 42% of operators said their restaurant was actually profitable the year before. Revenue is climbing industry-wide. However, that’s mostly because menu prices are climbing, not because more people are walking through the door. In fact, real, inflation-adjusted growth has been tracking closer to just 1% a year.
In other words, a restaurant can be busy and still lose money. So what closes that gap? Tracking the right financial metrics, on the right schedule, and knowing what “good” actually looks like against current benchmarks.
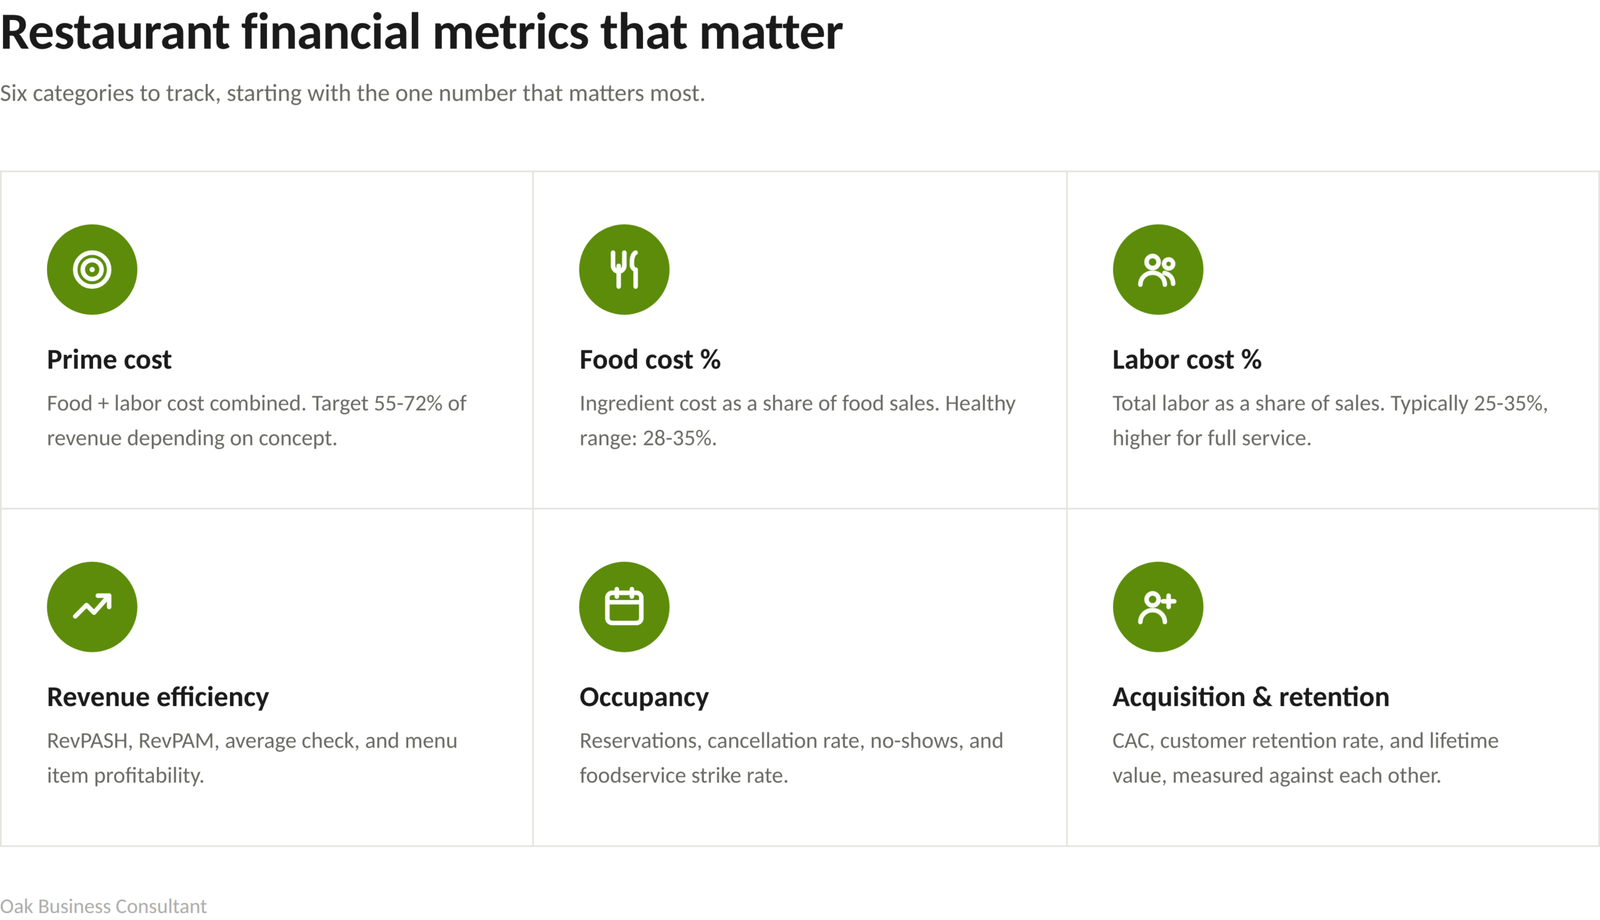
This guide walks through the metrics that matter most for restaurant profitability. For each one, you’ll find what it means, how to calculate it, and what range to aim for. We’ll also cover the occupancy, customer, and service-side metrics that feed into those numbers.
Why this matters
Food costs are running well above pre-pandemic levels. Labor costs have followed a similar path, pushed up by minimum wage increases in several states and a tight labor market. As a result, many operators say they have job openings they simply can’t fill.
Put those two pressures together, and the math gets tight fast. The average full-service restaurant’s pre-tax income sits in the low single digits as a share of sales. Quick-service runs only a little higher.
Oak Business Consultant has built restaurant financial models and business plans for operators navigating exactly this environment. These are restaurants that look healthy on a sales report. Yet they’re quietly bleeding margin through one or two metrics nobody’s watching closely enough.
The metric that matters most: prime cost
If you only track one number, make it prime cost. It’s the combined total of your cost of goods sold (food and beverage cost) and your total labor cost. Together, these are the two largest, most controllable expense categories any restaurant has.
Prime cost = Cost of Goods Sold + Total Labor Cost
Prime cost percentage = (Prime Cost ÷ Total Revenue) × 100
Total labor here means everything: hourly wages, salaried management, payroll taxes, benefits, and workers’ comp. Not just what shows up on the weekly schedule.
What’s a healthy prime cost?
| Concept type | Target prime cost (% of revenue) |
| Quick-service / fast food | 55–60% |
| Fast casual | 55–62% |
| Full service | 60–65% |
| Fine dining | 65–72% |
Fine dining runs a higher prime cost than quick-service. That doesn’t make it less profitable, though. It’s usually offset by higher average checks and lower volume-driven overhead per cover. What matters most is whether your concept sits within its own range, not whether you hit some single industry-wide number.
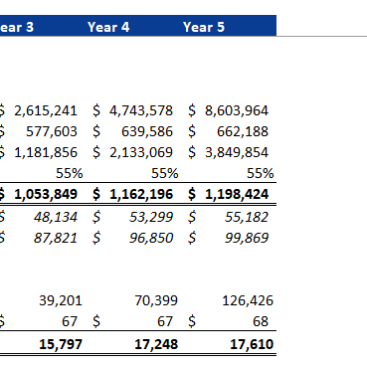
The difference of a few percentage points adds up fast. Picture a restaurant doing $1.5 million in annual revenue at a 72% prime cost. It has $420,000 left to cover rent, utilities, insurance, marketing, and profit. Now picture that same restaurant at a 60% prime cost. It has $600,000 left instead, an extra $180,000 on identical sales, just from tighter cost control.
Most operators still calculate prime cost monthly. But operators who calculate it weekly catch a problem in the first or second week. That’s far better than discovering it 30 days later, once the damage is already locked in.
Food cost percentage
Food cost is one half of prime cost. It’s also the metric most owners check first, simply because it moves the fastest.
Food cost % = (Beginning Inventory + Purchases − Ending Inventory) ÷ Food Sales × 100
Industry averages for full-service restaurants tend to sit around 32%. A healthy range is generally considered 28 to 35%, depending on concept. If you’re consistently above that, it usually points to one of a few specific problems: supplier pricing that’s drifted without renegotiation, inconsistent portioning, waste in prep or storage, or a menu mix that’s quietly shifted toward higher-cost items without a matching price adjustment.
So how do you catch this early? Track food cost weekly instead of monthly, and back it up with a real inventory count. That’s what separates operators who catch a creeping cost problem in time from operators who only find out at month-end, once the damage is already done.
Net cost of goods sold (by menu category)
Does your menu span multiple cuisines or categories? If so, it’s worth breaking food cost down further. Allocate ingredient costs to the specific dish or category they belong to, rather than tracking one blended number.
For example, a restaurant selling both pizza and salads should see the food cost percentage on each separately. That’s usually where you find the dish that’s quietly losing money, even though it sells well.
Labor cost percentage
Labor cost % = (Total Labor Cost ÷ Total Revenue) × 100
Labor cost typically runs 25 to 35% of total sales. Quick-service tends to run lower, thanks to automation and a leaner staffing model. Fine dining runs higher, because service quality is part of the product itself.
If your labor cost percentage looks fine but your prime cost is high, check food cost first. And if food cost looks fine too, the problem is almost always scheduling: staffing for what you expect, rather than what the data says you’ll actually need that shift.
Revenue metrics beyond the top line
Total revenue tells you almost nothing on its own. These metrics show you how efficiently that revenue is actually being generated.
Revenue per available seat hour (RevPASH)
RevPASH measures how much revenue each seat generates per hour it’s available. It accounts for both how full you are and how much each table spends.
RevPASH = Sales for a given hour ÷ Number of available seats during that hour
Say your restaurant makes $1,000 in an hour with 10 seats available. Your RevPASH is $100. It’s most useful as a benchmark against your own restaurant’s history, hour by hour and day by day, rather than against other restaurants. That way, it tells you exactly which time slots are underperforming and worth fixing through pricing, menu changes, or seating layout.
Revenue per available square meter (RevPAM)
This is the same idea, but applied to floor space instead of seats. It’s useful for concepts where seating capacity isn’t the binding constraint, such as buffets, fast-casual counters, or food halls, where total footprint matters more than seat count.
RevPAM = Total sales ÷ Total square meters of usable space
Average check size
Average check = Total revenue for a period ÷ Number of checks in that period
A rising average check is only a good sign if it’s not entirely the product of fewer large-party discounts or seasonal swings. So track it alongside covers served, not in isolation. Otherwise, you risk drawing the wrong conclusion from a number that moved for reasons that have nothing to do with menu performance.
Menu item profitability
Menu item profitability = Contribution margin of the item ÷ Selling price
This is what separates “popular” from “profitable.” It’s actually quite common for a restaurant’s best-selling item to also be its lowest-margin one. That’s an uncomfortable thing to find out, but a useful one, especially before it turns into a structural problem rather than a simple pricing fix.
Break-even point
Break-even point (in covers) = Total Fixed Costs ÷ Contribution Margin per Cover
Say your fixed costs run $100,000 for the period, and your average contribution margin per cover is $100. You’d need 1,000 covers in that period just to cover costs, before a single dollar becomes profit.
Break-even is also a quick filter for decisions like whether to accept a large private event booking at a discounted rate. If the booking clears your break-even contribution per cover, it’s worth taking, even at a lower margin than your normal table service.
Occupancy metrics
Occupancy tells you how full your restaurant is running relative to capacity. It’s also usually the first place a service or satisfaction problem shows up, often before it appears anywhere in the revenue numbers.
Here are the reservation metrics worth tracking:
- Number of reservations. Total bookings over a period, normalized by day, to spot demand trends early.
- Cancellation rate. A rising cancellation rate, especially with short notice, often signals dissatisfaction with a prior visit rather than random scheduling noise.
- No-show rate. This tracks customers who book and don’t appear at all. Persistently high no-show rates usually mean customers see a nearby alternative as equally good, or better, so it’s worth investigating before it shows up as a revenue problem.
- Foodservice strike rate. This is the share of guests who actually order food, rather than just a drink or coffee. A low strike rate, particularly in cafés and bars, often points to a menu or pricing issue rather than a traffic issue.
Customer acquisition and retention
These metrics tend to get less attention than food and labor cost. Even so, they directly determine whether your marketing spend is actually building the business, or just buying one-time transactions.
Customer acquisition cost (CAC)
CAC = Total marketing spend for a period ÷ Number of new customers acquired in that period
CAC is only useful when you track it over time, ideally segmented by channel. That way, you can see which marketing spend is actually converting and which is mostly noise. For operators who want this tracked rigorously alongside the rest of their financials, rather than as a standalone marketing number, Oak’s financial analysis services build it directly into the broader financial picture.
Customer retention rate (CRR)
CRR = Returning customers ÷ Total customers acquired in the period
Customer Retention Rate (CRR) shows how many restaurant customers come back for repeat visits over a given period. It’s typically tracked through POS loyalty data, reservation platforms, or loyalty apps. A healthy range for full-service restaurants is generally 20-40%. It matters because repeat customers spend more and cost less to retain than acquiring new ones, so a low CRR often points to issues with food quality, service, or value.
Customer lifetime value (LTV)
LTV = Total revenue generated by a customer ÷ Length of their relationship with your restaurant (in the relevant period)
LTV against CAC is the real test of whether your marketing is sustainable. A restaurant spending heavily to acquire customers who visit once and never return doesn’t really have a marketing success. It has a CAC problem in disguise.
Front-of-house and service metrics
Customer service metrics matter financially because service quality drives retention, average check, and review scores. All of these feed straight back into revenue.
- Tables served per waiter. A low number, relative to your service style, suggests scheduling inefficiency. A number that’s too high, on the other hand, risks service quality and tip-driven staff retention.
- Menu item availability. This tracks how often a guest orders something that’s out of stock. It’s an inventory management metric as much as a service one, and a persistently high “86’d” rate erodes both satisfaction and average check.
- Front of house (FoH) labor as a share of total labor. This typically ranges from 30% to 60%, depending on service style. Full table service runs higher than counter service.
Quick reference table
| Metric | Formula | Healthy range |
| Prime cost | (COGS + Labor) ÷ Revenue | 55–72% by concept |
| Food cost | (Beginning Inv. + Purchases − Ending Inv.) ÷ Food Sales | 28–35% |
| Labor cost | Labor Cost ÷ Revenue | 25–35% |
| Net profit margin | Net Profit ÷ Revenue | 3–9% by concept |
How often should you actually check these?
Some metrics need daily or weekly attention: covers, average check, food cost spot-checks, and reservation or no-show trends.
Others work best on a weekly cycle: prime cost, food cost percentage (with a real inventory count behind it), and labor cost percentage.
The rest can run monthly: net profit margin, CAC, LTV, and a menu item profitability review.
Why does cadence matter this much? Because a problem caught in week one is just a scheduling adjustment. The same problem caught at month-end is four weeks of cost that’s already gone and can’t be recovered.
Frequently Asked Questions
What’s a good profit margin for a restaurant?
Net profit margins generally range from 3 to 9% of revenue, depending on concept. Quick-service and fast-casual operators typically land toward the higher end. Full-service and fine dining tend to sit lower, offset by higher average checks.
How often should I calculate food cost?
Weekly, with a real inventory count behind the number. Monthly calculations let a cost problem run for several weeks before it’s even visible, and by then the loss is already locked in.
What’s the difference between food cost and prime cost?
Food cost is ingredient cost as a percentage of food sales. Prime cost adds total labor cost on top of that, giving you a combined view of the two biggest controllable expenses in the business.
Why is my restaurant busy but not profitable?
It usually comes down to one of three things. Either prime cost is too high relative to your concept type, your average check or menu mix isn’t covering the true cost of the dishes being sold, or fixed overhead is too large for your current covers volume to clear break-even comfortably. Tracking the metrics above, by category, is how you isolate which one it is.
Should I track these metrics myself or get outside help?
Tracking one or two metrics is manageable on your own. But tracking the full set, consistently, on a weekly cadence, tied back into a working financial model, is more than most owner-operators can sustain alongside actually running the floor. That’s typically the point where bringing in dedicated financial support starts to pay for itself.
Conclusion
The restaurant industry keeps growing in dollar terms, yet it’s getting harder to run profitably. Food and labor costs have outpaced revenue growth for several years running, and that gap shows up first in the metrics, not in the dining room.
Prime cost is the single number that tells you the most, the fastest. But it only works as an early warning system if you’re checking it weekly, with real data behind it, rather than monthly with a rough estimate.
Get the cadence and the benchmarks right, and the rest of these numbers stop being a reporting chore. Instead, they become the thing that tells you, in real time, whether the business underneath the dining room is actually working.
Would you rather have this built and monitored for you, instead of managing it on spreadsheets? Oak Business Consultant works directly with restaurant owners on exactly this problem, from a single location working out a break-even issue to multi-unit groups standardizing prime cost reporting across every location. Oak builds restaurant financial models, investor-ready business plans, and pitch decks for restaurants at every stage. Our CFO services extend that same weekly financial discipline that larger restaurant groups rely on, scaled to fit a single-location operation. Take a look at how we’ve approached this for other operators in our restaurant case study, or book a call with Oak Business Consultant to talk through your restaurant’s specific numbers.