


Snack Bar Excel Financial Model

Original price was: $300.$180Current price is: $180.
Oak Business Consultant’s Snack Bar Excel Financial Model offers a complete 5-year financial projection to support planning and investment decisions. It helps estimate startup costs, operating expenses, sales revenue, and inventory needs enabling you to track growth, manage profitability, and make informed business decisions with confidence.
Frequently Bought Together
- Description
- Reviews (10)
- Testimonial
- Article
Description
Overview: Snack Bar Financial Model
Starting your own Snack Store sounds exciting but it can be very overwhelming.
But with the help of this tool, “Snack Bar Excel Financial Model,” your journey becomes easier. This tool helps entrepreneurs, startups, and investors gain a clear financial roadmap for their snacking business.
Doesn’t matter if you are interested in Traditional Snack Bar, Organic Snack Bar, Dessert Snack Bar or Healthy Snack Bar this model provides detailed projections, cost analysis, and profitability insights to support sustainable growth.
Key Features of the Model
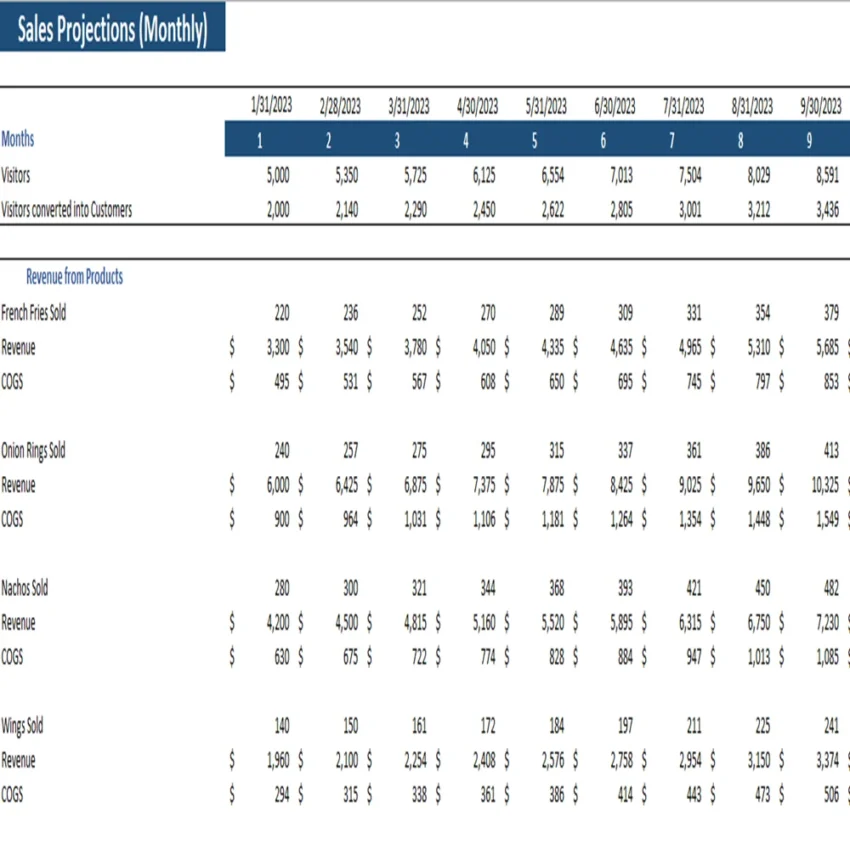
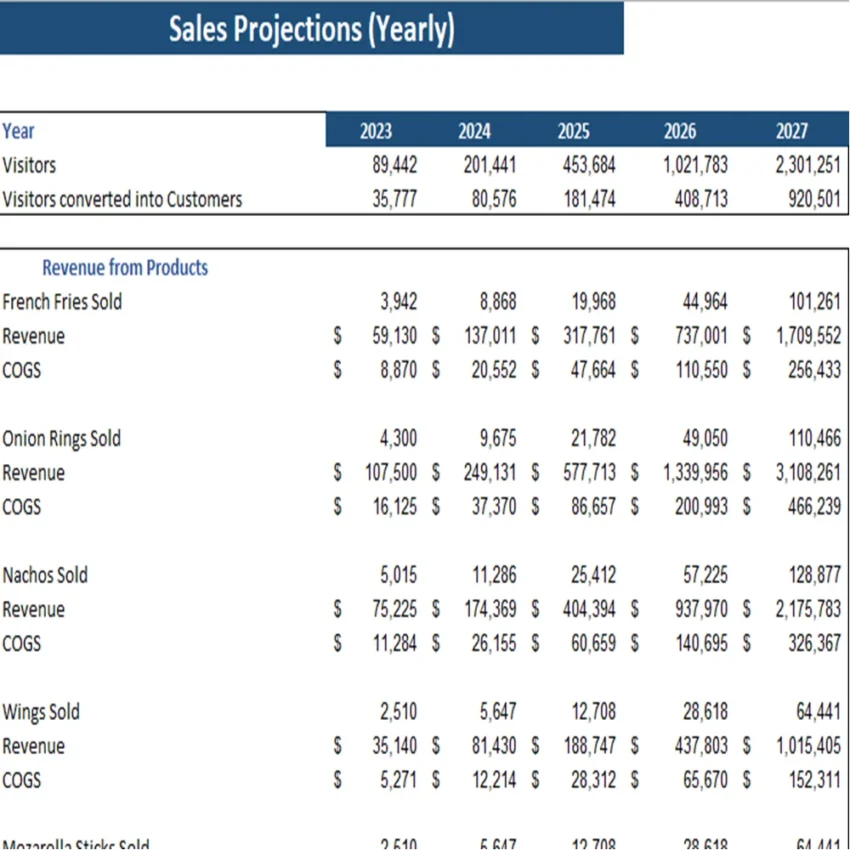
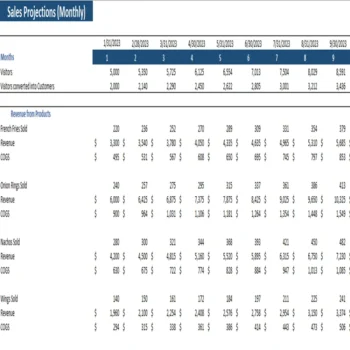
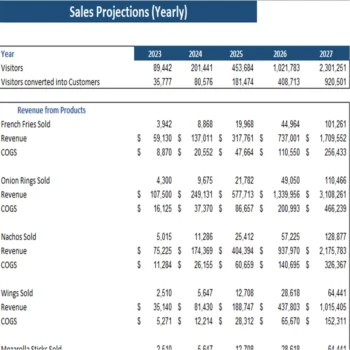
Revenue Projections
- Sales Forecasting: Estimate your future revenue based on customer counts, monthly growth rate, new customers & recurring ones.
- Revenue by Service Type: Estimate your future revenue based on types of snacks getting sold such as healthy, organic, traditional etc.
- Competitive Advantages: Identify what sets your Snack Bar apart in the competitive Food Retail Industry.
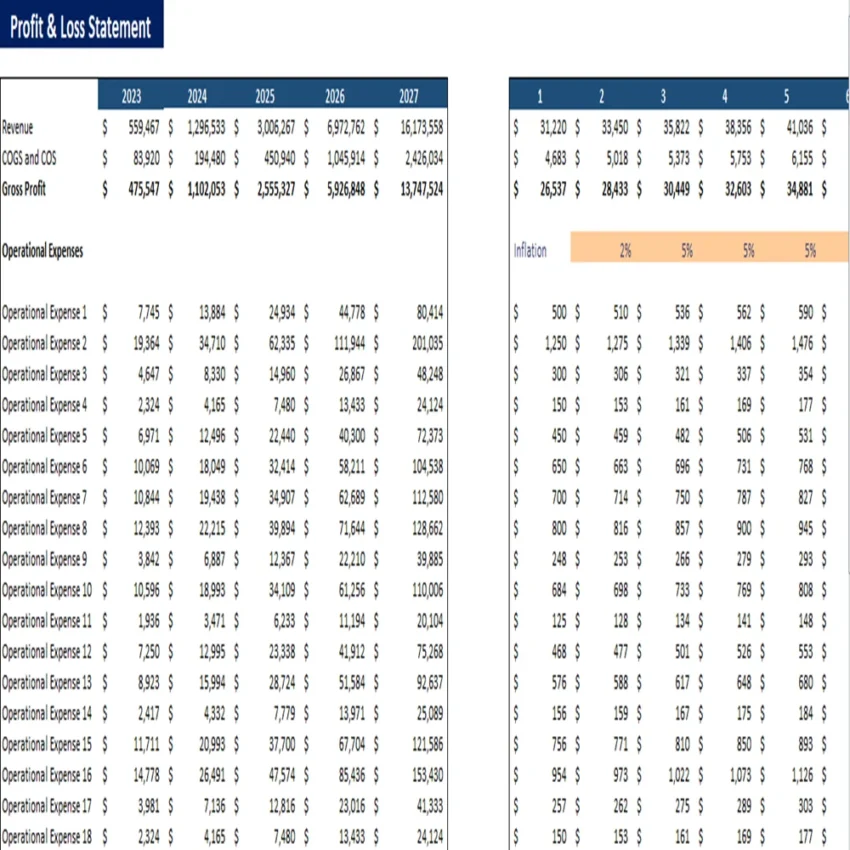
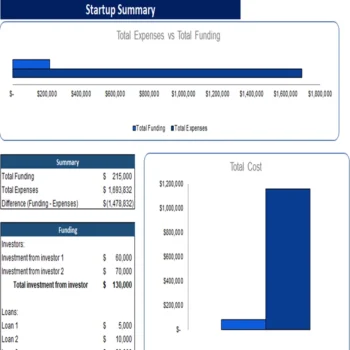
Cost Structure
- Direct Costs: Adjust the direct cost such as Sourcing costs as percentage of your revenue to see where your gross margin lies.
- Administrative Expenses: Account for fixed costs like Rent, Permit, Marketing and Employee Salaries etc.
- Business Expenses: Include financial obligations such as financing expenses and business loans.
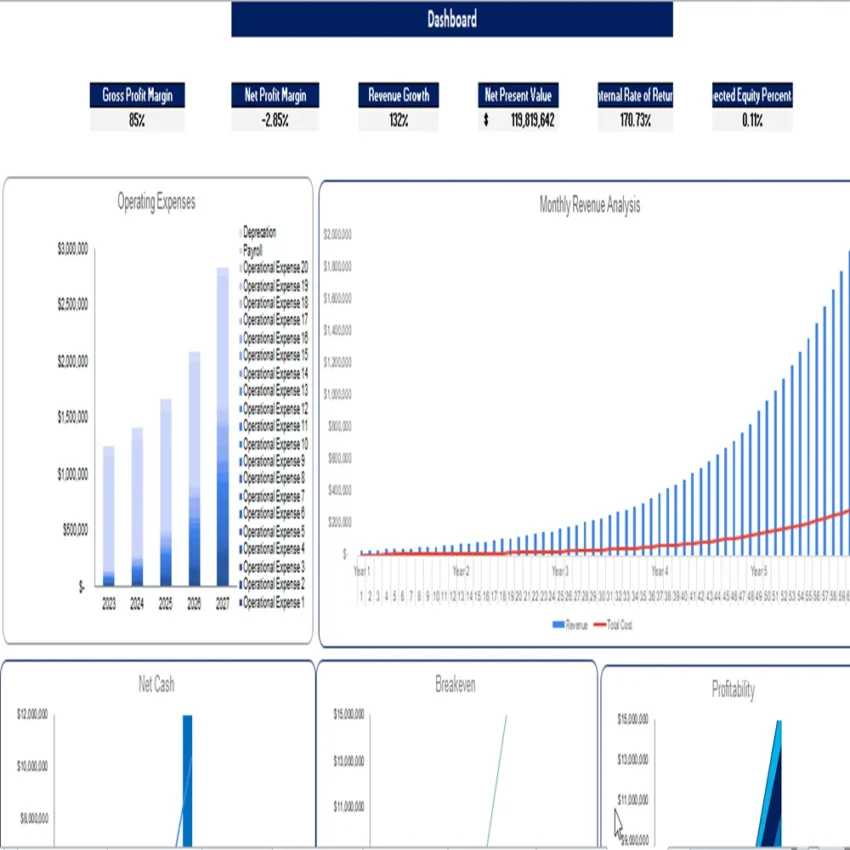
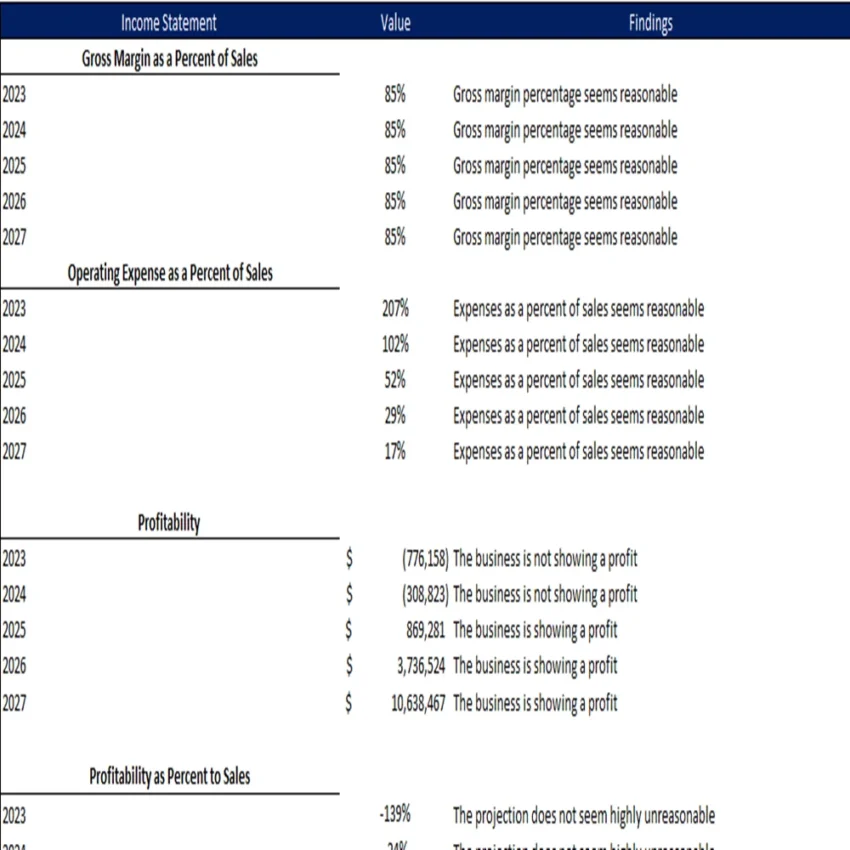
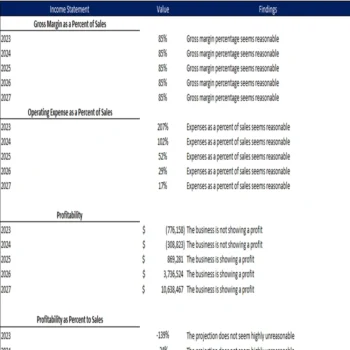
Profitability Analysis
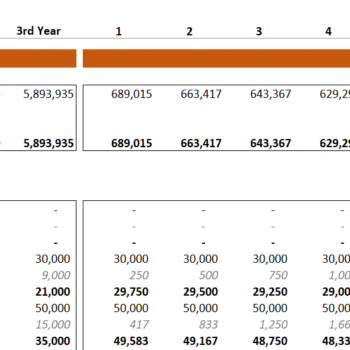
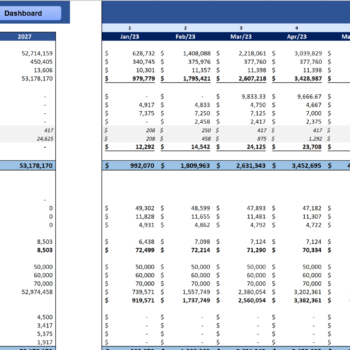
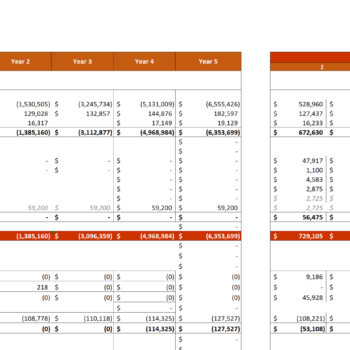
- Profit and Loss Statement: Track income, expenses, and profit over 5 years.
- Gross Margin & Net Profit: Get to know what is the performance of the Snack Bar based on gross and net profit.
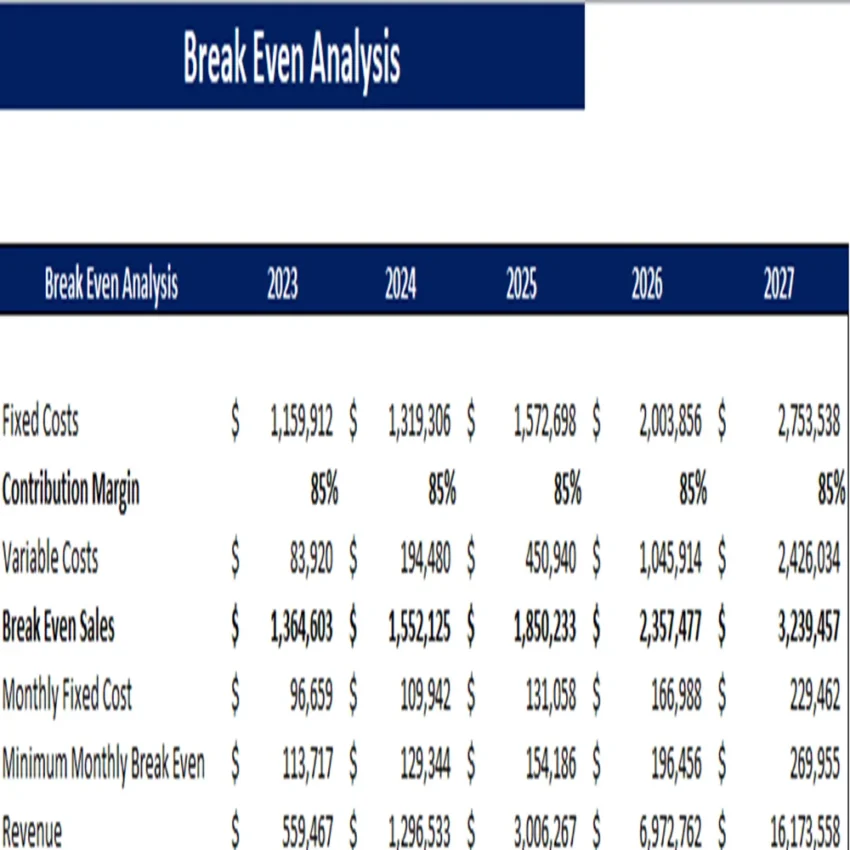
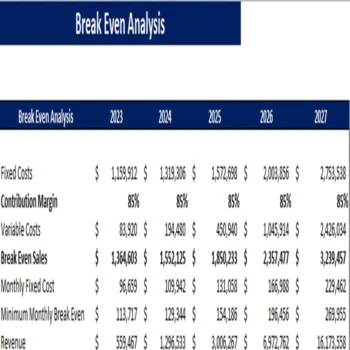
- Break-Even Analysis: Determine the number of sales needed to cover costs and achieve profitability.
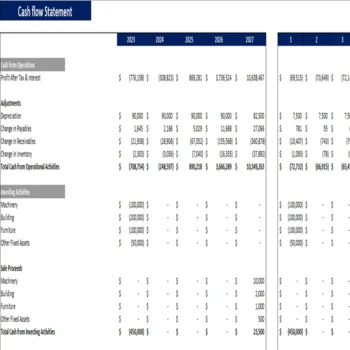
Cash Flow Management
- Cash Flow Statement: Track money flowing in and out of your business.
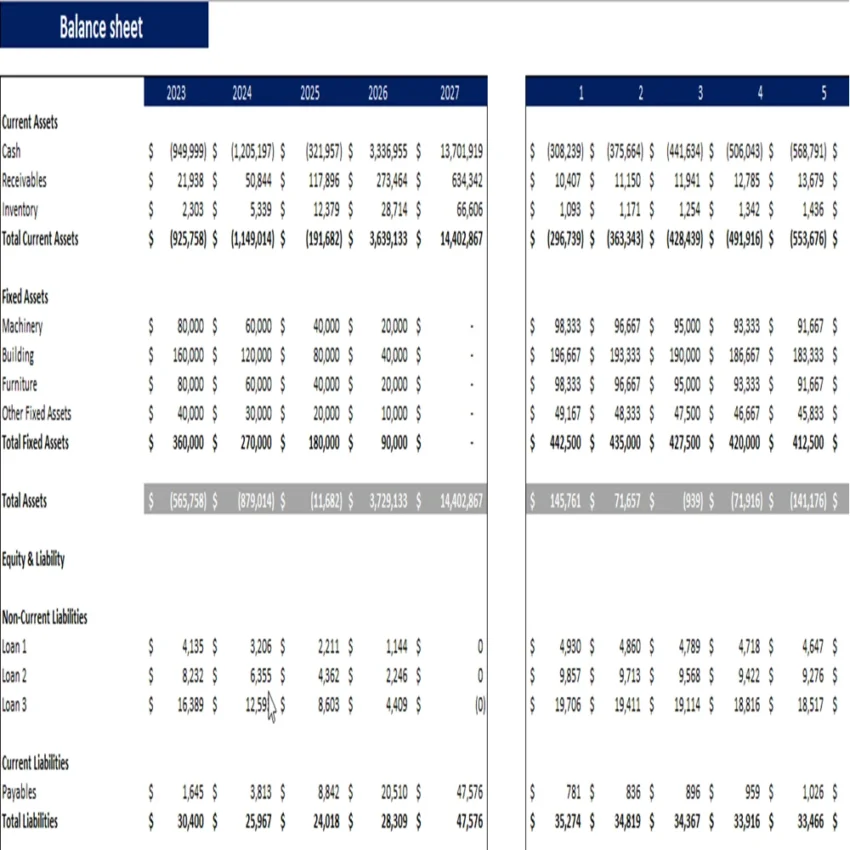
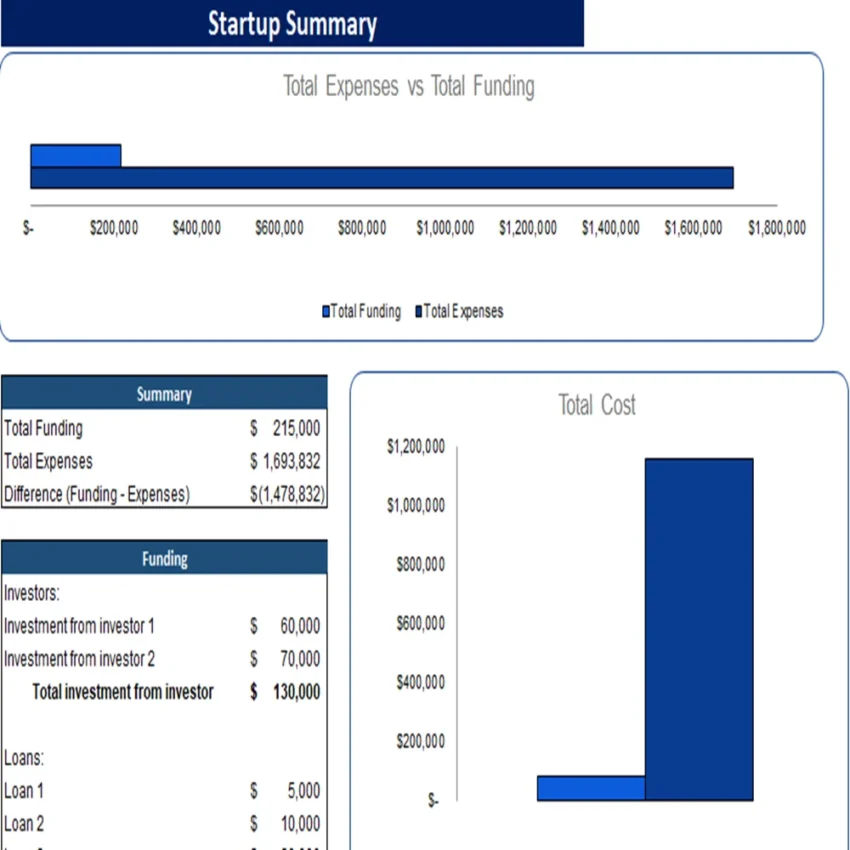
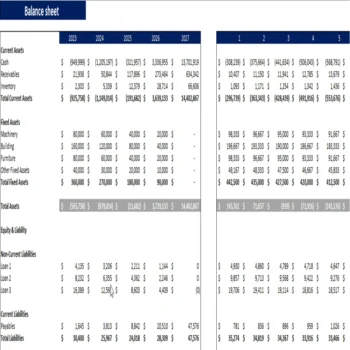
- Financial Position: Ensure adequate working capital for seamless operations.
- Investment Scheduling: Plan accordingly the cashflow to make your investment decisions for a smoother flow of operations.
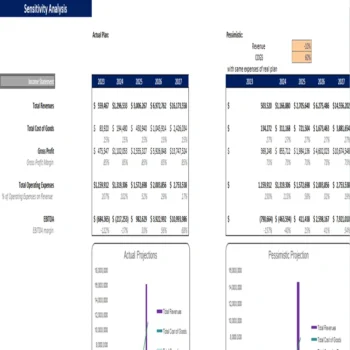
Financial Forecasting & Scenario Analysis
- 5-Year Financial Plan: Develop long term projections for revenue, expenses, and profitability.
- Market Conditions & Food Trends: Adjust financial forecasts based on industry changes and customer behavior.
- Best-Case, Base-Case, and Worst-Case Scenarios: Evaluate different financial outcomes and prepare accordingly.
Key Performance Indicators (KPIs)
- Customer Types & Volume: Track customer trends across different snacks categories.
- Customer Retention & Growth Potential: Measure repeated customer and market expansion opportunities.
- Financial Statements: Access financial modeling spreadsheets for an in-depth financial breakdown.
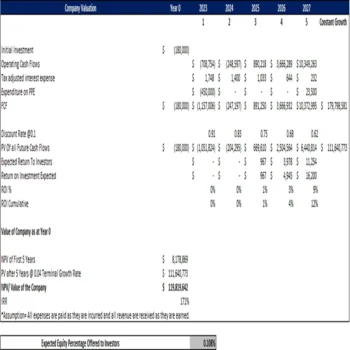
Investor Readiness & Business Strategy
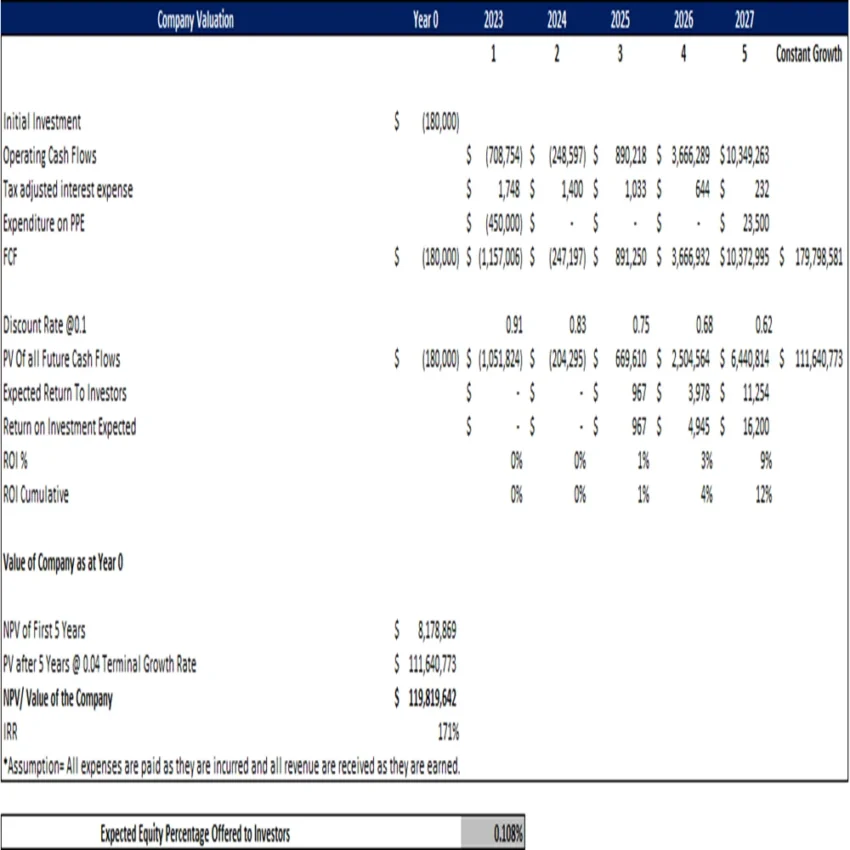
- Attract Potential Investors: Present a professional financial plan to secure funding.
- Strategic Planning: Align business objectives with financial projections for long term success.
- Cost Analysis & Optimization: Better understand which costs can be minimized and which one have to most impact on profitability.
Key Benefits of Using This Model
- Better Financial Planning: Gain a clear understanding of your business’s financial feasibility.
- Optimized Operations: Enhance cost analysis and resource allocation.
- Risk Mitigation: Plan ahead for financial uncertainties and avoid cash shortages.
- Customizable Tool: Adapt the model to fit different Snack Bar business needs.
- Scalability: Suitable for both small startups and established businesses.
Who Should Use This Model?
- Entrepreneurs & Startups: Establish a solid financial base for a Snack Bar model.
- Existing Snack Food Businesses: Improve financial planning to make profitability better.
- Investors & Analysts: Evaluate the financial viability of snack bars.
- Consultants & Advisors: Offer expert financial insights to clients.
Guide to This Model
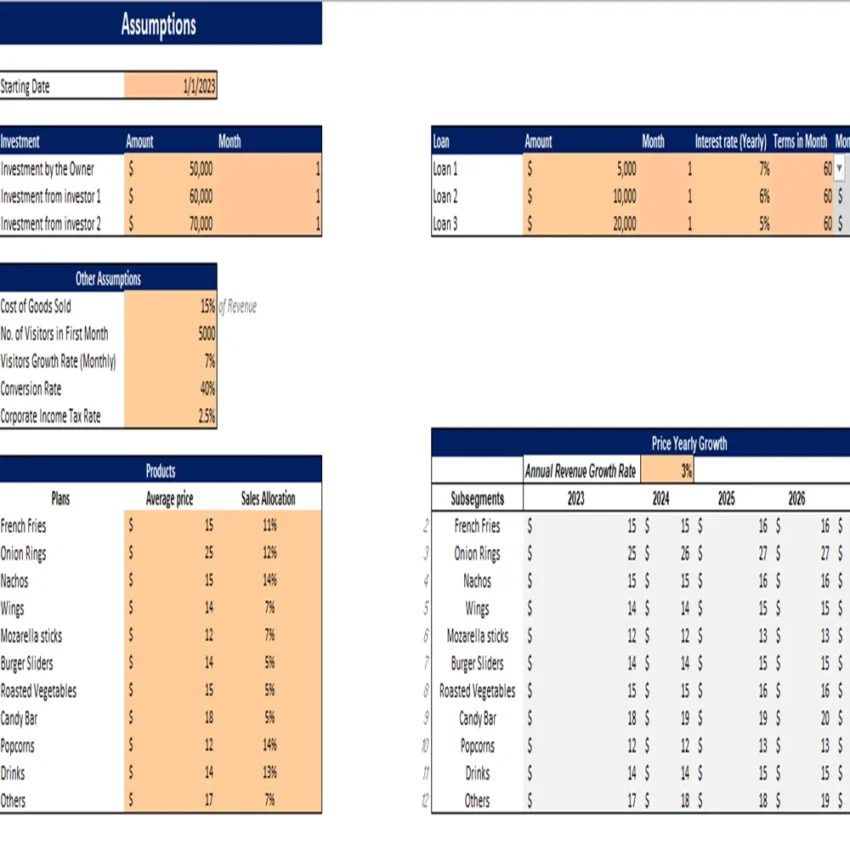
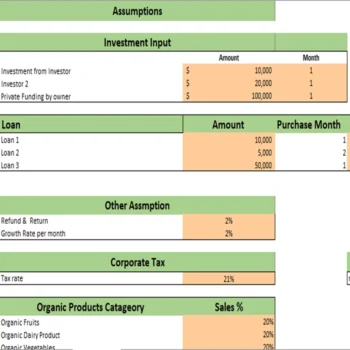
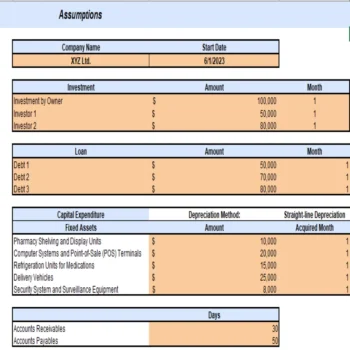
- Enter Assumptions: Input snack item details, product prices, and business operation costs.
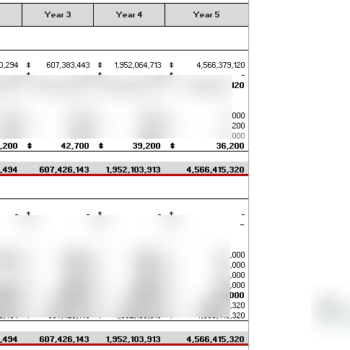
- Analyze Financial Statements: Review the 3 main financial statements to assess the financial performance.
- Adjust Scenarios: Test multiple scenarios based on best and worst case to judge business stability.
- Make Informed Decisions: Use data-driven insights to refine marketing, pricing, and investment strategies.
FAQs
1. Do I need Excel skills to use this calculator?
No, it just need you to add basic data.
2. Can I update customer data and revenue easily?
Yes, the model allows easy updates for snack categories, product prices, and different variables.
3. Can I track my online store costs like supply cost, staff, and supplies?
Yes, the model tracks various expenses, including supply cost, staffing, and operational costs.
4. Does the model help with long-term financial planning for the Snack Bar?
Yes, it includes financial forecasts and scenarios for up to 5 years to support long-term planning.
5. Can I make changes to the formulas in this template?
No, the formulas are locked to prevent accidental changes, ensuring accurate calculations.
Terms of Use
Oak Business Consultant and our Snack Bar Excel Financial Model Template are not affiliated with any specific software or platform unless stated otherwise. Your purchase grants you a SINGLE LICENSE FOR PERSONAL OR BUSINESS USE only. Redistribution, resale, or sharing of this template is strictly prohibited. If you find this model useful, please direct others to our store.
Note
This is a digital Excel file. Due to the nature of digital products, returns or exchanges are not available. Please reach out with any questions before purchasing.
Need More Help?
- For a better understanding of this template, watch our YouTube video.
- To get a Customized Model made, email us at info@oakbusinessconsultant.com
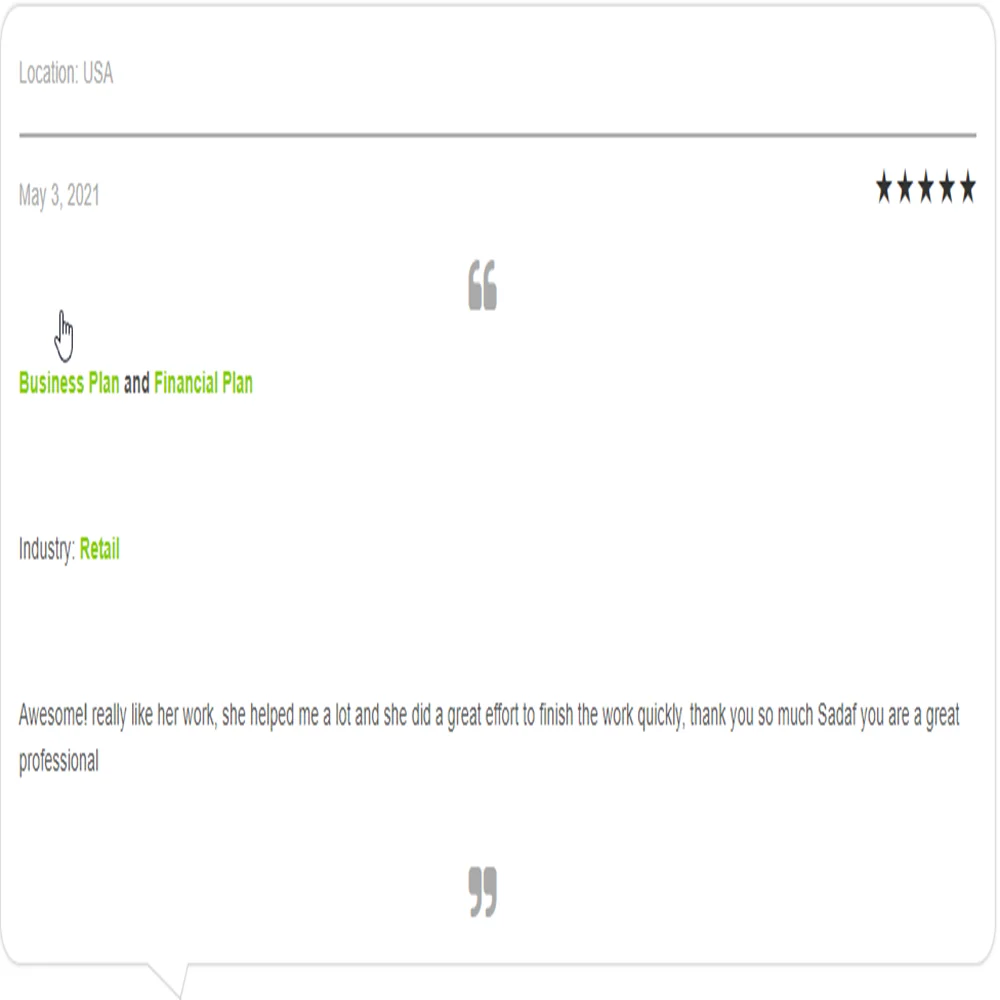
By actively seeking and incorporating customer feedback, we ensure our services are consistently tailored to their specific requirements. One of the testimonials can be seen below
The Oak Business Consultant’s experts prepared a case study on one of our clients who approached us to develop a financial model for their start-up company. This case study shows how our team fulfills the requirements and demands of our client. For more information. Click here


Wayne Sanchez –
Managing multiple locations is tough, but this financial model scales with my business, providing great comparative insights.
Sean Stevens –
Finally, a model that suits the unique needs of my snack business. It’s adaptable and very insightful.
Craig Henderson –
From a financial accuracy standpoint, this model is solid. It helps lay out all necessary financial statements with ease.
Martin Williams –
The projections this model helps generate are impressive. It’s a robust tool for anyone serious about their business finances.
Albert Turner –
I recommend this model to all my clients in the food industry. It’s straightforward and yields professional reports.
Sophia Richardson –
I’ve used various financial models, and this one stands out for its customization options. It’s perfect for adapting to various scenarios.
Harry Powell –
As someone new to the financial aspects of business, this model was a lifesaver. It’s user-friendly and very informative.
Keith Price –
I’ve found the accuracy and depth of this model to be top-notch. It allows for detailed forecasting which is essential in my field.
Bruce Alexander –
This Snack Bar Excel Financial Model has been a game-changer for my business. Its intuitive design and detailed analysis have made financial planning much simpler.
Amanda Richards –
Thanks to this financial model, I was able to make the right business decisions much easier. It is exactly what I was looking for. Moreover, the walkthrough video is quite helpful.