


Single Family Real Estate Flip Strategy Excel Financial Model


Original price was: $1,200.$850Current price is: $850.
The Single Family Real Estate Flip Strategy Excel Financial Model is developed primarily for real estate investors with little or no previous financial modeling knowledge. It is very user-friendly, editable, fully inter-correlated, and detailed. The Single Family Real Estate Flip Strategy Excel Financial Model includes three statement financial forecasts along with a valuation sheet. This model is an ideal buy for start-up businesses in the field of single-family real estate investment management. The Single Family Real Estate Flip Strategy Excel Financial Model assists in making the decision to grow the business.
Frequently Bought Together
- Description
- Reviews (6)
Description
Single Family Real Estate Flip Strategy Excel Financial Model
Single Family Real Estate Flip Strategy Model is developed primarily for Real Estate investors with little or no previous Financial Modeling knowledge. It is very user-friendly, editable, fully inter-correlated, and detailed. The Single Family Real Estate Flip Strategy Excel Financial Model includes three statement financial forecasts and a valuation sheet.
This Real Estate Financial Model Template is an ideal buy for start-up businesses in the field of single-family real estate investment management. Business owners can use this model to generate equity or debt capital. The Single Family Real Estate Flip Strategy Excel Financial Model assists the owner and investor evaluate the project’s financial feasibility. Net Present Value (NPV) & internal rate of return (IRR) analysis provides easy and swift decision-making in accepting or rejecting the project proposal. Therefore, a finance naïve, with minimum financial technicalities, can use The Single Family Real Estate Flip Strategy Excel Financial Model and make decisions to help grow the business.
Single Family Real Estate Flip Strategy Excel Financial Model offers the financial and business analysis of new investment in Single Family Real Estate Rental Business. The business is run by the ideology of not holding the property for long. This model consists of Three Financial Statements: Monthly Income Statements, Yearly Income statements, Balance Sheets, and Cash Flow statements. The decision-making tools include Break-Even Analysis, Project Valuation, Diagnostic Tools, Startup Summary, and various Charts & Graphs.
How to Use Single-Family Real Estate Flip Strategy Excel Financial Model
A brief overview of the Single-Family Real Estate Flip Strategy Excel Financial Model will start from the Table of Contents section. This is where the whole Structure of the Model appears. A single click on any required sheet will direct the user to that particular sheet without manually jumping through it all.
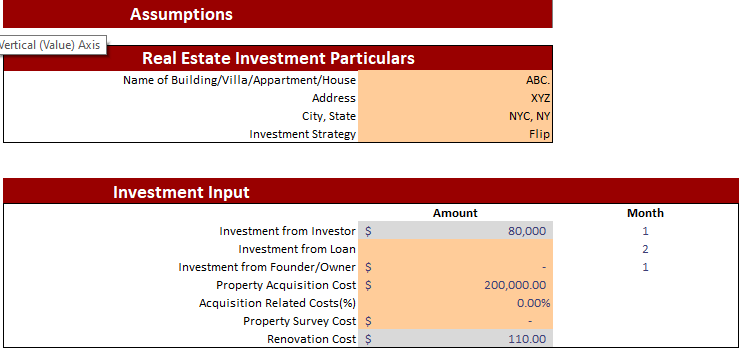
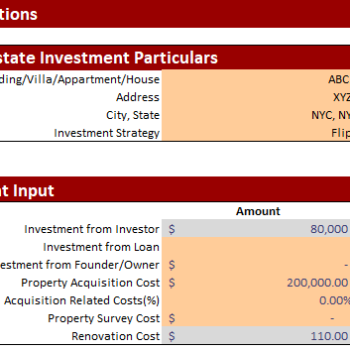
In the Input sheet, the Financial Assumptions and the inputs necessary to compute the model are shown. As investment funding sources, income sources, and expenses. Input cells are in color Peach to help users identify easily. Similarly, other cells such as call-up (direct links from other cells) are grey with black letters, while calculations show white fill and black characters.
In the Operational Tab, all the fixed and variable expenses and their relevant assumption of projections appears. Additionally, the data here is input by the user itself, altering later on if desired.
In the Break-Even analysis, users can identify and get information about the items sold daily and their monetary value.
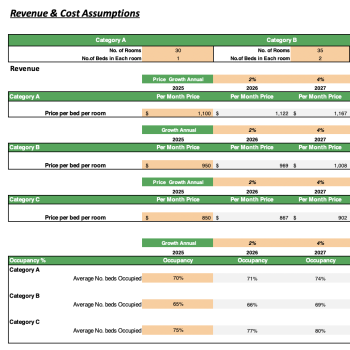
In the Revenue Model, all the Revenue Assumptions along with the costs to sell are set. Thus, it provides a base for developing projections of Performa Templates. Based on the set of revenue assumptions, Profit & Loss Sheets are presented monthly and yearly for up to 5 years—all the fixed and variable expenses minus to ascertain the Net earnings of that particular year or month.
The Cash Flow Statement tab shows the cash flows from various sources. Operating Cash Flow from this sheet is used in the Project Valuation sheet. In the Project Valuation sheet, free cash flow to the firm derives by discounting Future Cash Flow at the discount rate.
The Dashboard tab shows the graphical representation of multiple ratios and analysis for quick overview and decision-making.
Key Inputs of Single Family Real Estate Flip Strategy Excel Financial Model
- Investment Sources
- Property Acquisition Cost
- Renovation Cost
- Debt-Investment Ratio
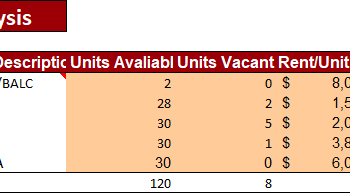
- Rental Income
- Vacancy Ratio
- Future Sale Price
- Tax Rate
- Renovation Cost Table
- Operational Expense
Key Features of Single Family Real Estate Flip Strategy Excel Financial Model
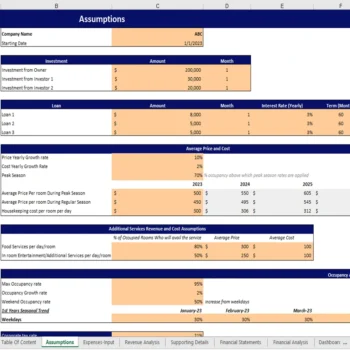
Input Sheet

The Input Sheet specifies all the required inputs necessary to compute three financial statements. First, the owner/investor needs to define the investment funding source, Loan-Value Ratio, and mortgage details. Second, the investment Horizon is the combination of the time required to renovate the property and the time it will take to sell the property.
The Single Family Real Estate Flip Strategy Excel Financial Model primarily focuses on buying, renovating, and selling philosophy. Therefore, rental income and the vacancy rate are also specified in the Input sheet. This assumption will help generate Revenues. Resultantly, the future sale price and associated costs are also described in the Input Sheet.
This financial model template contains inputs that, when changed, impact the calculations and, therefore, the changes are applied to all relevant sheets. Resultantly, this financial model always has built-in flexibility to display different outcomes or final calculations based on this sheet’s changes.
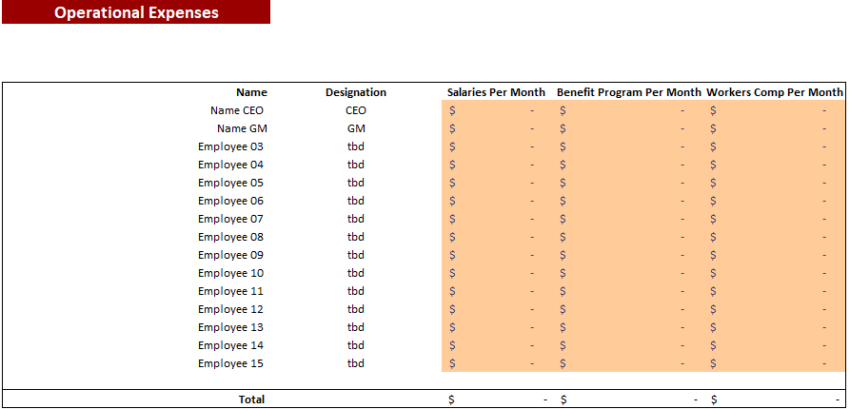
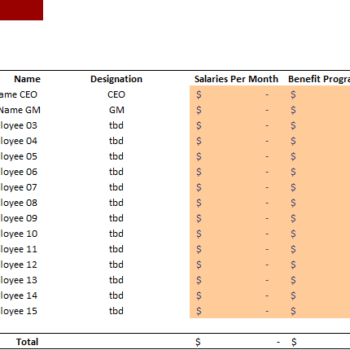
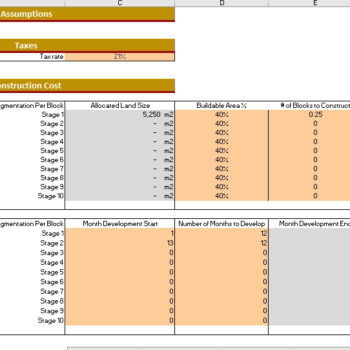
Operational Expenses

The operational expense sheet is next in the row, which entails all expected recurring and non-recurring expenditures. Therefore the owner must account for this while starting the business. It starts with employee’s and consultant’s overhead costs. Apart from a fixed salary, employees benefit worker compensation provision is there so that users don’t have to look around for additional payroll expenses, which arise from time to time. Additionally, the model also incorporates expected cash outflows caused by hiring advisors/ consultants to revamp the business strategy.
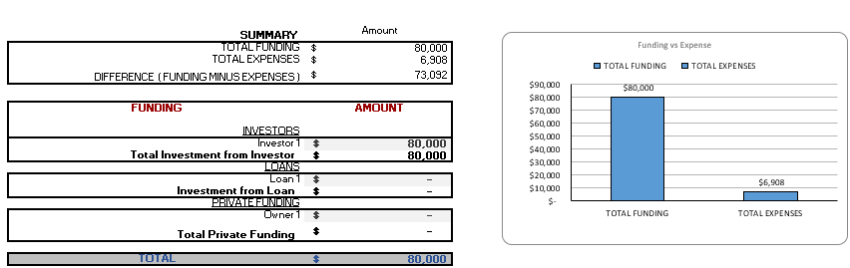
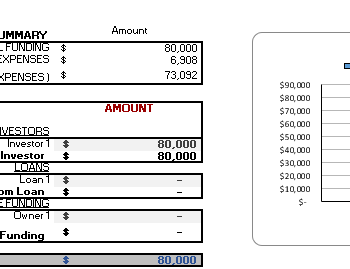
Startup Summary

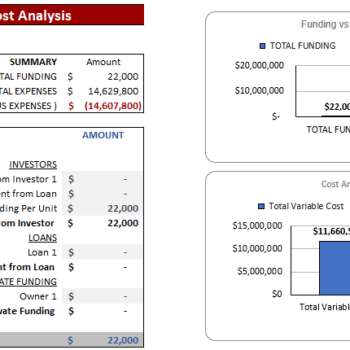
A start-up summary tab includes the total cost incurred at the start of business and capital expenditure, how much cash injected by the company so far, and the amount of investment required is calculated based on the number of months. A Startup Summary helps you take a realistic view of your idea and double-check whether the business has enough funds to support operations.
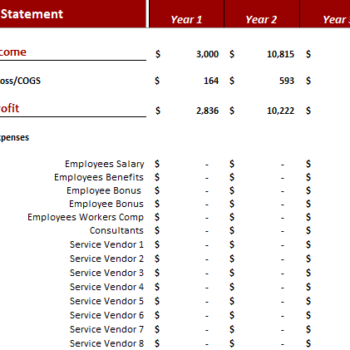
Monthly & Yearly Income Statement

The Single Family Real Estate Flip Strategy Excel Financial Model provides the monthly and yearly income statement structure and a framework for creating a full corporate forecasting model tailored to your particular business.
A vital feature of the single Family Real Estate Flip Strategy Excel Financial Model is that it is “integrated,” which means that the Income Statement accurately captures the connection and inter-linkages of the various line business items. An integrated financial model is powerful. Moreover, it enables the Financial Model user to change any assumption in one part of the statement to see how it impacts the investor’s template of other parts accurately and consistently.
The monthly Income Statement sheet of the Single-Family Real Estate Flip Strategy Excel Financial Model Template is ideal for those who require regular reporting and details. Additionally, Income Statement contains all revenue streamlines with gross earnings, and net earnings linked with a revenue analysis sheet to ensure accurate reporting. Oak Business Consultants understands every business’s goal. Therefore, we have developed a mechanism that helps business owners determine whether they are making profits or otherwise.
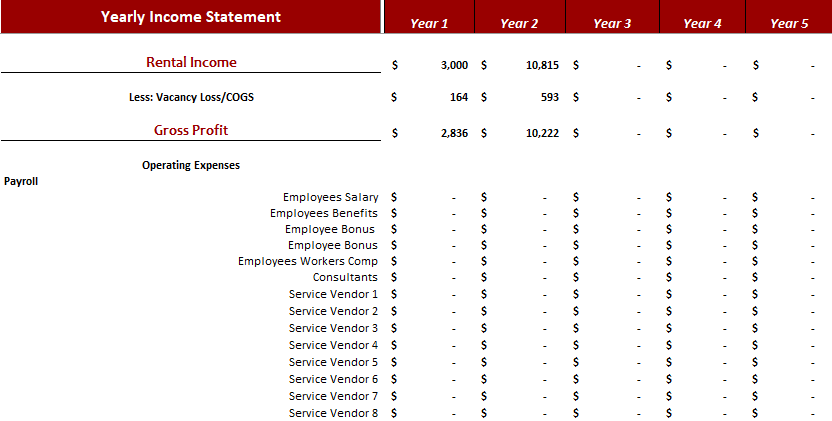
Furthermore, the Yearly Income Statement gives you complete insights into revenue and general & administrative expenses. Moreover, the Yearly Income Statement also contains several graphs, assumptions, ratios, margins, net profit, earnings, cost of services, and profit after tax.
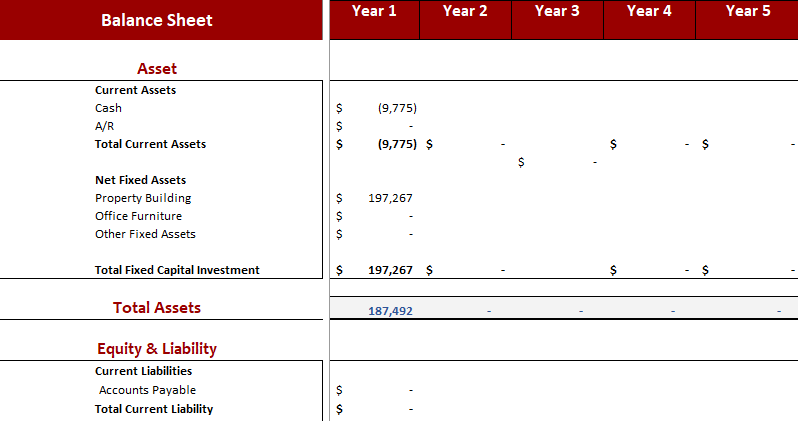
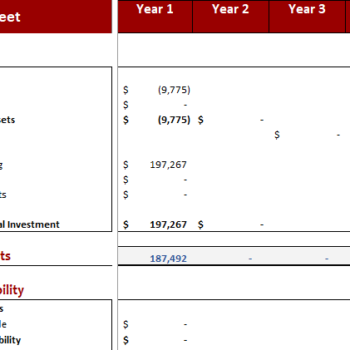
Balance Sheet

This balance sheet enables you to analyze your position of current assets, fixed assets, liabilities, and equity. Moreover, it also allows you to monitor your accounts receivable, accounts payable, accrued expenses, etc. Therefore this specific, financial model gives you the perfect space to analyze your critical financial balance accounts.
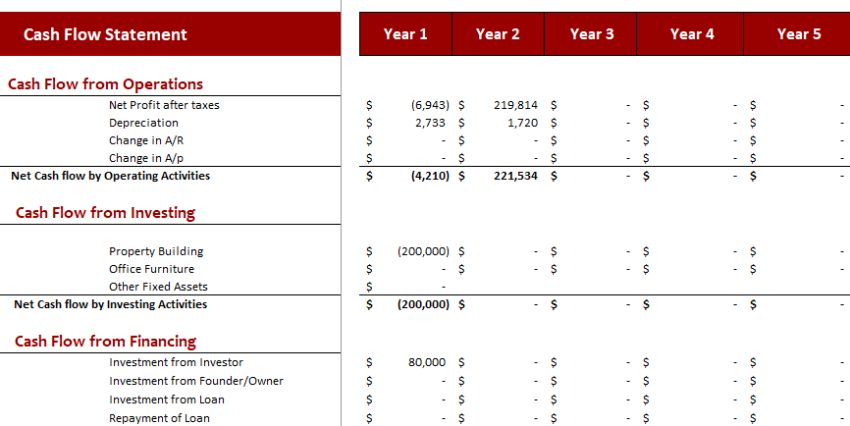
Cash Flow Statement

The Cash Flow Statement is the vital part of the three statements that report the cash spent and generated during a specific period. The Cash Flow Statements act as a bridge between the income statement and the balance sheet. Moreover, it tells how money has moved in and out of business.
Three main sections of the Cash Flow Statement :
- Operating Activities: We put all cash in and out related to the operations of the business.
- Investing Activities: Any cash from the disposal of an asset and acquisition and investments in this section connects to the inputs and fixed asset tab.
- Financing Activities: We have separately made a loan-related tab where you can enter all loan-related information there—the tab links to the Financing Activities of Cash Flow Statement.
The Cash Flow Statement in our Model contains a dedicated sheet to monitor and analyze your company cash-ins and out. This cash flow statement is based on several key inputs: Payable and Receivable Days, yearly income, working capital, long-term debt, net cash, etc. Subsequently, this calculation then computes your net cash flow, and beginning and end cash balances. Moreover, this is a perfect template for your company’s cash flow management.
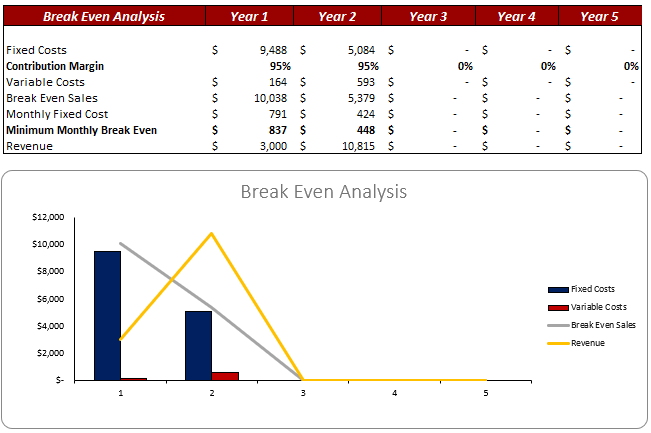
Break-Even Analysis

A break-even analysis can help you measure how different scenarios might play out financially. For example, if you increase the marketing budget or add another employee to the payroll, how many extra sales will recover that additional expense?
We have included a Break-even analysis in our Financial Model, which will help the user determine sales. The break-even analysis will help you know at a glance the profits generated at the various sales levels. The Break-Even Analysis refers to the point. Your total sales contribution refers to fixed costs at zero profit and loss. This Technique consists of marginal costing, which behaves differently at various levels of output activity.
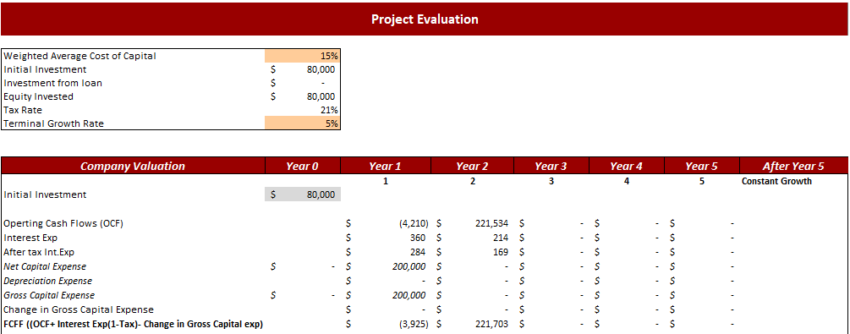
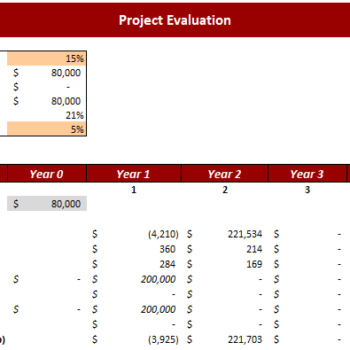
Project Evaluation

Firstly, the project valuation sheet is critical because it gives the directional strategy to an investor on whether the project should be invested in or not. Secondly, the sheet links to all financial statements projected earlier and asks for little input from the user. WACC, the weighted average cost of capital, is discretionary and needs to be put in by the investor itself, keeping in view all equity and debt holders’ costs. The initial investment is the total project cost that the user adds to the input sheet. Equity and debt values in that project investment amount took from loan-value ratios. Thereafter, the user defines in the input sheet.
Additionally, the terminal growth rate is the rate that users foresee a business may earn after a five-year forecast. This rate is hard coded by the user, keeping in view a specific industry, country, and region in mind. The sole purpose of the project valuation sheet is to use the DCF model to discount back all future expected cash flows of the firm at a discount rate or WACC (set by the user). Then determine the NPV/ free cash flows to the firm (both equity and debt holders) so that investors can see if the project has positive or negative net cash flows. Next, the debt/ loan amount is minus to arrive at free cash flows to equity holders. Finally, IRR equals IRR function to see if the project’s IRR is greater than or less than the discount rate.
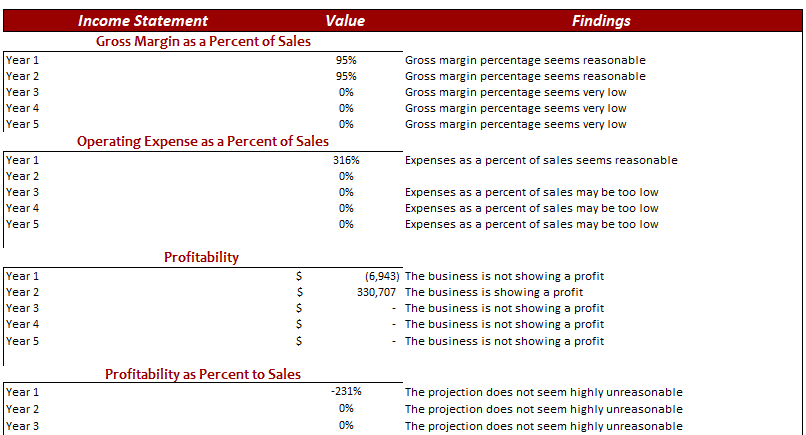
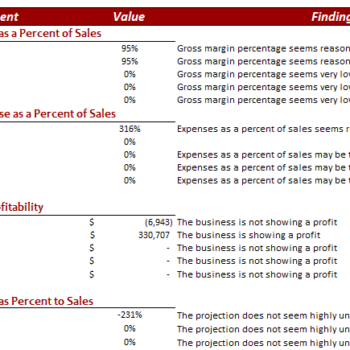
Diagnostic Sheet

The diagnostic tool sheet again is a compact pitch book for fund generation marketing strategy. Here probable investors can quickly analyze and access profit margins, cash flows, and break-even metrics to decide. Concludingly, for example, whether suppose to invest in this business or not. Additionally, all the outcomes of the dashboard and diagnostic tool sheets require no user interference. Therefore saving time and cost for the business owner. In addition, this Diagnostic sheet automatically calculates the data such as the Profitability ratio, Net operating expense. Resultantly, it will provide financial commentary about the company’s financials.
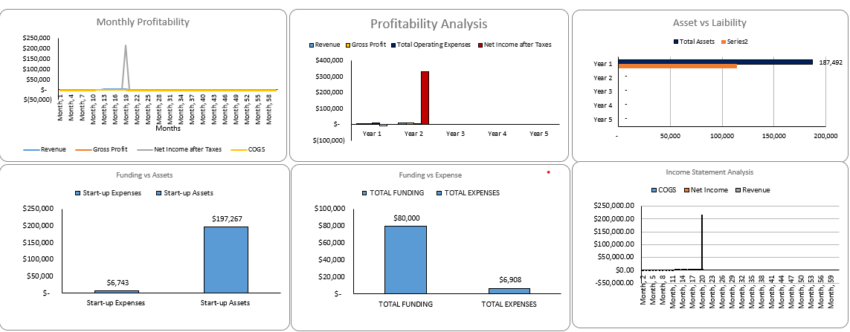
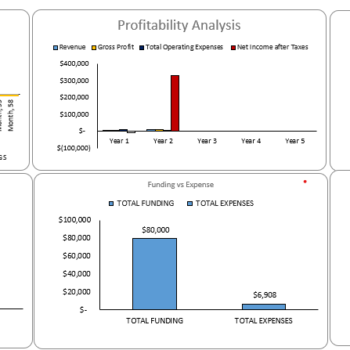
Dashboard

Primarily, users and readers respond, resultantly, to process visual graphs better than data. Furthermore, This dashboard provides you with a graphical management tool that enables you to track all your relevant financial KPIs, improve cash flow management, and track expenses, sales, and net revenue in detail to meet and outperform the financial objectives of your business.
Benefits of Single Family Real Estate Flip Strategy Excel Financial Model
Enhance Company Performance- The Single Family, Real Estate Flip Strategy Excel Financial Model analysis simplifies a company’s financial statements. It allows the user to express critical profitability and financial position information in just a few numbers. For example, the company’s net profit margin considers the net effect of a company’s revenues and all expenses. Therefore, it will enable the user to conclude a company’s profitability without going through lengthy accounts statements.
Bottom Line – The Single Family Real Estate Flip Strategy Excel Financial Model can be the key to your company’s better and informed future. Succeeding to plan your Company’s finances well will mean overall success in making wise investment decisions, purchasing the right operating assets, controlling costs, and determining company valuation.
Accommodates Investors – Firstly, the Single Family Real Estate Flip Strategy Excel Financial Model provides valuation and performance analysis charts. Secondly, it enables the investors and banks to determine the company’s worth considering lending funds to your company.
Based on Financial Principles – We did in-depth research on The Single Family Real Estate Flip Strategy Excel Financial Model. Moreover, this financial model is logically correct. Resultantly it is based on financial and economic principles and assumptions.
Properly Integrated – Primarily, the model assumptions and calculations depend on each other. Therefore, the change in the main sheet will automatically lead to the change in all related sheets easily.
Visualization Tool – This Financial model also prepares a clear communication of the quantitative outcomes, as obtained by calculations via various graphs and charts. Therefore, the user does not need to pay much attention to the financial model’s inner workings.
This Product Includes: 1 Excel File
6 reviews for Single Family Real Estate Flip Strategy Excel Financial Model
Add a review
You must be logged in to post a review.


Lily whit –
I’ve been flipping properties for years, and this model is by far the most reliable one I’ve come across.
Wills Bradford –
It takes the guesswork out of financial planning and decision-making.
Sassy Crew –
I used this model for my recent property flip, and it was spot on. It covered every key metric I needed, from cash flow to ROI. Highly recommend it.
Nayle Loie –
A must-have tool for real estate investors. The model is detailed yet easy to use, and it simplifies the complexities of flipping single-family properties.
William Richie –
This financial model is outstanding! It helped me analyze my flip deals with precision, ensuring I could forecast profits accurately before making any investment decisions.
Jasmine Chen –
As a real estate investor with limited financial modeling experience, I found this tool to be incredibly user-friendly and informative. Highly recommended!