


Art Gallery Financial Model Excel Template


Original price was: $350.$150Current price is: $150.
A tremendous financial model template perfect for beginners. Suppose you are unaware of financial modeling and looking for a simple-to-use template. This model will work for your Hostel business. We have carefully studied and researched the company and developed a template including all relevant analyses and inputs. The Art Gallery Excel Financial Model Template is excellent value for money. Give it a try!
Frequently Bought Together
- Description
- Reviews (6)
Description
Art Gallery Excel Financial Model Template
Introduction to Art Gallery Excel Financial Model Template
Art Gallery Excel Financial Model Template presents the business case of a brand new start-up Online Shop with an upfront investment in a website, SEO, logo, and copywriting. The model contains the three financial statements including the cash flows and calculates the relevant metrics (Sensitivity Analysis, Break-even Analysis, Diagnostic Tools, Project evaluation, and Charts). The financing options for the project include a standard long-term loan as well as an investment made by the investors and of course marketing sheet (including automated inbound and outbound marketing costs sheet which also contains how many customers will achieve as a result).
So a quick overview of the Financial Model, in the contents tab you can see the structure of the model and by clicking on any of the headlines be redirected to the relevant worksheet.
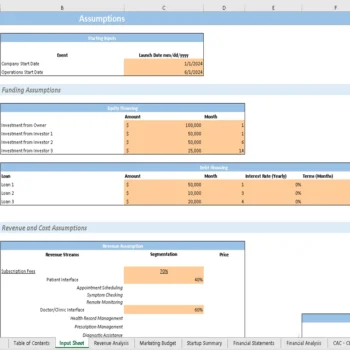
Input tab
You can feed the financial information for the model, such as sales price, cost, expenses, etc. Inputs are always depicted with a Peach fill and grey letters, calls up (that is, direct links from other cells) are filled in grey with black letters, while calculations are depicted with white fill and black characters.
In the sensitivity analysis tab, you can see a high-level report with the main business scenarios. The tab shows how the company’s profit will look in case of any uncertainty. For example, if the cost or expenses increased by 10%.
Another useful tab is the break-even analysis, where you can see the items to sell every day and their currency value to break even.
- Revenue Calculations: The revenue streams and assumptions outlined in the table reflect a comprehensive model for an Art gallery or event-focused business. Key revenue streams include fees for Independent Artwork Sales, such as artwork registration and commissions on sales, and Exhibition Fees, covering gallery-hosted or artist-sponsored events, along with add-on services like custom setups and marketing. Additional streams are derived from Event Rentals (e.g., corporate or private events), with options for add-on services, Membership Programs (for artists and visitors, including discounts), and Ticket Sales for exhibitions. Pricing is based on units like per artwork, per day, or as a percentage of service rates. Costs directly associated with these streams include setup, staff coordination, space preparation, and promotional activities, often calculated as percentages of revenue or unit costs. This structure ensures alignment of revenue opportunities with operational cost management.
- The Dashboard tab: Various graphs present the revenues, cash analysis, break-even analysis, sensitivity, assets vs. liabilities, sales analysis, etc.
Key Inputs of Art Gallery Excel Financial Model Template
- The growth rate Price and Expense.
- Various prices and segmentation of revenue.
- Marketing Budget Sheet (which measures how many customers we get from marketing).
- Revenue Assumptions
- Average Payable and Receivable days your business is following.
- Cost of Goods.
- Fixed Asset and Capital Expenditure.
- Tax Rate
- Investment table
- Loan table
Key Features of Art Gallery Excel Financial Model Template
Input Sheet
This financial model template contains inputs that, when changed, impact the calculations and, therefore, the changes are applied to all relevant sheets. This financial model always has built-in flexibility to display different outcomes or final calculations based on this sheet’s changes.

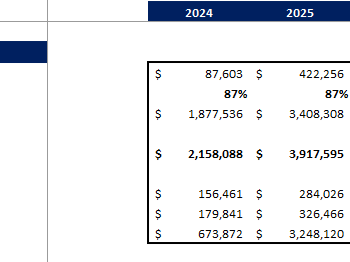
Revenue & Cost Analysis
The Revenue & Cost Analysis highlights a robust growth strategy over five years, focusing on expanding independent artwork sales, exhibitions, and events. Artwork registrations and sales show consistent upward trends, supported by online catalogues, permanent, and rotating displays. This overview emphasizes scalability, enhanced engagement, and sustainable operations.

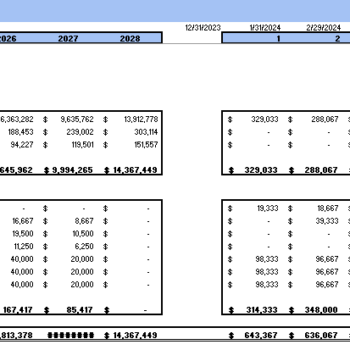
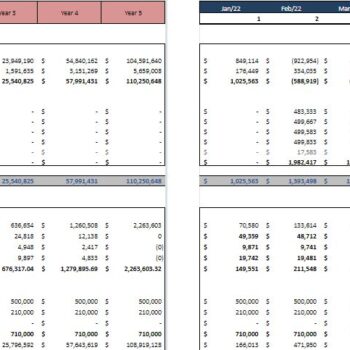
Monthly & Yearly Income Statement
The Art Gallery Excel Financial Model provides the monthly as well as yearly income statement structure and a framework for creating a full corporate forecasting model tailored to your particular business.
A key feature of the Art Gallery Excel Financial Model is that it has “integration,” which simply means that the Income Statement is in a way that accurately captures the connection and has inter-linkages of the various line business items. An integrated financial model is powerful since it enables the Financial Model user to change any assumption in one part of the statement in order to see how it impacts all other parts of the statements accurately and consistently.
Monthly Income Statement: The monthly Income Statement sheet of the Art Gallery Excel Financial Model is perfect for those who require regular reporting and details. Additionally, Income Statement contains all revenue streamlines with gross earnings, and net earnings linked with a revenue analysis sheet to ensure accurate reporting. Oak Business Consultants understands every Art Gallery Excel business’s goal. Therefore, we have developed a mechanism that helps business owners determine whether they are making profits or not.

Yearly Income Statement: Yearly Income Statement gives you complete insights into revenue and general & administrative expenses. The Yearly Income Statement also contains several graphs, assumptions, ratios, margins, net profit, earnings, cost of services, and profit after tax.

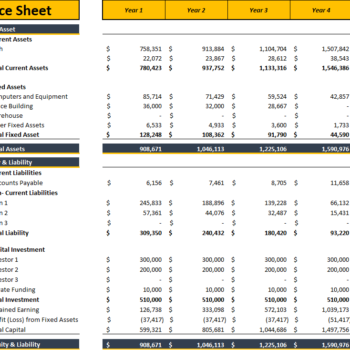
Balance Sheet
This balance sheet enables you to analyze your position of current assets, fixed assets, liabilities, and equity. This also allows you to monitor your accounts receivable, accounts payable, accrued expenses, etc. Therefore, this specific, financial model gives you the perfect space to analyze your key financial balance accounts.

Cash Flow Statement
The Cash Flow Statement is the vital part of the three statements that report the cash spent and generated during a specific period. The Cash Flow Statements act as a bridge between the income statement and the balance sheet. It tells how money has moved in and out of the business.

Three main sections of the Cash flow Statement:
- Operating Activities: We have included all cash in and out related to the operations of the business
- Investing Activities: Any cash from the disposal of an asset and acquisition and investments is in this section that is linked to the inputs and fixed asset tab.
- Financing Activities: We have separately made a loan-related tab where you can enter all loan-related information thee. The tab is linked to the Financing Activities of Cash flow Statement
The Cashflow Statement in our Model contains a dedicated sheet to monitor and analyze your company cash-ins and out. This cash flow statement is based on several key inputs, such as Payable and Receivable Days, yearly income, working capital, long-term debt, net cash, etc. This calculation then computes your net cash flow, and beginning and end cash balances. This is a perfect template for your company’s cash flow management.
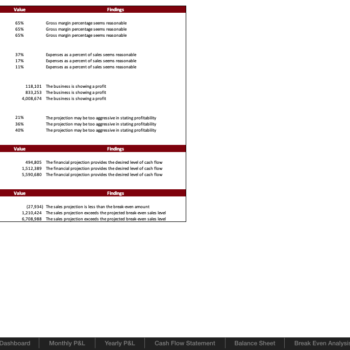
Break-Even Analysis
A break-even analysis can help you measure how different scenarios might play out financially. For example, if you increase the marketing budget or add another employee to the payroll, how many extra sales will be needed to recover that additional expense?

we have included a Break-even analysis of our Financial Model which will help the user to determine sales. The break-even analysis will help you know at a glance, the profits generated at the various sales levels. The Break-Even Analysis refers to the point where your total sales contribution refers to fixed cost at zero profit and loss. This Technique is primarily based on marginal costing, which behaves differently at various levels of output activity.
Project Evaluation
Since the table calculates Return on Investment, Investor’s Future Equity Share, and Cash Burn Rate Analysis, analyzing the company’s performance becomes easy to capture potential investors.

Sales Analysis
The sales analysis projects steady growth across key revenue streams, including independent artwork sales, exhibitions, events, and memberships/tickets over five years. Gross profits and margins improve year-on-year, driven by increasing revenues and efficient cost controls. This analysis highlights a balanced and diversified approach to generating sustainable financial performance.

Supporting schedules
The supporting schedules outline employee compensation, departmental expenses, and operating costs. This detailed view helps in allocating resources effectively and understanding the financial structure of the business.

Dashboard
Users and readers respond and process visual graphs better than data. Furthermore, This dashboard provides you a graphical management tool that enables you to track all your relevant financial KPIs, improve cash flow management, and track expenses, sales, and net revenue in detail to meet and outperform the financial objectives of your business.

Benefits of Art Gallery Excel Financial Model Template
- Encapsulate Company Performance- The Art Gallery Excel Financial Model analysis simplifies a company’s financial statements. It allows the user to express critical profitability and financial position information in just a few numbers. For example, the company’s net profit margin encapsulates the net effect of a company’s revenues and all expenses. It will enable the user to conclude a company’s profitability without going through lengthy accounts statements.
- Bottom Line – A Online Art Gallery Excel financial model can be the key to your company’s better and informed future. Succeeding to plan your Company’s finances well will mean overall success in making wise investment decisions, purchasing the right operating assets, controlling costs, and determining company valuation.
- Accommodates Investors – This model provides valuation and performance analysis charts. It enables the investors and banks to clearly determine the company’s actual worth considering lending funds to your company.
- Based on Financial Principles – We did in-depth research on a Courier business model. So this financial model has logically correct financial and economic principles and assumptions.
- Integration – The model assumptions and calculation have proper integration. So the change in the main sheet will automatically lead to the change in all related sheets easily.
- Visualization Tool – This Financial model also prepares a clear communication of the quantitative outcomes. As obtained by calculations via various graphs and charts. Therefore, the user does not need to pay much attention to the financial model’s inner workings.
FAQ’s
1. What is the purpose of this template?
The Art Gallery Excel Financial Model Template is designed to help art gallery owners and managers forecast financial performance, analyze revenues and costs, and develop growth strategies. It provides insights into artwork sales, exhibitions, memberships, and events.
2. What key features are included in the model?
- Revenue Projections: Includes detailed forecasts for artwork sales, exhibitions, memberships, and events.
- Cost Analysis: Covers direct costs, operating expenses, and gross profit margins.
- Exhibition & Event Management: Tracks hosted and sponsored exhibitions, event days, and related revenues.
- Membership and Ticketing Revenue: Projects membership programs and ticket sales for sustainable income.
- Scalability: Year-on-year growth assumptions and terminal growth rates are incorporated
3. Is the model customizable?
Yes, the template is fully customizable. Users can modify assumptions, inputs, and calculations to align with their specific business needs and market conditions.
4. Does it include visualizations?
Yes, the model includes charts and graphs for revenue, cost, and profitability trends, making it easier to interpret data and present to stakeholders.
5. Is this template suitable for startups?
Yes, it is particularly useful for new art galleries, as it provides a framework for understanding costs, setting realistic revenue targets, and planning for growth.
NOTE
Our product is digital, so we cannot offer returns or exchanges on such items. We encourage any queries or clarifications to be addressed prior to finalizing your purchase.
THANK YOU FOR VISITING OAK BUSINESS CONSULTANT.
Walkthrough Video for the Art Gallery Excel Financial Model
6 reviews for Art Gallery Financial Model Excel Template
Add a review
You must be logged in to post a review.


Jona Sfarad –
The Art Gallery Financial Model gave us insights into managing exhibition costs and sponsorship revenue. It’s well-structured and user-friendly.
Liam Randor –
The scenario analysis allowed us to test pricing strategies and forecast revenue. It’s been invaluable in planning our art events.
Sophia Larkin –
A must-have for gallery owners.
Ashcrof Mill –
The Art Gallery Financial Model helped us evaluate revenue from exhibitions and individual artwork sales
Ethn Brew –
This model gave us a comprehensive financial overview of our gallery. It’s perfect for tracking art sales, exhibitions, and operational expenses
Leslie Charles –
I had a great experience. The team was very professional and easy to work with. They made sure to include all the essential KPI’s and charts in their excel model.