Best Sport and Fitness Financial Models
Fitness financial model: find your break-even member count
The fitness industry has grown steadily. Health & Fitness Association (HFA) benchmarking has reported median revenue growth close to 10% a year among operators. Median net membership has grown more slowly, and median EBITDA margins have stayed above 20%.
Those are medians from established operators. A new studio, club or gym starts without that history. A lender or partner wants one number from you. It is the member count at which the business stops needing your savings, and how fast you can reach it. A sport and fitness financial model exists to show that number.
Why fitness models run on members, not revenue
Revenue in most fitness businesses is a simple product: active members times the average fee. The hard part is forecasting the member count. It moves with three inputs: how many people join each month, how many leave, and how many the space can hold.
Joiners are a marketing assumption. Leavers are a retention assumption. Capacity is a physical limit. A model that blends them into one growth rate hides the risk in each.
Retention deserves the most scrutiny
HFA benchmarking has put average annual operator retention at about 66%. On that figure, a club with 1,000 members loses about 340 a year and has to replace them just to stay level.
Test every class-based model against itself. Suppose a studio runs 40 classes a week with 20 spots each and an 80% fill rate. That is 640 attendances a week. With 150 members, each person would need to attend more than four classes weekly. Few members do, so either the member count or the fill rate is too high.
Build the forecast monthly. Sign-ups bunch up in January and thin out in summer, while rent and payroll stay the same.
A worked example: when does a gym reach break-even?
The numbers below are illustrative, not benchmarks. Take a gym with $20,000 in monthly fixed costs, a $60 average fee and $10 of variable cost per member. Each member contributes $50 a month. Break-even is $20,000 ÷ $50, or 400 members.
Now add churn. Annual retention of about 66% works out to roughly 3.3% of members leaving each month. The joiner rate then decides the outcome:
| New members per month | Members at month 12 | Months to reach 400 | Where the base levels off |
| 15 | about 150 | Not within three years | about 455 |
| 30 | about 300 | about 18 | about 910 |
| 40 | about 400 | about 12 | about 1,210 |
The first row is the warning. At 15 joiners a month, the gym loses members almost as fast as it wins them. It only just clears break-even after years of losses. To hold 400 members at all, the gym needs at least 13 new joiners every month. A single blended growth rate would never show this.
Run the same table with your own price, cost and churn. Then add the cash lost while the base builds. That total is the funding the business needs before it pays for itself.
Three gym formats, three different risks
Three formats dominate gym ownership: the boutique studio, the big-box gym and the hybrid. Each has a different main risk, so each needs different inputs. Replace any template figure with local quotes for rent, equipment and staff.
| Format | What it sells | Main risk | What the model must show |
| Boutique studio | Premium classes to a small group | Weak class fill and instructor cost | Break-even fill rate and a firm member cap |
| Big-box gym | Low-priced access to thousands of members | One weak retention year and a long payback on the build-out | Churn by month and a multi-year ramp |
| Hybrid gym | Open access plus coached sessions | Forecasting two member bases at once | Separate price, cap and churn for each tier |
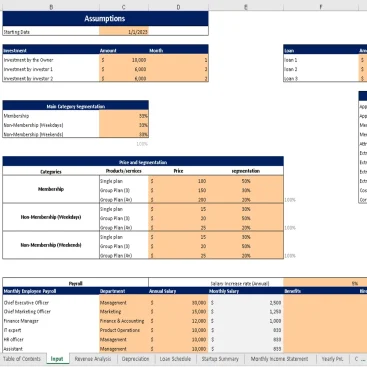
The boutique model earns strong margins when classes fill and thin ones when they do not. The big-box model repays its build-out slowly, so retention matters most. The hybrid model smooths revenue, but it doubles the assumptions. A gym financial model should let you set a separate price, member cap and churn rate for each tier. One blended average will mislead. Oak’s fitness center financial model is built around that kind of input sheet.
Studios and personal training: model the session, not the month

Excel Financial Model

Excel Financial Model
Yoga, Pilates and similar studios earn money one class at a time. The inputs that matter are classes per week, spots per class, the average fill rate and what each instructor earns per class. Rent usually stays flat, so the break-even fill rate is the number to watch. Oak’s yoga and wellness center case study shows how that structure works in practice.
Personal training has a hard ceiling. A trainer can deliver only so many sessions a week, so revenue cannot exceed trainers times sessions times rate. Cancellations and gaps between clients lower the real figure. Prepaid packages bring cash in early but create a service obligation. A personal trainer financial model should track both.
Sports clubs and court or field facilities



Soccer, volleyball, tennis and baseball cage clubs share one big cost: the space. Field, court or cage rent is usually the largest expense, so hourly utilization drives the model. Evening slots may fill while weekday mornings sit empty, and a single average utilization figure hides that gap.
Revenue comes from several places: membership or registration fees, league and tournament entries, hourly rentals, coaching and concessions. Club structure matters too. A commercial club charges to earn a profit, a non-profit club aims to cover costs, and a volunteer club splits expenses among its members. Each needs different assumptions for fees, staffing and growth. Oak’s soccer club financial model covers the commercial case, and the same logic carries over to other team and racquet sports.
Model coaching on its own line. Lessons and camps bring steady income outside match days. Coach pay can still outgrow fees if it is not tied to enrollment.
Pay-per-visit venues: bowling, skating and golf

Excel Financial Model


Excel Financial Model
Venues that charge per visit have no member base to lean on. Revenue per hour of lane, rink or tee time is the core measure, along with what each visitor spends on food, drinks and rentals.
A bowling alley financial model usually splits league play, open play and event bookings. League nights are predictable, while open play depends on weather and local competition. Skating rinks earn from admission, skate rental, birthday parties and snack sales. Party bookings can fill hours that would otherwise sit idle.
Golf sits at the capital-heavy end. Land, permits, water and course construction all come before the first paying round. The model needs a build phase and a long payback period. Local zoning and permit rules can change both cost and timing, so check them before fixing the schedule.
Online fitness consulting: fewer limits, different risks


Excel Financial Model
Online coaching removes rent and capacity limits. It adds new risks. Customer acquisition cost, the share of free followers who become paying clients and monthly cancellations drive the result. A coach who delivers one-to-one programs still has a time ceiling. Premium coaching revenue stops growing even when the audience keeps growing.
Platform fees, payment fees and content production belong in the cost lines. Oak’s online fitness consulting financial model separates digital products from coached programs for that reason.
Metrics every fitness model should show
| Metric | What it shows | Common modeling error |
| Active members | The paying base after joiners and leavers | Ignoring the capacity limit |
| Monthly churn | How fast members leave | One flat rate for every tier and month |
| Average revenue per member | Pricing and plan mix | Assuming everyone buys the premium plan |
| Class fill rate or hourly utilization | How well the space earns | Averaging peak and off-peak hours |
| Acquisition cost and payback | What each new member costs to win | Holding marketing spend flat after launch |
| EBITDA margin | Operating profit after costs | Comparing a startup to mature-operator medians |
| Cash runway | Months before funding runs out | Counting prepaid memberships as earned revenue |
The median EBITDA margin above 20% that HFA benchmarking reports is a reference point for mature operators. A first-year business is unlikely to match it while it still carries launch costs.
Stress tests before you sign a lease
Run three cases against the base forecast. Each one takes a few minutes in a monthly model.
- Slow joiners. Cut new members by a third. Check how long break-even moves and how much extra cash the business needs.
- Higher churn. Raise monthly churn by one point. Watch where the member base levels off.
- Late opening. Delay opening by two months. Rent and loan payments start anyway, so idle cost builds up.
If the business survives all three, the plan is sturdier than most. If it does not, change the lease terms, the price or the launch budget now, while changing them is still free.
Frequently Asked Questions
How many members does a gym need to break even?
Divide monthly fixed costs by what each member contributes after variable costs. With $20,000 in fixed costs, a $60 fee and $10 of variable cost per member, the answer is 400 members. Those are round numbers for illustration. Real break-even depends on your own fees, rent and staffing.
What churn rate should a fitness financial model assume?
Use your own data if you have it. If you do not, start from the roughly 66% annual retention found in HFA benchmarking and test a worse case. Cancellations tend to cluster in a new member’s first months, so one flat rate understates early losses.
Can one model cover a boutique studio and a big-box gym?
No. Capacity, price, staffing and capital needs differ too much. A big-box model needs a long ramp-up and heavy build-out spending. A studio model needs class-level inputs.
Does a solo personal trainer need a financial model?
Yes, a small one. It shows how many sessions a week cover living costs and business costs, and what happens when clients cancel.
How should a model handle the January rush and the summer dip?
Forecast joiners and leavers month by month. Let January joiners rise and summer joiners fall while rent and payroll stay level. The gap shows how much cash reserve the first summer needs.
How long should the projection run?
Three to five years, with the first 24 months shown monthly. A large gym can take two years or more to break even, so a shorter monthly window may end before the business turns profitable.
Conclusion
A good fitness model ends in one number: the members, sessions or rental hours at which the business pays for itself. Everything else in the file, from churn to build-out cost, exists to make that number believable. Owners who build it before signing a lease can walk away from a bad site while walking away is still free.
Oak builds financial models for gyms, studios, sports clubs and online coaching businesses, using your own pricing, capacity and cost quotes. Owners who want ongoing help with cash planning and lender reporting can add Oak’s virtual CFO services on a part-time basis.